
AIDA64
AIDA has been a long time tool used for monitoring, stress testing and even benchmarking.
AIDA64 CPU benchmarks are elaborate and test a ton of different capabilities of your system.
Here are descriptions of each benchmark to help better explain what these results mean.
Benchmarking
Benchmark pages of AIDA64 Extreme provide several methods to measure system performance. These benchmarks are synthetic, so their results show only the theoretical (maximum) performance of the system.
CPU and FPU benchmarks of AIDA64 Extreme are built on the multi-threaded AIDA64 Benchmark Engine that supports up to 1280 simultaneous processing threads. It also supports multi-processor, multi-core and HyperThreading enabled systems.
Ray tracing benchmarks

These benchmarks measure the single and double precision (also known as 32-bit and 64-bit) floating-point performance through the computation of a scene with a SIMD-enhanced ray tracing engine. The code behind this benchmark method is written in Assembly, and it is extremely optimized for every popular AMD, Intel and VIA processor core variants by utilizing the appropriate x87, SSE, SSE2, SSE3, SSSE3, SSE4.1, AVX, AVX2, XOP, FMA, FMA4 and AVX-512 instruction set extension. Both FP32 and FP64 Ray-Trace test is HyperThreading, multi-processor (SMP) and multi-core (CMP) aware.
Memory Tests
Memory bandwidth benchmarks (Memory Read, Memory Write, Memory Copy) measure the maximum achievable memory data transfer bandwidth. The code behind these benchmark methods are written in Assembly and they are extremely optimized for every popular AMD, Intel and VIA processor core variants by utilizing the appropriate x86/x64, x87, MMX, MMX+, 3DNow!, SSE, SSE2, SSE4.1, AVX, AVX2 and AVX-512 instruction set extension.
The Memory Latency benchmark measures the typical delay when the CPU reads data from system memory. Memory latency time means the penalty measured from the issuing of the read command until the data arrives to the integer registers of the CPU.
CPU Queen Benchmark

This simple integer benchmark focuses on the branch prediction capabilities and the misprediction penalties of the CPU. It finds the solutions for the classic “Queens problem” on a 10 by 10 sized chessboard. At the same clock speed theoretically, the processor with the shorter pipeline and smaller misprediction penalties will attain higher benchmark scores. For example — with HyperThreading disabled — the Intel Northwood core processors get higher scores than the Intel Prescott core based ones due to the 20-step vs 31-step long pipeline. CPU Queen test uses integer MMX, SSE2 and SSSE3 optimizations.
CPU PhotoWorxx Benchmark

This benchmark performs different common tasks used during digital photo processing.
It performs the following tasks on a very large RGB image:
- Fill the image with random colored pixels
- Rotate 90 degrees CCW
- Rotate 180 degrees
- Difference
- Color space conversion (used e.g. during JPEG conversion)
This benchmark stresses the SIMD integer arithmetic execution units of the CPU and also the memory subsystem. CPU PhotoWorxx test uses the appropriate x87, MMX, MMX+, 3DNow!, 3DNow!+, SSE, SSE2, SSSE3, SSE4.1, SSE4A, AVX, AVX2, XOP and AVX-512 instruction set extension and it is NUMA, HyperThreading, multi-processor (SMP) and multi-core (CMP) aware.
CPU ZLib Benchmark
This integer benchmark measures combined CPU and memory subsystem performance through the public ZLib compression library. CPU ZLib test uses only the basic x86 instructions, and it is HyperThreading, multi-processor (SMP) and multi-core (CMP) aware.
CPU AES Benchmark
This benchmark measures CPU performance using AES (Advanced Encryption Standard) data encryption. In cryptography, AES is a symmetric-key encryption standard. AES is used in several compression tools today, like 7z, RAR, WinZip, and also in disk encryption solutions like BitLocker, FileVault (Mac OS X), TrueCrypt.
CPU AES test uses the appropriate x86, MMX and SSE4.1 instructions, and it’s hardware accelerated on VIA PadLock Security Engine capable VIA C3, VIA C7, VIA Nano and VIA QuadCore processors; and on Intel AES-NI instruction set extension and the future VAES capable processors. The test is HyperThreading, multi-processor (SMP) and multi-core (CMP) aware.
CPU Hash Benchmark
This benchmark measures CPU performance using the SHA1 hashing algorithm defined in the Federal Information Processing Standards Publication 180-4. The code behind this benchmark method is written in Assembly, and it is optimized for every popular AMD, Intel and VIA processor core variants by utilizing the appropriate MMX, MMX+/SSE, SSE2, SSSE3, AVX, AVX2, XOP, BMI, BMI2 and AVX-512 instruction set extension. CPU Hash benchmark is hardware accelerated on VIA PadLock Security Engine capable VIA C7, VIA Nano and VIA QuadCore processors.
FPU VP8 Benchmark
This benchmark measures video compression performance using the Google VP8 (WebM) video codec Version 1.1.0 (http://www.webmproject.org). FPU VP8 test encodes 1280×720 pixel (“HD ready”) resolution video frames in 1-pass mode at 8192 kbps bitrate with best quality settings. The content of the frames are generated by the FPU Julia fractal module. The code behind this benchmark method utilizes the appropriate MMX, SSE2, SSSE3 or SSE4.1 instruction set extension, and it is HyperThreading, multi-processor (SMP) and multi-core (CMP) aware.
FPU Julia Benchmark

This benchmark measures the single precision (also known as 32-bit) floating-point performance through the computation of several frames of the popular “Julia” fractal. The code behind this benchmark method is written in Assembly, and it is extremely optimized for every popular AMD, Intel and VIA processor core variants by utilizing the appropriate x87, 3DNow!, 3DNow!+, SSE, AVX, AVX2, FMA, FMA4 and AVX-512 instruction set extension. FPU Julia test is HyperThreading, multi-processor (SMP) and multi-core (CMP) aware.
FPU Mandel Benchmark

This benchmark measures the double precision (also known as 64-bit) floating-point performance through the computation of several frames of the popular “Mandelbrot” fractal. The code behind this benchmark method is written in Assembly, and it is extremely optimized for every popular AMD, Intel and VIA processor core variants by utilizing the appropriate x87, SSE2, AVX, AVX2, FMA, FMA4 and AVX-512 instruction set extension. FPU Mandel test is HyperThreading, multi-processor (SMP) and multi-core (CMP) aware.
FPU SinJulia Benchmark

This benchmark measures the extended precision (also known as 80-bit) floating-point performance through the computation of a single frame of a modified “Julia” fractal. The code behind this benchmark method is written in Assembly, and it is extremely optimized for every popular AMD, Intel and VIA processor core variants by utilizing trigonometric and exponential x87 instructions. FPU SinJulia is HyperThreading, multi-processor (SMP) and multi-core (CMP) aware.
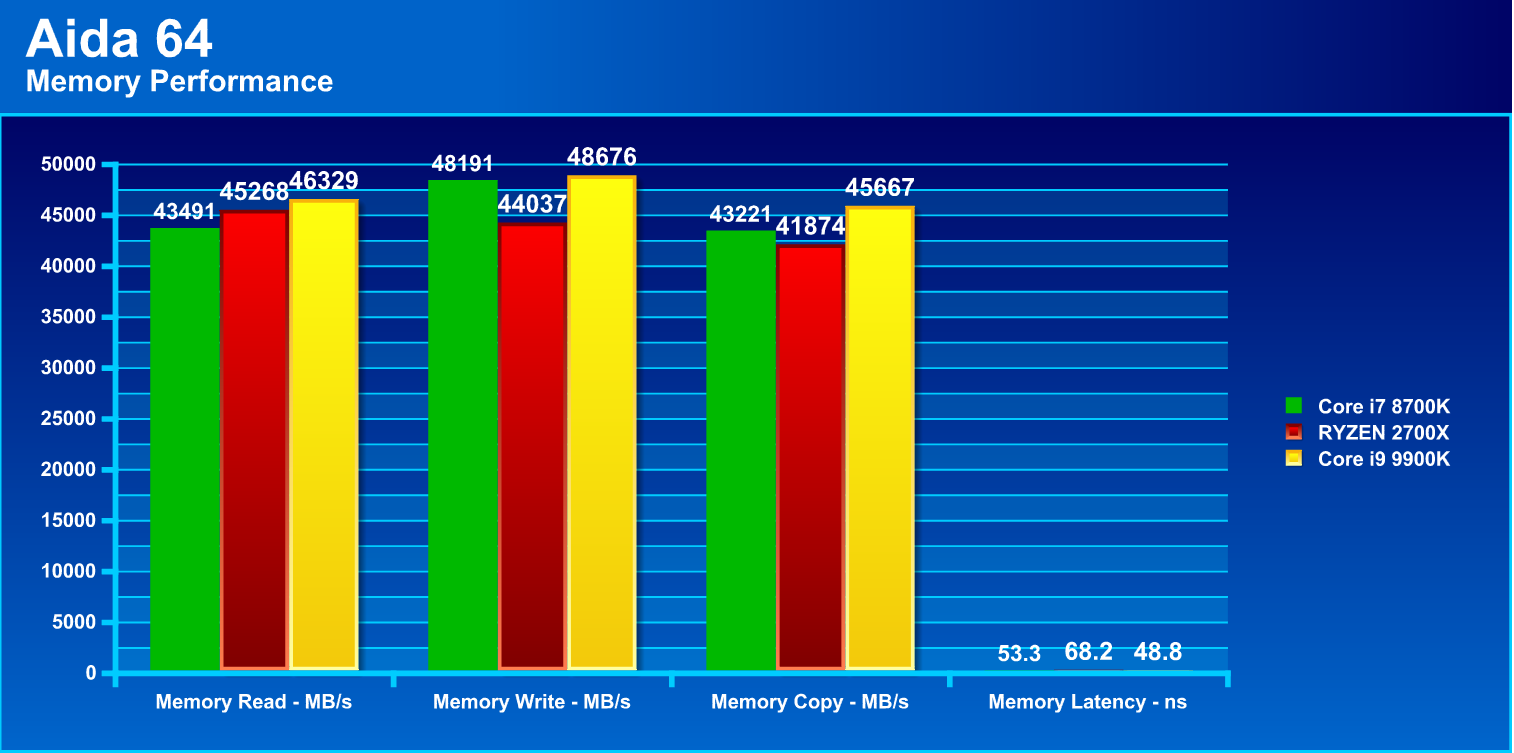
The memory performance measures in Megabytes per second, you can see that while they all look close, the memory read speeds across the board show the 9900K leading in every speed and also the best latency. Now keep in mind this is the exact same memory kit on all tests for every chip.
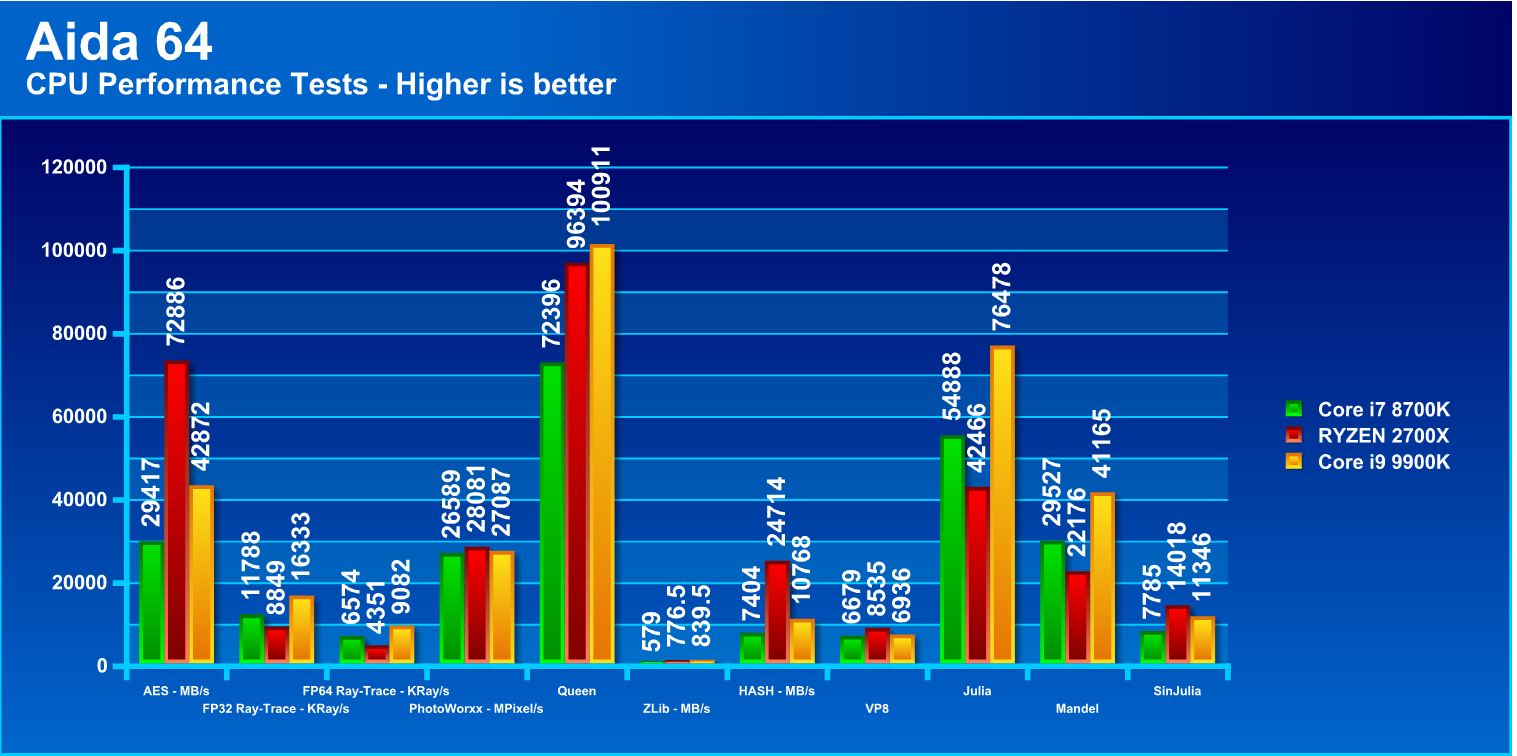
As you can see the 9900K has a huge lead over the competitors but to my surprise, the RYZEN chip definitely destroys at a few of the benchmarks. AES Encryption shows the 2700X pulls a lead of over 40%! The HASH test which is a SHA1 hashing algorithm shows a 2700X pulling an even more insane over 56% gain over the 9900K. then you have VP8 where the 2700X pulls a lead of over 18%.
Then we have where the 9900K leads. 108% over the 2700X on the FP64 ray Tracing test and an 84% lead on the FP32 test. then you have Julia and Mandel pulling over 80% leads over the 2700X with queen and ZLib showing single-digit gains but still wins for the 9900K.
I know this is ALOT of information to take in but what this shows is that when it can be put to use the 9900K can really crunch out some data but to be fair there are areas where the lower clocked 2700X can easily crunch out some very competitive and even dominating results in the right scenarios even though it is definitely frequency deficient in comparison.


So you need yet another mb with a new, re-cooked intel only chipset… MMmmmm NO. Ive for the first gen AMD and I can put in after a new bios the 2nd gen core/16 thread ryzen and then I can put in the 3rd gen die shrink and speed up ryzen. So pass. For what Intel are charging you can buy the ryzen, mb and memory. And did you see the power and thermals needed once you go past 4.0ghz! Well my amd is sweet at 4 and Im happy ~ intel can again go broke as they have learnt nothing!
You do not need a new motherboard. The Z370 or other 300 series chipset will work just fine with it… We would recommend a newer 390 based board for pushing the limits of the 9900K though.
1. why are reviewers running super pi on this multicore chip? 2. why are we still doing single core benchmarks on workstation “like” chips? 3. all the benchmarks software ran on this chip favor and are written for intel. 4. you did not even attempt to put a TR 10 core in the mix. 5. this chip is not a ground up chip. 6. some of the conclusions to the review, i agree with.
The review clearly states the feelings toward the “value proposition” of the 9900K as far as the benchmarks being Intel focused, this is a complete fallacy. These benchmarks are static vendor agnostic ways of interpreting IPC performance differences. There is no 10 core TR chip… and I see no point comparing a HEDT platform to a mainstream platform, that simply doesn’t make sense.
Either way you look at it, the introduction of the 9900K has actually helped more than hurt AMD.