3DMark Fitrestrike

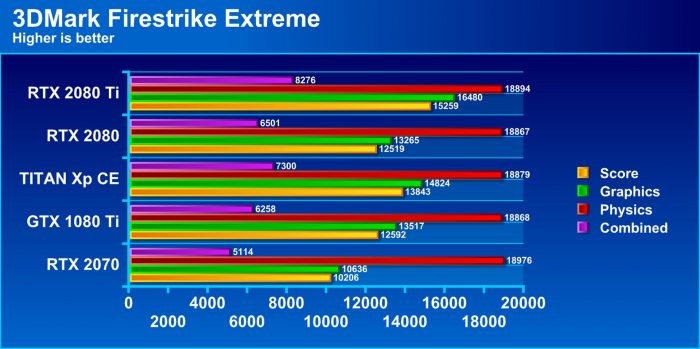
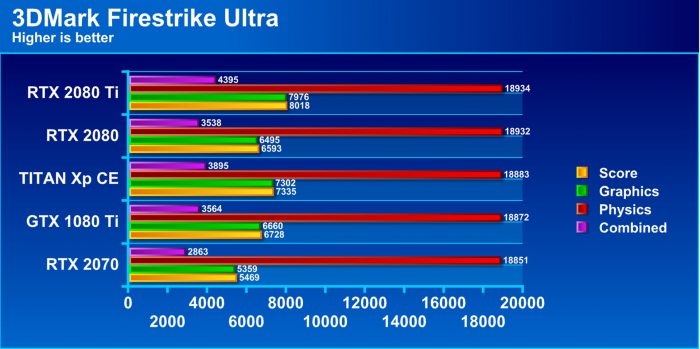
3DMark Firestrike shows that the 2070 slots in right behind the 1080 Ti and should fall a little ahead of an existing 1080 model card.
3DMark Time Spy

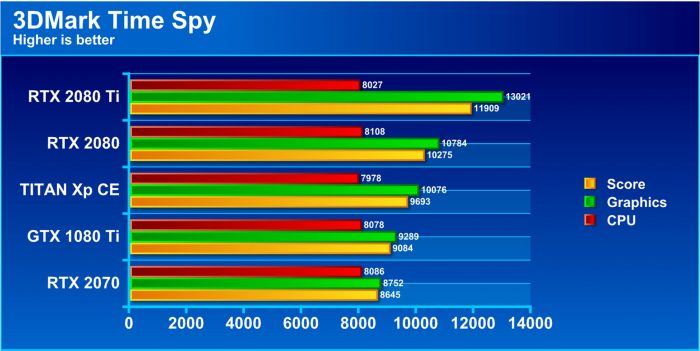
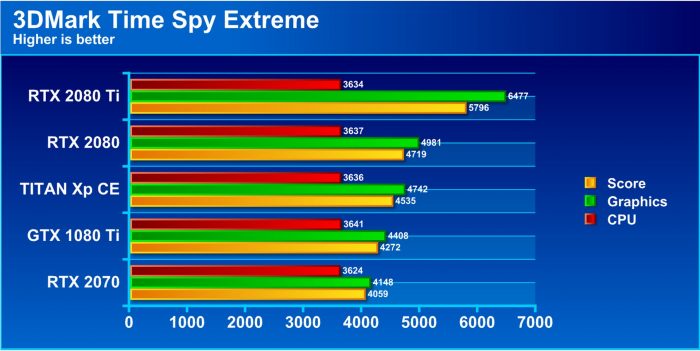
Time Spy is the newest 3DMark entry being a DX12 variant. The 2070 falls just a couple hundred graphics points away from the 1080 Ti (6%) or a similar scale that we also see separating the 1080 Ti and TITAN Xp (7%) for the Extreme 4K variant and the gap stays rather consistent in percentage of scaling with the 2070 gaining a little ground as the 1080 Ti have now an 8% disparity where the 2070 and 1080 Ti have a 6% disparity.
VRMark

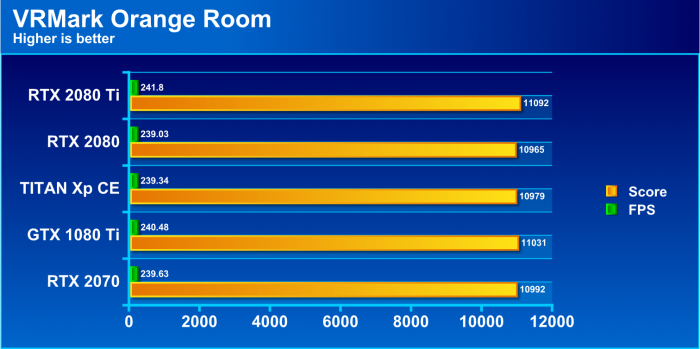
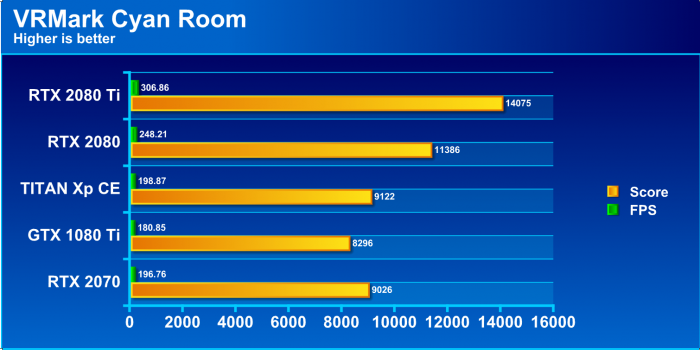
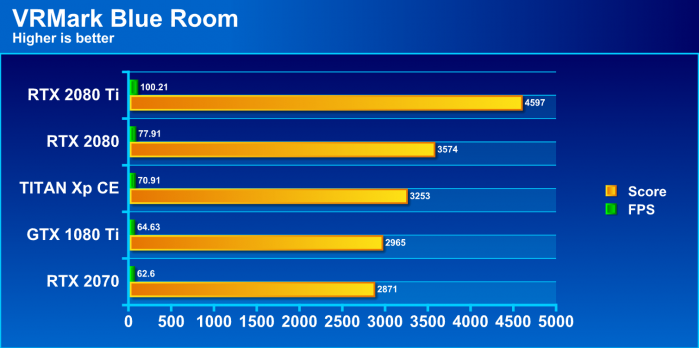
VRMark has 3 levels, Easiest being Orange, then heavy being Cyan and insane mode being Blue.
Orange shows all cards at a dead heat with what I can only assume is a limitation of the benchmark as they all score right at each other throats.
Cyan is where you see the scaling come across and the RTX 2070 actually surpassed the 1080 Ti quite readily.
Blue, as I said, is “insane mode” with the RTX 2080 Ti being the closest I have ever seen a GPU get to reaching the 109FPS goal. The 2070 has a respectable showing right at the hells of the 1080 Ti.
Unigine Heaven 4.0 Pro

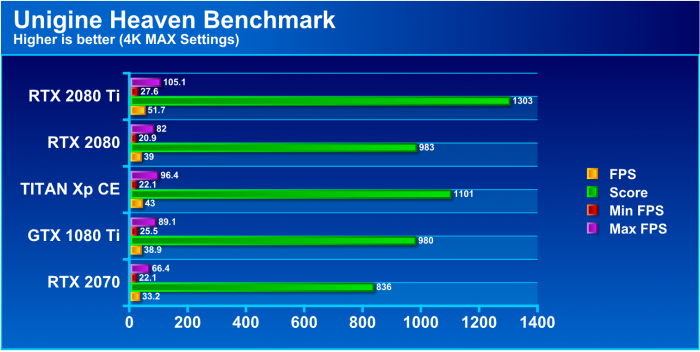
Heaven is a long time test ion our suite. It is from Unigine and pushes tesselation and some heavy GPU loading.
Here with the aging benchmark, you can see heaven puts the GPU to work and works it hard. the RTX 2070 falls well behind the 1080 Ti as expected.
Unigine Superposition Pro
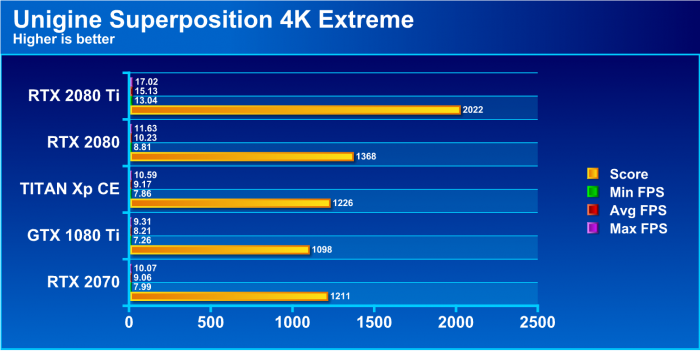
Superposition is the newest benchmark from Unigine and is better aligned with testing the newer cards we are testing today.

Here with Unigine Superposition once again the pascal based 1080 Ti falls behind the 2070 as walks away from it by a steady 113 points and average FPS of .85 which may not seem like much but when average FPS for the top dog 2080 Ti at this setting that’s actually a quite sizable lead.
 Bjorn3D.com Bjorn3d.com – Satisfying Your Daily Tech Cravings Since 1996
