AS SSD
The AS SSD benchmark determines the performance of Solid State Drives (SSD). The tool contains six synthetic and three copy tests. The synthetic tests determine the sequential and random read and write performance of the SSD. These tests are carried out without using the operating system cache. In Seq-test the program measures how long it takes to read a 1 GB file to write respectively. 4K test the read and write performance is determined at random 4K blocks. The 4K-64 corresponds to the test Thrd 4K procedure except that the read and write operations are distributed to 64 threads. This test should SSDs pose with Native Command Queuing (NCQ), differences between the IDE operation mode where NCQ is not supported, and the AHCI mode. The additional compression test can measure the power of the SSD in response to the compressibility of the data. This is especially for the controllers that use to increase the performance and life of the cell compression, important. In the first three synthetic tests and the compression test, the size of the test file 1 GB. Finally, the access time of the SSD is calculated, wherein the access to read over the entire capacity of the SSD (Full Stroke) is determined. The write access test, however, is done with a 1 GB big test file.
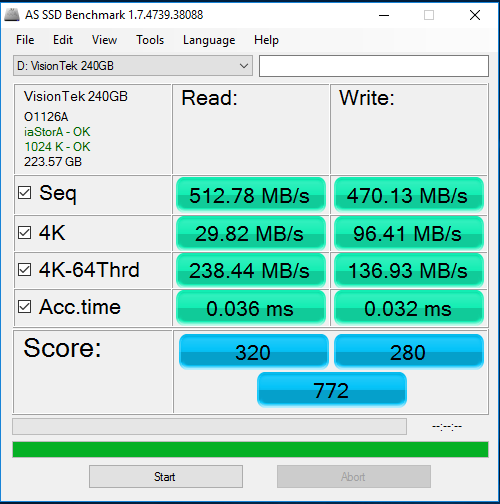
AS SSD is a standard test and we left it on the default setting for this run and got 512.78MB/s Read and 470.13MB/s Write.
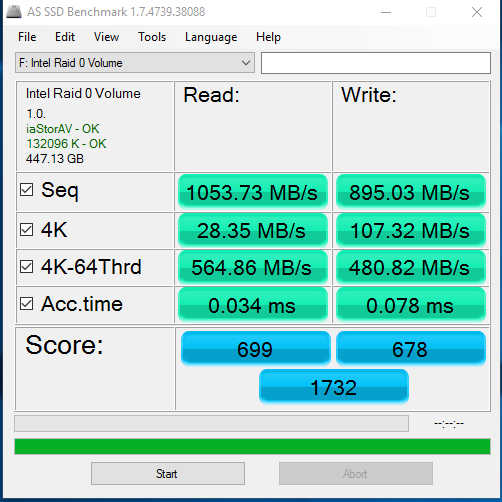
The Read test on AS SSD shows a tremendous increase on the Read Test and the RAID Array got 1055.73MB/s Read and 895.03MB/s Write. We prefer to work with the actual Read and Write speeds as opposed to an arbitrary score, the score might be 699 on read but the actual Write speed means more to us than an assigned score.
The read test at 1055.73MB/s is 542.95MB/s faster than the single drive speed of 512.78MB/s or more than double the single drive speed. The RAID0 Write test hits 895.03MB/s which is an increase of 424.90MB/s over the single drive speed of 470.13MB/s.
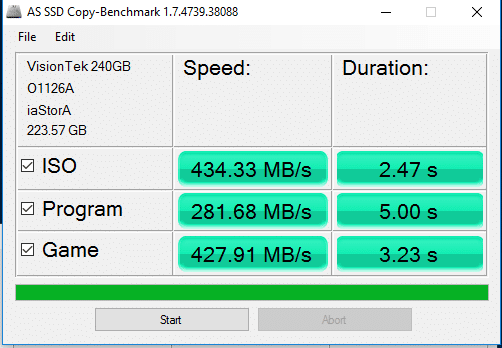
The AS SSD copy test shows a program speed of 281.68MB/s while ISO is at 434.33MB/s and Games show 427.91MB/s and the sub $65 VisionTek 240GB TLC 7mm SATA III SSD is looking more attractive all the time.
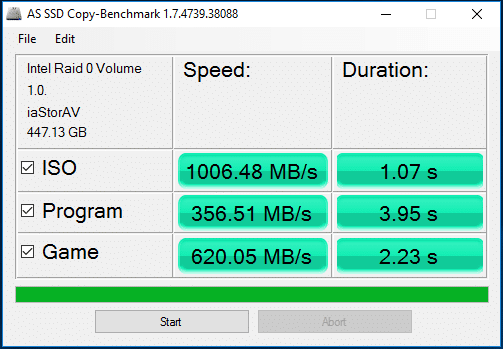
The RAID0 array of VisionTek 240GB TLC 7mm SATA III SSD’s shows a healthy increase in speed on the copy test and the Program test shows 356.51MB/s while the Games test shows 620.05MB/s and the ISO, which is a compressed format, shows 1006.48MB/s.
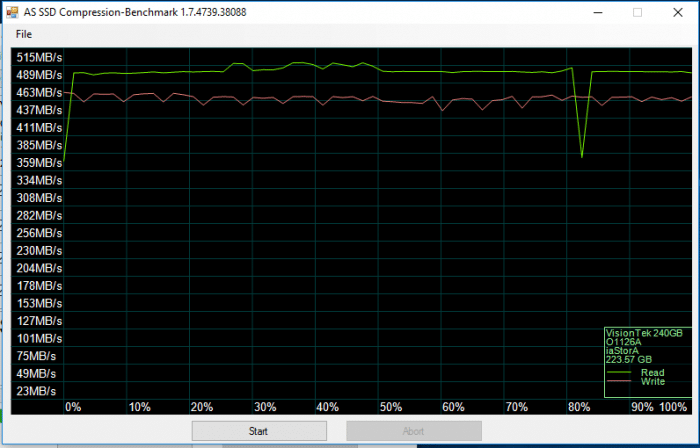
AS SSD’s Compression test is graphically represented and on the Read side of the equation we get about 500MB/s across the board and let’s call it at 436MB/s on the Write Side. Yes, we know those are approximated but trying to average the entire graph would be a daunting task.
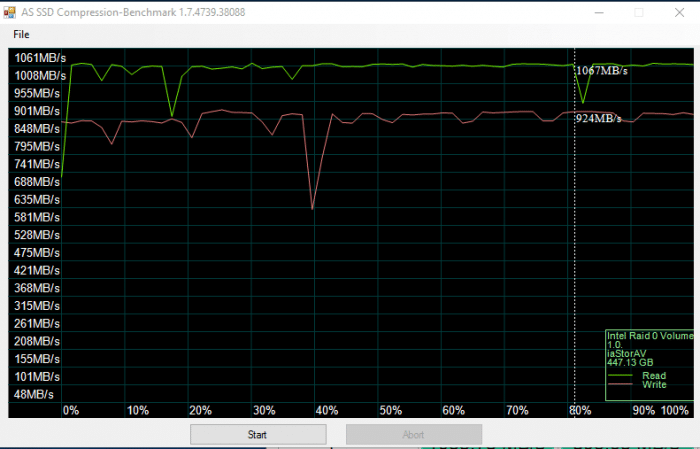
The RAID0 Compression test in AS SSD on Reads the VisionTek 240GB TLC 7mm SATA III SSD’s hits 1061MB/s with a little variance, The Write test the array hits around 900MB/s and for the $130 it would cost to produce these speeds we aren’t complaining.
 Bjorn3D.com Bjorn3d.com – Satisfying Your Daily Tech Cravings Since 1996
