Benchmarks, Anvil Storage Utilities
Anvil’s Storage Utilities is a powerful tool that was designed in order to provide you with a simple means of assessing the read and write performance of your Solid State Drive or Hard Disk Drive.
The benchmark tool helps you monitor and check the response time of your unit as well as view the system information collected using Windows Management Instrumentation (WMI).
Anvil’s Storage Utilities has been designed to be the most comprehensive benchmark tool for Solid State Drives on the market. That does not mean that you can’t use it for conventional platter-based drives as well, but you do get the most out of the program when you test the speed and performance of SSDs with it. The program has gone through a series of beta and release candidate builds already and is currently available as Release Candidate 3. It is usually linked from this forum thread, which currently is not the case for the RC build which you can download here directly. You can’t use previous builds as they are set to expire automatically.
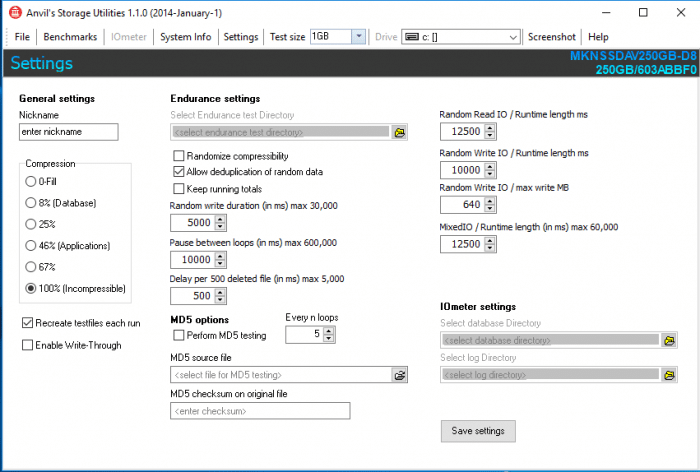
You can run a benchmark right away by selecting a drive from the menu at the top right, or check out the settings first to make sure everything is configured correctly here. Here you can simulate a compression level of the test file, e.g. database, application or uncompressed, and whether you’d like to use the same test file on consecutive runs or generate a new one every time. As far as benchmarks go, you can run a standard SSD benchmark that is testing read, write, or both performances of the drive, or run threaded IO benchmarks only.
Anvil is fully customizable for testing but we left all settings at default and tested with 0 Fill totally compressible, 46% compressible and 100% compressible. We did the same for all the tests, default settings with only the compression settings changed.
0 Fill (Totally Compressible)
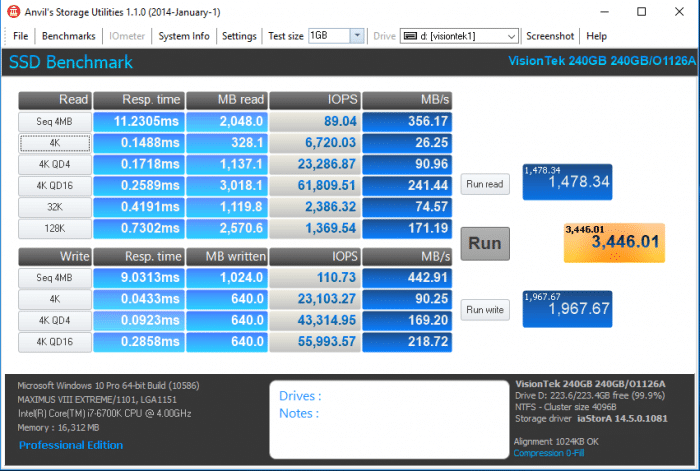
This is our single drive Anvil 100% compressible run and Anvil gave us 356.17MB/s Read and 442.91 Write.
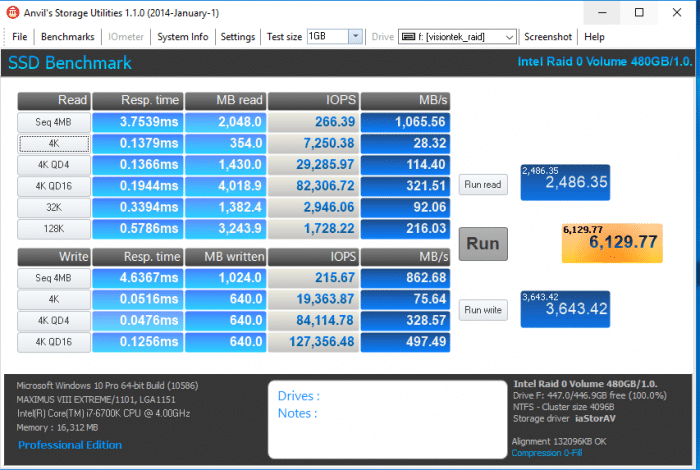
Here on our RAID0 run, we got an amazing 1065.56MB/s an increase of 709.39MB/s over the single drive reading of 356.17MB/s on the Read side. We got 862.68MB/s on the Write run an increase of 419.77MB/s increase over 442.91MB/s.
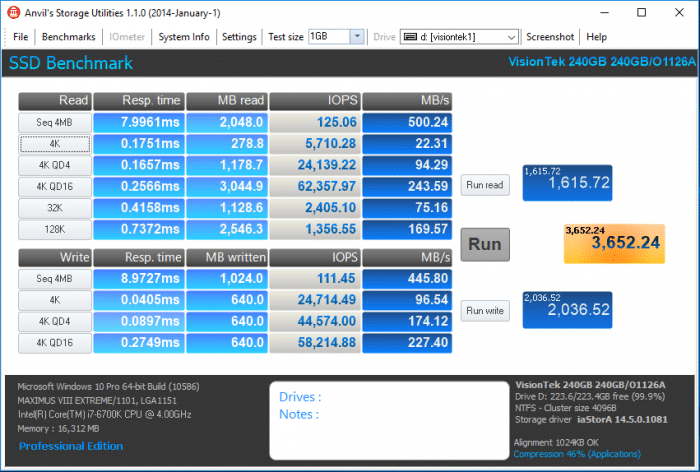
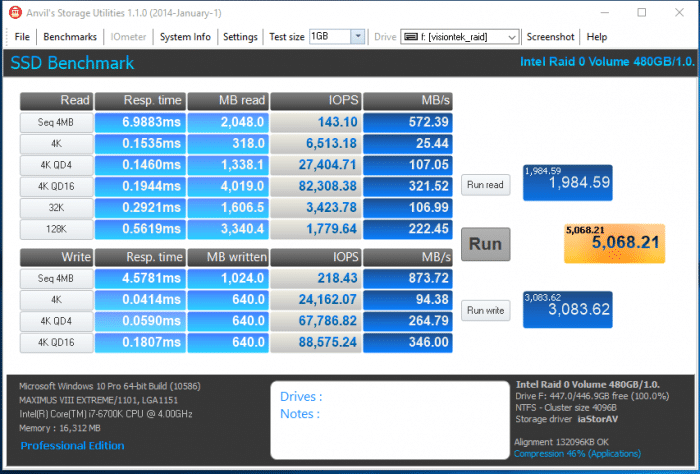
Programs (46% Compressible)
The Programs test in Anvil is 46% Compressible but the SM2256 controller doesn’t use compression to speed writes so keep that in mind. The Sequential 4MB shows 500.24MB/s Read and 445.80MB/s Write which isn’t to be sneered at on a sub $65 Dollar Drive.
We ran the Programs 46% compressible test a couple of times and this test seemed to be the exception or Anvil isn’t handling the test well with an unrecognized controller. The Read test showed 572.39MB/s an increase of 72.1MB/s over the single drive reading of 500.24MB/s. The Write test shows a healthy increase at 873.72MB/s over the 445.80MB/s single drive red test an increase of 427.92MB/s.
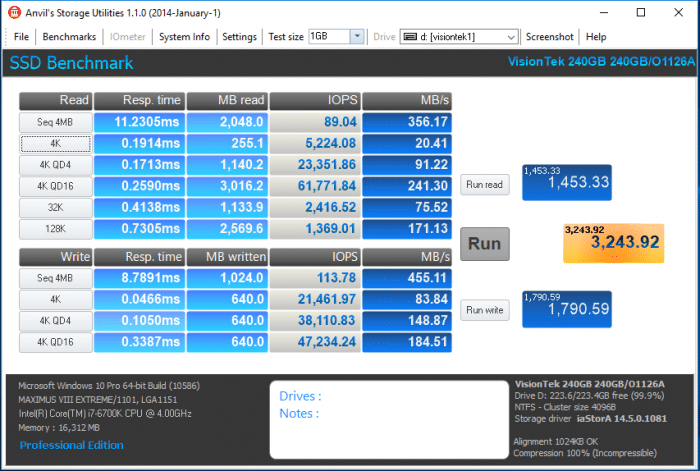
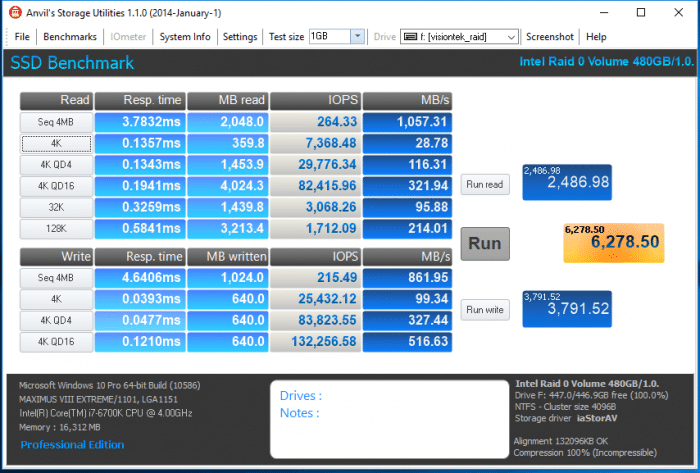
100% Uncompressible
Here’s where the SM2256 should shine at 100% un-compressible and we get a reading of 356.17MB/s which is the same MB/s we got on the 0Fill totally compressible showing the Silicon Motion SM2256 controller doesn’t care if the data is compressible or not and performs just as well with compressed and uncompressible data. Oddly enough the 455.11MB/s read is about 13MB/s faster than the totally compressible 0Fill write test.
Here on the 100% un-compressible RAID0 we got an amazing 1057.31MB/s Read and 861.95MB/s Write. On the Write end the 1057.31MB/s is an increase of 701.14MB/s in RAID0 on two VisionTek 240GB TLC 7mm SATA III SSD’s that cost less than $130 which is entirely doable on most consumers upgrade budgets. The Read test show 861.95MB/s an increase of 406.84MB/s over the single drive speed of 455.11MB/s.
 Bjorn3D.com Bjorn3d.com – Satisfying Your Daily Tech Cravings Since 1996
