Performance.
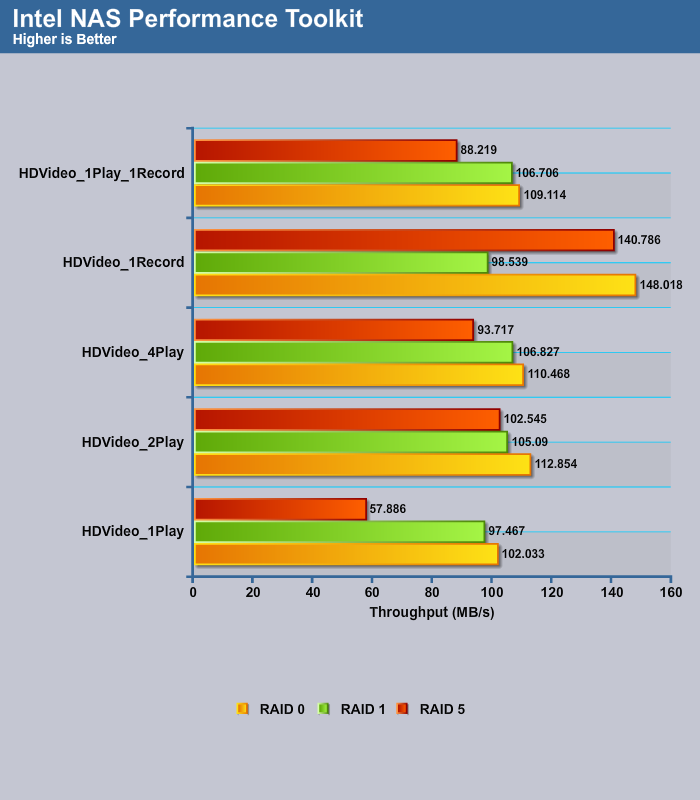
We start by looking at how the NAS scales up with different RAID levels. The performance for the HD playback and recording is quite good across different RAID level. Interestingly, the 1 play performance under RAID 5 shows a much larger difference than other tests.
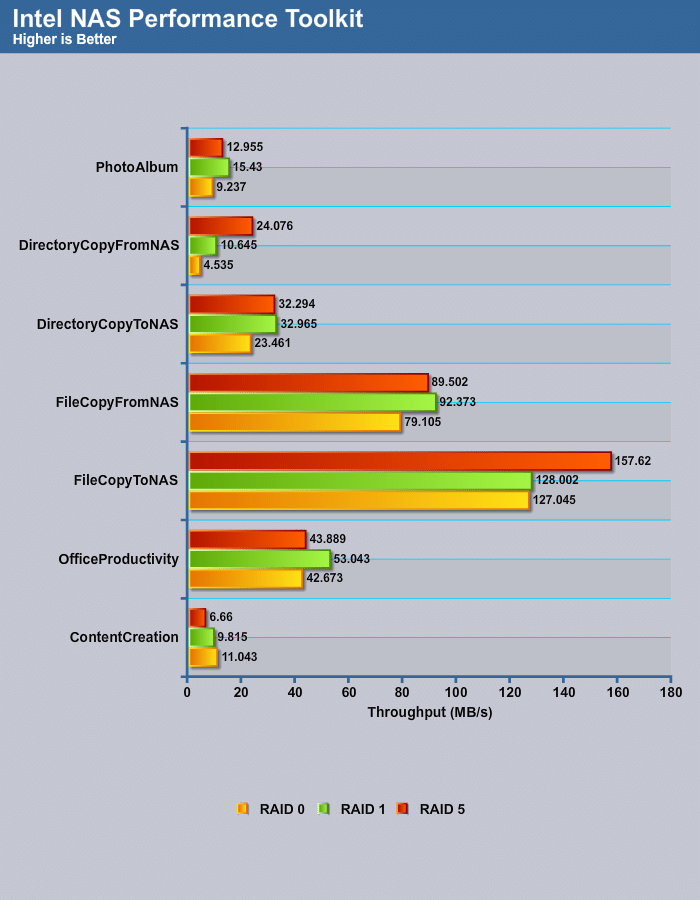
The second set of the test suit includes file and directory copy and productivity tasks. Here we can see that the TS-451+ scales rather well with the RAID 5 excels at the data copying back and from between the PC and the NAS.

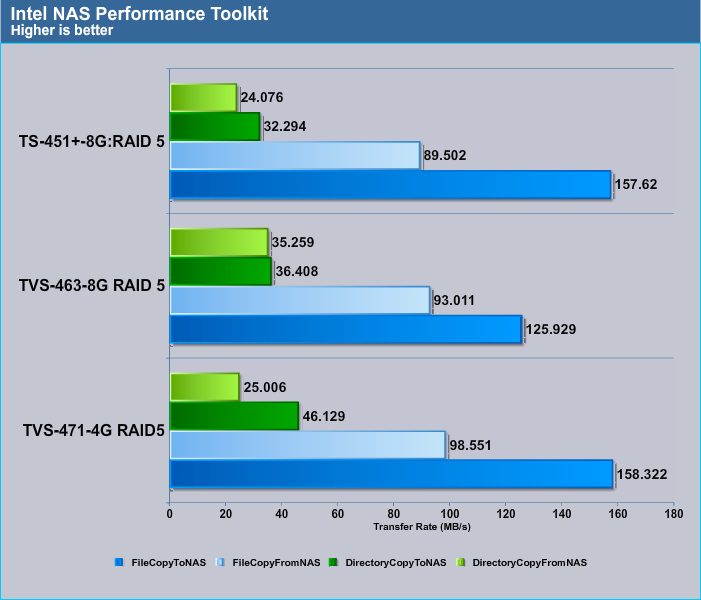
Let’s take a look at how the TS-451+ fares against couple of other QNAP NAS devices. With the exception of the 1 Video playbak, the TS-451+ performs rather close to the SMB NAS devices from QNAP. The drive is definitely slower when comes to reading data off the NAS and the difference is larger under concurrent workloads. Still, even at 4 HD Video playback, it is still able to maintain 93 MB/s throughput. So it should not have any trouble serving as a home multimedia streaming server. Simultaneous reading and writing also has the TS+451+ coming a tad slower than the TVS-463 or the TVS-471 but it is still able to keep up with 88 MB/s of throughput.
When comes to file transfer, the TS-451 does quite well here, matching the other two models. Here we can see that its performance is very similar to the TVS-471 that also uses Intel chipset where both models shows higher throughput for the Directory copy to NAS than the Directory Copy from NAS. The TS-451 delivers about 80 to 90 percent of the throughput when compare to the TVS-471.
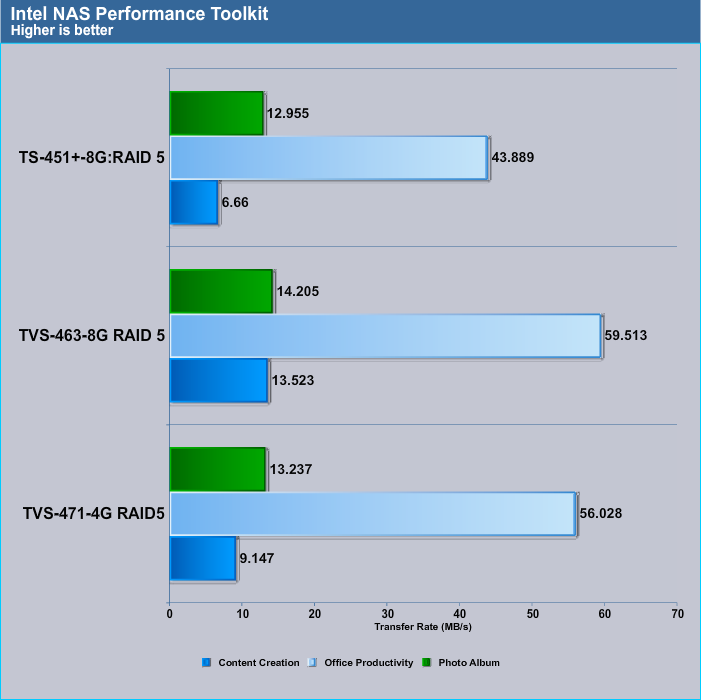
When it comes to Productivity test, it is clear that the TS-451+ is not as fast as the more expensive models. Here the TS-451+ delivers 43.89 MB/s in the Office Productivity test, but the two TVS devices were able to deliver 30% higher throughput. The difference is even larger when we look at the Content Creation, where the TVS delivers 40% higher throughput. Clearly, for home use, the TS+451+ is plenty fast, but if you demand higher throughput, then you would want to choose one of the TVS models.
Processor Performance
It is not easy to compare the CPU performance on the NAS, as there is no software utility that can be used. Luckily QNAP’s QvPC offers a way for us to compare them. With QvPC we can run virtualization and run our typical CPU benchmarks in Windows. Additionally, the Local Display Desk allows us to also benchmark using Chrome. Do keep in mind that neither one would be able to test the CPU to the fullest since the NAS’ own system takes some resources. Still, it gives us a good tool to get some sense of just how much of a performance difference there is.
| Benchmark | TS-451+ | TVS-471 | TVS-463 |
| Cinebench R15 | 57 | 245 | 127 |
| Google Octane 2.0 | 7767 | 30126 | 7979 |
| Suspider Java | 606.9 | 156 | 587.3 |
| Kraken | 3991.1 | 1240.4 | 4138 |
Here is where we can get a sense how how the Intel J1900 SoC fares against the AMD GX424. In the CineBench test the AMD SoC is more than double the performance. When we look at the browser based benchmarks, the difference is not as big, but the AMD still has an edge here. The AMD GX424 is about 5% faster except the Kraken, where it is slower than the Intel SoC.
 Bjorn3D.com Bjorn3d.com – Satisfying Your Daily Tech Cravings Since 1996
