Benchmarks
To start the benchmark section on some charts we left the Asus Rampage Extreme, it is an X99 chipset board with a completely different CPU (5820K at its stock frequency of 3.3) and is there for platform to platform comparison only. Every other motherboard is the new Z170 chipset for Skylake.
PCMark 7
PCMark is a computer benchmark tool developed by Futuremark to test the performance of a PC at the system and component level. In most cases the tests in PCMark are designed to represent typical home user workloads. Running PCMark produces a score with higher numbers indicating better performance. Several versions of PCMark have been released though scores cannot be compared across the different releases since each includes different tests.
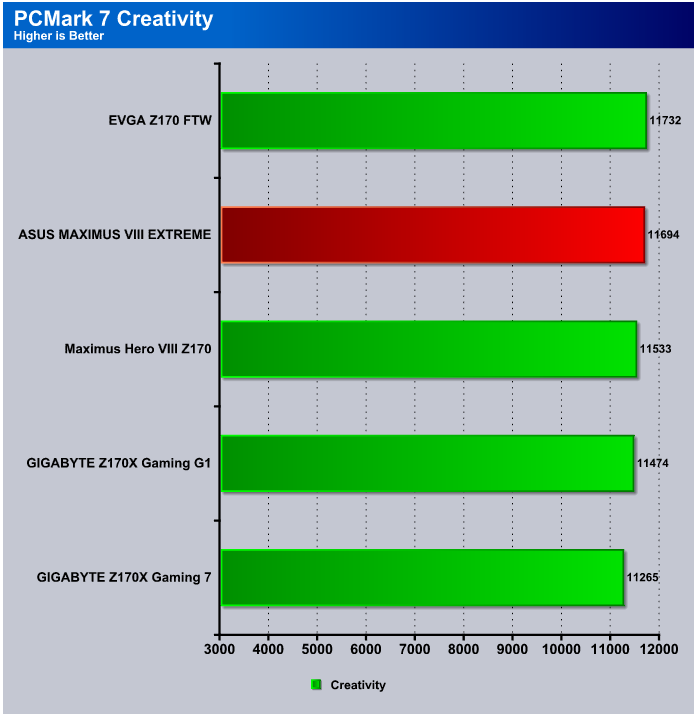
In the PCMark 7 Creativity test the ASUS MAXIMUS VIII EXTREME gave us a score of 11694 just a hair behind the EVGA FTW board and close enough in points we’d call it a tie.
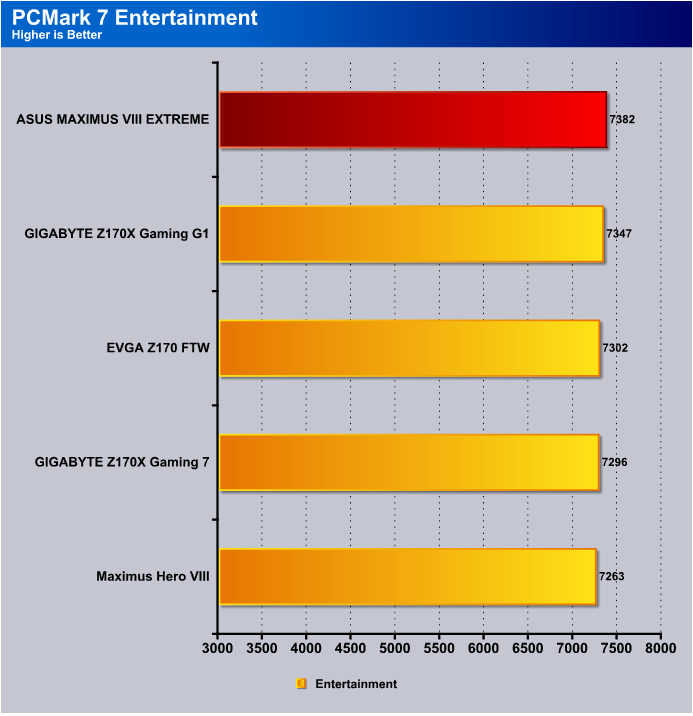
The ASUS MAXIMUS VIII EXTREME turned in a score of 7382 and all the boards scored close to that with the lowest score being 7263so from top to bottom we are seeing about 120 points difference.
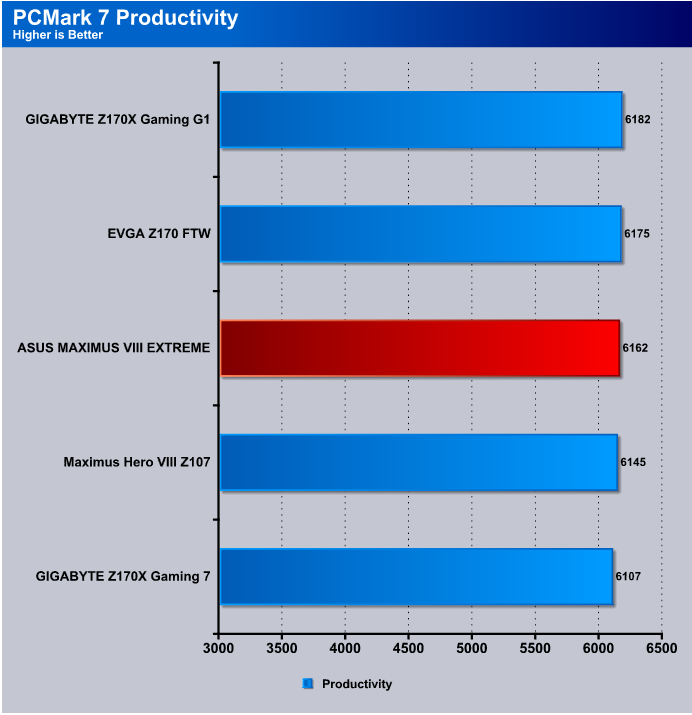
The ASUS MAXIMUS VIII EXTREME fell mid chart on the productivity test scoring a 6162 and 20 points off the top score of 6182. We expect scores to stay close to the same given the same exact equipment we’ve used since day one.
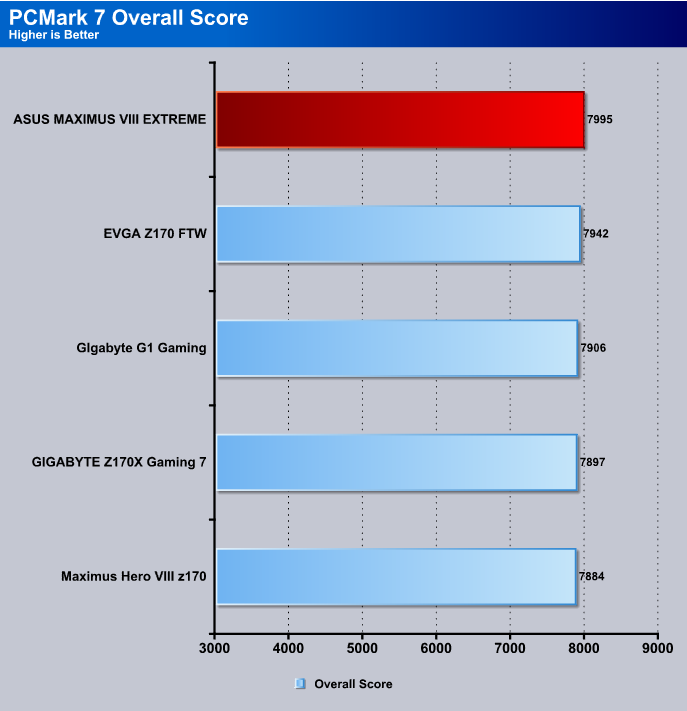
The ASUS MAXIMUS VIII EXTREME got top honors on the overall score hitting 7995 and running just slightly ahead of the other boards.
Super PI Mod 1.9
Super PI is a single-threaded benchmark that calculates Pi to a specific number of digits. It uses the Gauss-Legendre algorithm and is a Windows port of a program used by Yasumasa Kanada in 1995 to compute Pi to 232 digits.
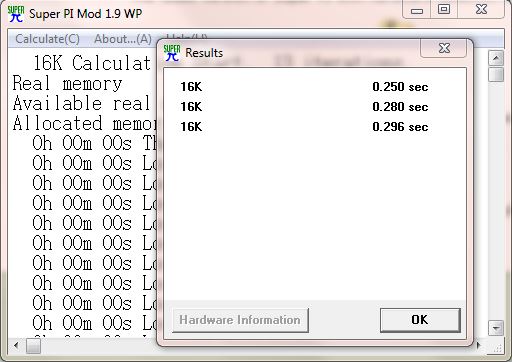
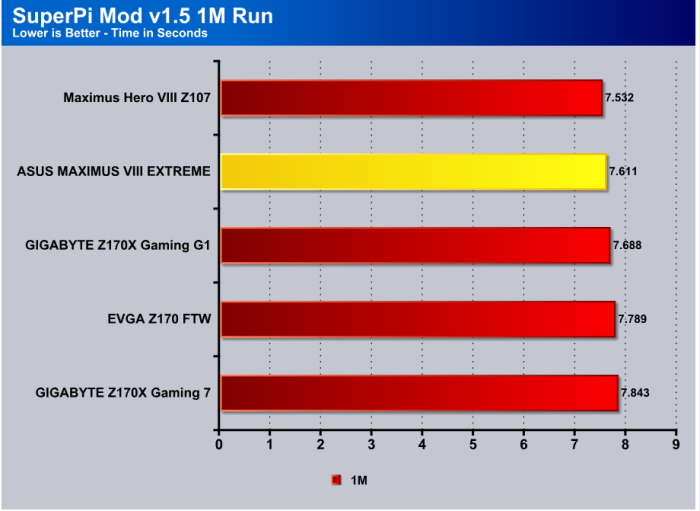
The SuperPi 1M run gave us a 7.611 second score taking second place and ahead of it was the MAXIMUS VIII Hero by a fraction of a second.
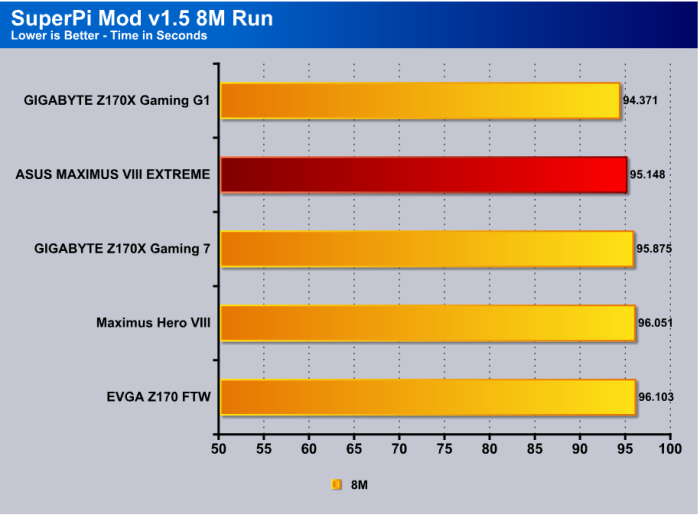
On the 8M test in SuperPi the ASUS MAXIMUS VIII EXTREME gave a 95.148 second performance and stood tall in second place again.
wPrime
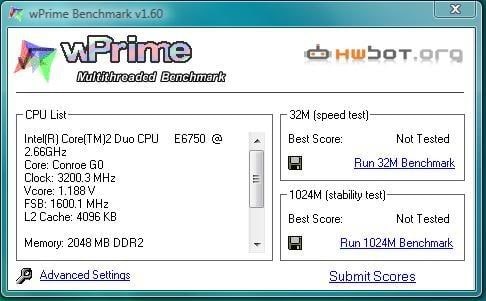
wPrime is a leading multithreaded benchmark for x86 processors that tests your processor performance by calculating square roots with a recursive call of Newton’s method for estimating functions, with f(x)=x2-k, where k is the number we’re sqrting, until Sgn(f(x)/f'(x)) does not equal that of the previous iteration, starting with an estimation of k/2. It then uses an iterative calling of the estimation method a set amount of times to increase the accuracy of the results. It then confirms that n(k)2=k to ensure the calculation was correct. It repeats this for all numbers from 1 to the requested maximum.
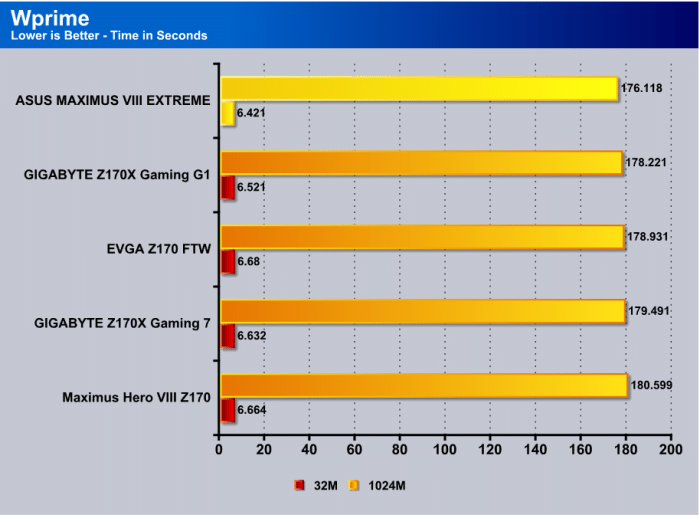
In WPrime we run the 1024M benchmark and the ASUS MAXIMUS VIII EXTREME hit’s the top of the chart but only by the slimmest of margins.
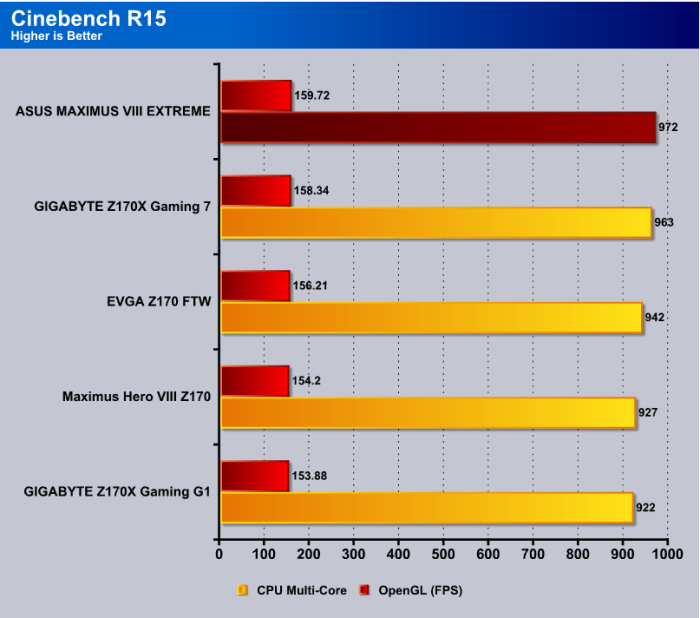
CINEBENCH R15
CINEBENCH is a real-world cross-platform test suite that evaluates your computer’s performance capabilities. CINEBENCH is based on MAXON’s award-winning animation software CINEMA 4D, which is used extensively by studios and production houses worldwide for 3D content creation. MAXON software has been used in blockbuster movies such as Iron Man 3, Oblivion, Life of Pi or Prometheus and many more.

The ASUS MAXIMUS VIII EXTREME came in first on the CPU Multi-Core test by a few bare points and turned in second on the OpenGL test.
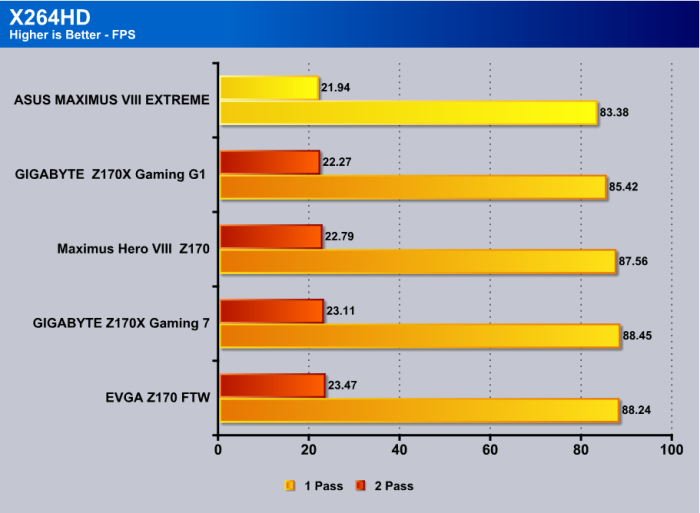
x264 HD
Simply put, x264 HD Benchmark is a reproducible measure of fast your machine can encode a short HD quality video clip into a high quality x264 video file. It’s nice because everyone running it will use the same video clip and software.
X264HD sees the ASUS MAXIMUS VIII EXTREME on top the chart with 1 Pass almost a tie with second place but in 2 Pass came out 2 seconds ahead ofof the GIGABYTE Z170X Gaming G1.
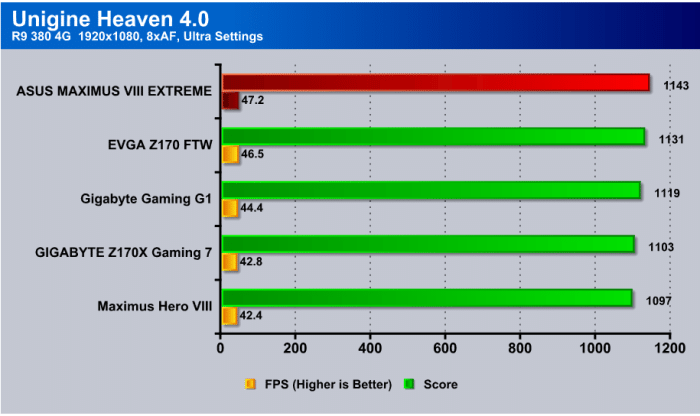
Unigine Heaven 4.0
Heaven Benchmark, with its current version 4.0, is a GPU-intensive benchmark that hammers graphics cards to the limits. This powerful tool can be effectively used to determine the stability of a GPU under extremely stressful conditions, as well as check the cooling system’s potential under maximum heat output. It provides completely unbiased results and generates true in-game rendering workloads across all platforms
Our ASUS MAXIMUS VIII EXTREME came in at 47.2 FPS barely taking first and the overall score was 1143 and again top score but only by a small margin.
Handbrake
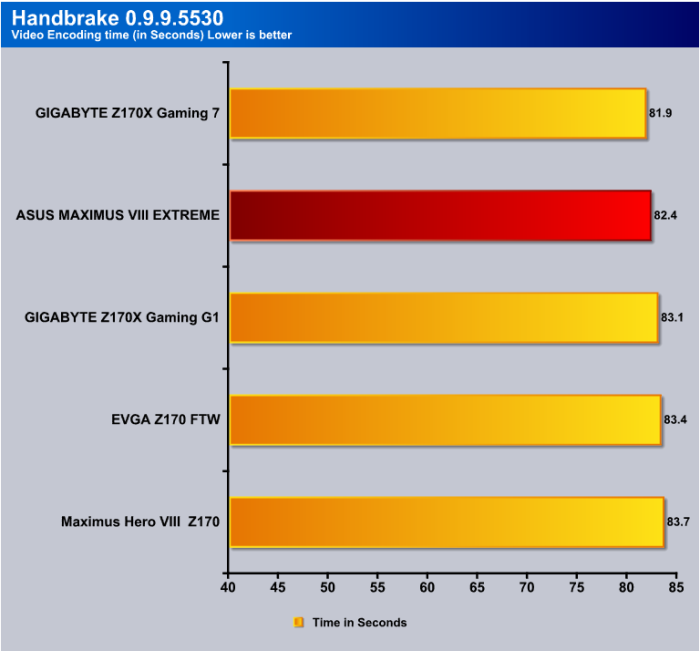
We used a 900K Big Buck Bunny video and trans-coded it from AVI to MP4 three times, we added up those 3 runs and averaged the scores reported here.
Here is a detailed breakdown of HandBrake’s features:
Built-in Device Presets—Get started with HandBrake in seconds by choosing a profile optimized for your device, or choose a universal profile for standard or high quality conversions. Simple, easy, fast. For those that want more choice, tweak many basic and advanced options to improve your encodes.
- Supported Input Sources—Handbrake can process most common multimedia files and any DVD or Blu-ray sources that do not contain any kind of copy protection.

In Handbrake the ASUS MAXIMUS VIII EXTREME turned in a score of 82.4 seconds taking second place.
ROG RealBench
RealBench uses real, open source applications to test your PC as it would perform in RL. Although it can be competitive, it’s not primarily designed to be more hardcore and time-consuming – it’s a benchmark for everyone.
Select the three tests and run the benchmark to get your result. Each test uses different parts of your PC subsystem, so all areas are covered. Share the result here on the forum to compare to others, or, compare to pre/post overclocks and pre/post upgrades to get maximum value from your PC.

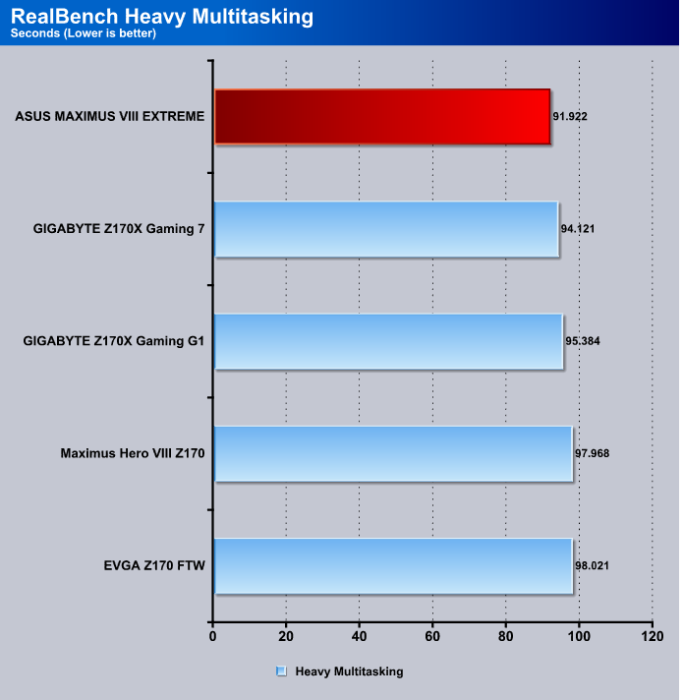
On RealBenches Heavy Multitasking test the ASUS MAXIMUS VIII EXTREME turned in a score of 91.922 a couple of seconds ahead of its closest competitor.
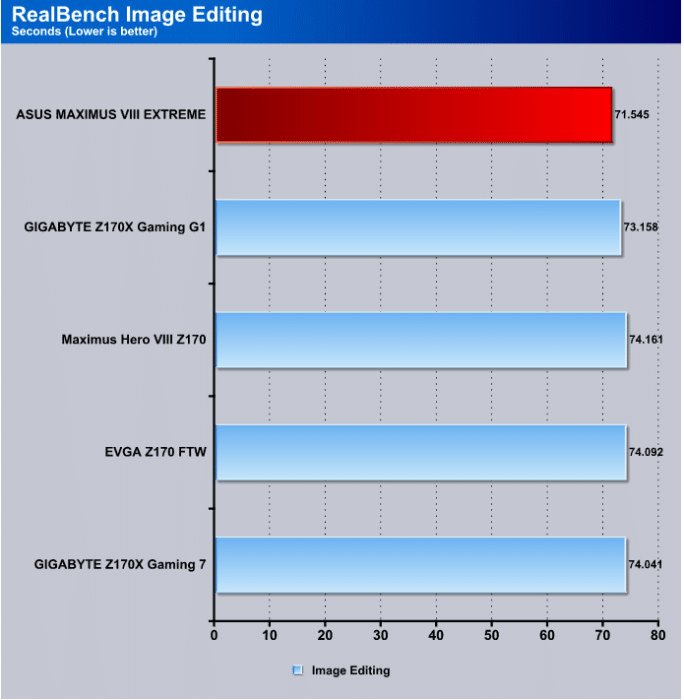
The RealBench Image Editing test shows the ASUS MAXIMUS VIII EXTREME at 71,545 a couple of seconds faster than the board below it.
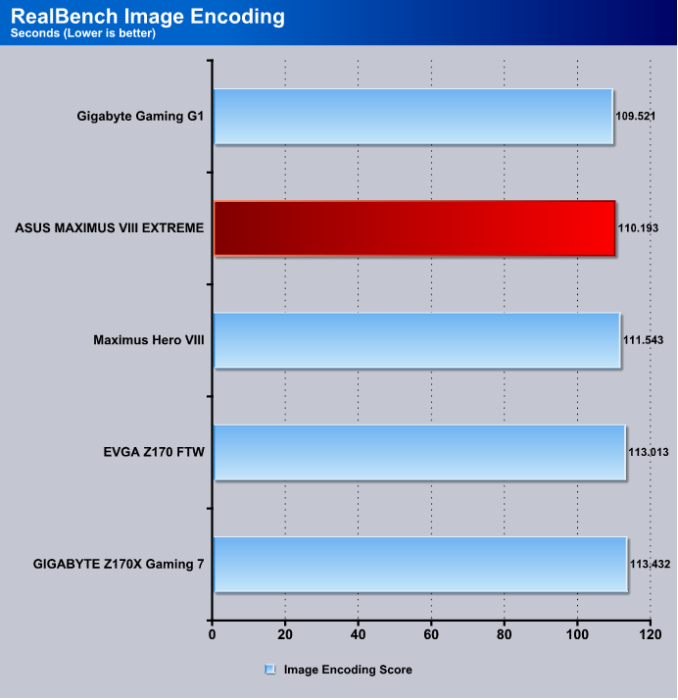
Image Encoding has the ASUS MAXIMUS VIII EXTREME finished the test in 110.193 less than a second ahead of the MAXIMUS Hero.
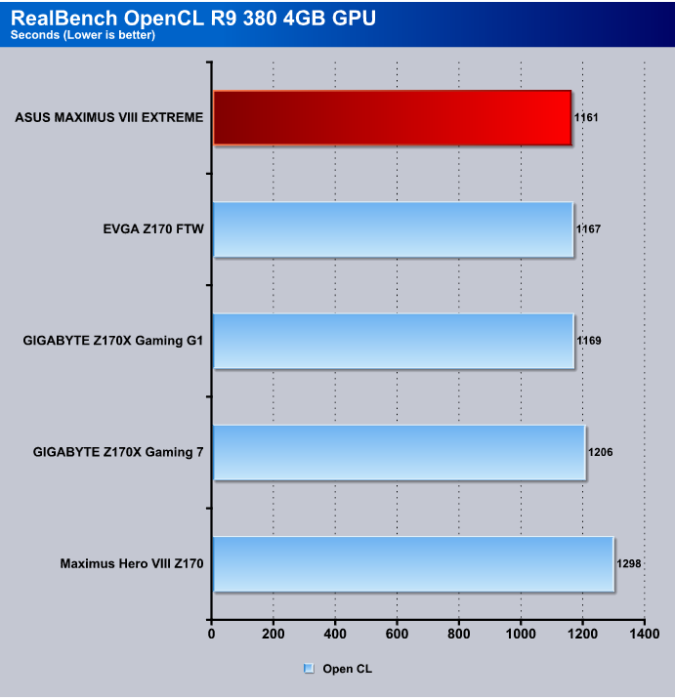
The ASUS MAXIMUS VIII EXTREME scored a 1161 on the OpenCL test using the R9 380 4G which is a squeek by to the top of the chart.
SiSoft Sandra
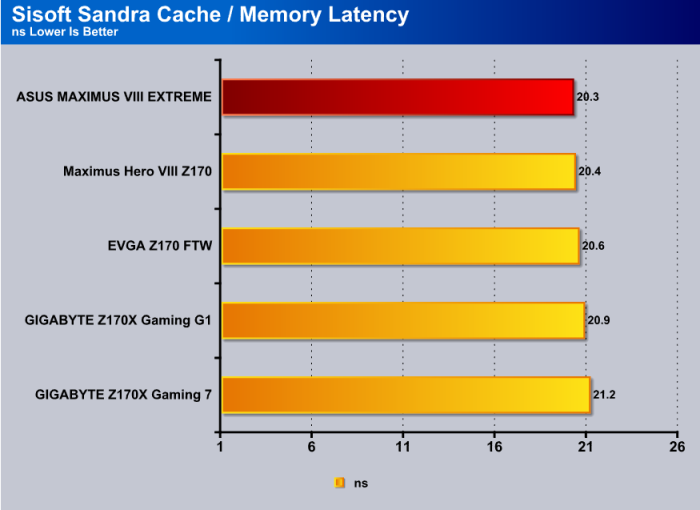
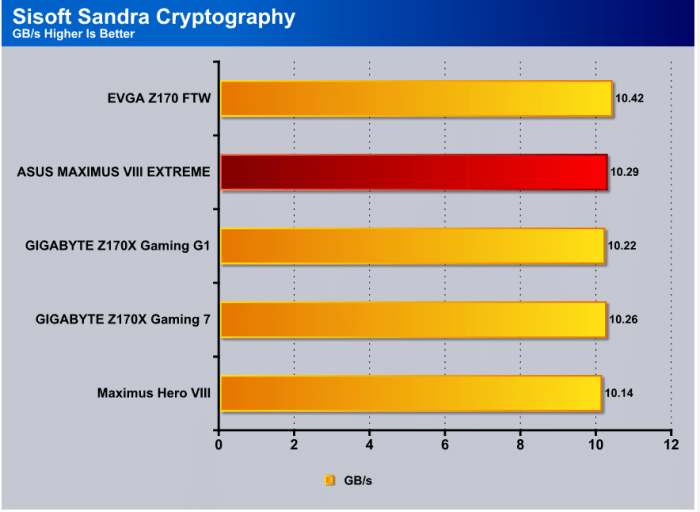
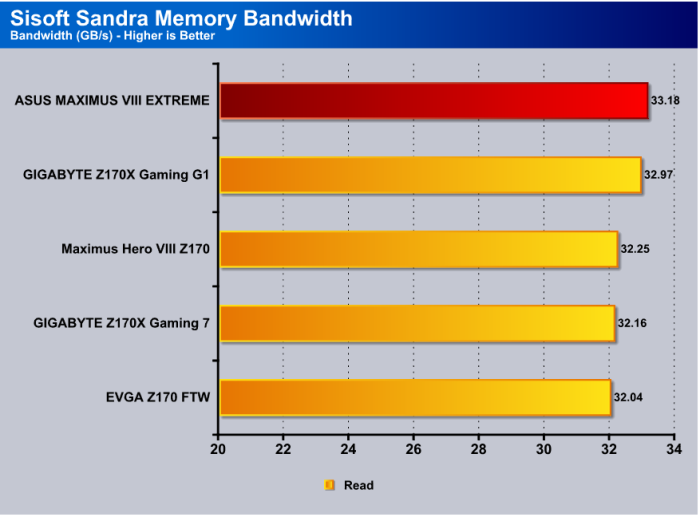
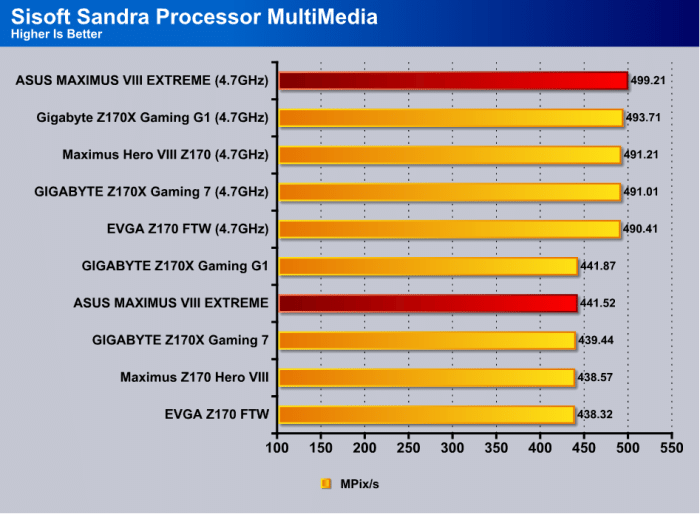
Designed as a complex utility for analyzing your computer’s software and hardware abilities as well as running various tests to stress out components separately, SiSoftware Sandra Lite is one of the most resourceful apps in its category. It includes numerous options that require significant time to get used to if you’re not familiarized with this kind of software. Suffice it to say, it targets power PC users.
When it comes to hardware data, it is possible to get a complete overview on the computer (e.g. processors, memory, graphics), storage adapters and devices (e.g. drive geometry, S.M.A.R.T.), mainboard, chipsets, busses, processors, power management, display and video adapters, GP (General Purpose) processors and accelerators, printers and faxes, and so on. Regarding software, the application shows details pertaining to the logical drives, file types, fonts, media devices, operating system, memory usage, processes, modules, services and drives, and more.
There are multiple types of benchmarks available, such as SIMD processor units, ALU and FPU processors, as well as financial analysis. Any tasks that you frequently perform can be added to a favorites list for quick access, while information from any area can be generated into a report and exported to file for close inspection and safekeeping. Modules that you don’t need can be easily deactivated. In addition, it is possible to monitor the environment of your computer.
 Bjorn3D.com Bjorn3d.com – Satisfying Your Daily Tech Cravings Since 1996


