Testing & Methodology
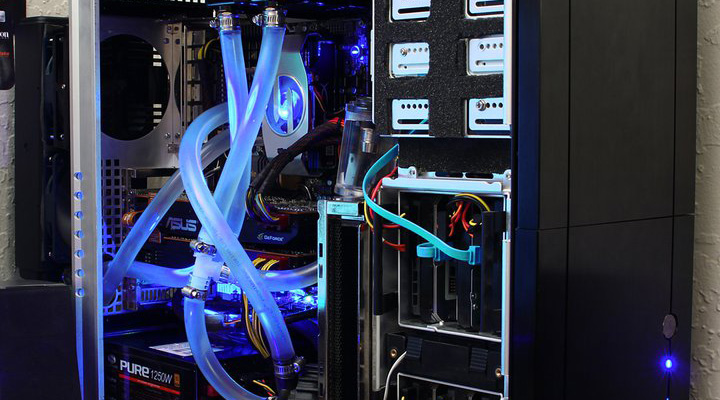
We’ve expanded our testing suite considerably since the X79 chipset release, and will continue to use the same methods for most of the motherboards and CPU’s we test. In the interests of thoroughness and accurate results, we run each test at least three times, and some tests more than that. We average the total of all the tests from each benchmark then report the average here.
The OS we use is Windows 7 Pro 64bit with all patches and updates applied. We also use the latest drivers available for the motherboard and any devices attached to the computer. We do not disable background tasks or tweak the OS or system in any way. We turn off drive indexing and daily defragging. We also turn off Prefetch and Superfetch. This is not an attempt to produce bigger benchmark numbers. Drive indexing and defragging can interfere with testing and produce confusing numbers. If a test were to be run while a drive was being indexed or defragged, and then the same test was later run when these processes were off, the two results would be contradictory and erroneous. As we cannot control when defragging and indexing occur precisely enough to guarantee that they won’t interfere with testing, we opt to disable the features entirely.
Prefetch tries to predict what users will load the next time they boot the machine by caching the relevant files and storing them for later use. We want to learn how the program runs without any of the files being cached, and we disable it so that each test run we do not have to clear pre-fetch to get accurate numbers. Lastly we disable Superfetch. Superfetch loads often-used programs into the memory. It is one of the reasons that Windows occupies so much memory. Vista fills the memory in an attempt to predict what users will load. Having one test run with files cached, and another test run with the files un-cached would result in inaccurate numbers. Again, since we can’t control its timings so precisely, it we turn it off. Because these four features can potentially interfere with benchmarking, and and are out of our control, we disable them. We do not disable anything else.
One thing to note is that we are revamping our testing method in order to better represent motherboard performance and offering to you guys the consumer. Also we want to make it an easier read for you without miles of endless charts. Please feel free to provide feedback on what you think as many benchmarks will be shuffled or removed completely.
Test Rig
| Test Rig | |
| Case | Thermaltake Level 10 GT |
| CPU | Intel Core i7-3770K/Intel Core i7-2600K |
| Motherboard | ASUS Maximus V Formula |
| Ram | (TBA) 16GB Patriot Viper Xtreme 2400MHz + |
| CPU Cooler | Swiftech H20-220 Edge |
| Hard Drive | Western Digital Velociraptor 300GB |
| SSD | Intel 510 series SATA III 120GB |
| Optical | ASUS BD-ROM |
| GPU | Asus GTX680 Top/GTX 580/Intel HD 4000 |
| Case Fans | Front (intake): 200 x 200 x 20 mm ColorShift Fan x 1 (600~800RPM, 13~15dBA)Rear (exhaust): 140 x 140 x 25 mm Turbo Fan (1000PRM, 16 dBA)
Top (exhaust): 200 x 200 x 30 mm ColorShift Fan (600~800RPM, 13~15dBA) Side (intake): 200 x 200 x 30 ColorShift Fan (600~800RPM), 13~15dBA) |
| Additional Cards | N/A |
| PSU | Thermaltake Toughpower Grand 1200W |
| Mouse | Thermaltake esports Black gaming mouse |
| Keyboard | Thermaltake Meka G1 mechanical gaming keyboard |
Test Suite
We will use the following applications to test the performance of the Motherboard and installed components.
| Benchmarks |
|---|
| PCMark 7 |
| Heaven benchmark 3.0 |
| Cinebench R11.5 |
| 3DMark 11 |
| SuperPi |
| Metro 2033 |
| SiSoft Sandra 2011b |
| X264HD |
Overclocking
The Z77 platform is still very new and just like Z68 we had tested before the BCLK increases are quite small. With that being said these chips rely heavily on Multiplier to get the job done. With the new 22nm chips we are facing much higher thermals which is the opposite of what were used to with a process change like this.
The Maximus V Formula easily took our 3770K north of 4.6GHz which is our standard testing speed and even planted us at 5.0GHz on water with very reasonable temps. This all with the memory clocked at 2400 MHz 8-8-8-24 and this is of course with some older Elpida Hyper modules but for testing we went with some more modern Patriot Viper Extreme modules. Let’s face it not many people have these older modules anymore but its still fun to show what the board can do with the right parts.
It is also worth noting that the Maximus V Formula use about .02V less voltage to be stable at 5GHz with a Vcore setting of 1.28V. This is quite a good chip but oinly under cold will we know how far it can go.
Speaking of cold, as you see below, when you engage LN2 mode and get the processor to -150 to -190C, things really start to take off. One of our chips hit 6.6-6.7GHz benchable depending on the bench. This won’t break any records, but it’s not a bad chip by any means either. Mind you it took about 8 minutes on the smaller Maximus V Gene to hit this speed, and we daresay it was easy. The Maximus line in general tend to clock very well but when put under cold is where they really pull away from the pack as the UEFI is optimized to take advantage of cold running and with that has many settings and skews to adjust the board function to best match the cold running as well.
For the Ivy Bridge benchmarks we stuck to a modest 4.6GHz overclock as we found it easily obtainable with acceptable temperatures without too much tuning hassle. This is not an indication of the board’s inability to overclock, but more a representation of what any user could expect with a decent air cooler and a few minutes of tinkering. This can also be attributed to the large amount of heat dump from the chip when overclocking which is why we always recommend maximum cooling capability such as a liquid cooling system to ensure thermals are kept under control.
Important note: Overclocking can cause component failure. Please exercise caution when attempting any level of overclock on system components.
Temperatures
The temperatures were recorded with RealTemp while running wPrime 1024 right before the end of the 5th run. The results were recorded carefully. After the results were recorded, we waited for 30 minutes before taking Idle temperature measurements. The results were as follows:
| CPU Temperatures | Temperature (Idle/Load) |
| ASUS Maximus V Formula OC (4.6GHz) | 31C/67C |
| ASUS Maximus V Formula | 24C/52C |
| Chipset Temperatures | Temperature (Idle/Load) |
| ASUS Maximus V Formula OC (4.6GHz) | 38C/44C |
| ASUS Maximus V Formula | 32C/40C |
The reason temps may look a little lower than seen elsewhere online is that We are using a custom liquid cooling loop compliments of Swiftech which helps us reach an area of much higher headroom for overclocking and performance testing.
Power Consumption
The power consumption was tested while running Wprime 1024 for a few minutes at stock settings. The results were recorded carefully with a Kill-A-Watt power consumption measuring tool at the wall. After the results were recorded, we waited for yet another few minutes minutes before taking Idle power consumption measurements.
| Configuration | Power Consumption (Idle/Load) |
| ASUS Maximus V Formula (4.6GHz) | 186W/407W |
| ASUS Maximus V Formula | 133W/336W |
The power consumption is measured with a GPU installed but is not with GPU load. This is with CPU/system loading but nothing graphically intensive in order to provide the most accurate results by not ramping up the GPU, which will pull significantly more power.
Performance Benchmarks
SiSoft sandra 2011
“SiSoftware Sandra (the System Analyzer, Diagnostic and Reporting Assistant) is an information & diagnostic utility. It should provide most of the information (including undocumented) you need to know about your hardware, software and other devices whether hardware or software. It works along the lines of other Windows utilities, however it tries to go beyond them and show you more of what’s really going on. Giving the user the ability to draw comparisons at both a high and low-level. You can get information about the CPU, chipset, video adapter, ports, printers, sound card, memory, network, Windows internals, AGP, PCI, PCI-X, PCI-E (PCI Express), database, USB, USB2, 1394/Firewire, etc.”
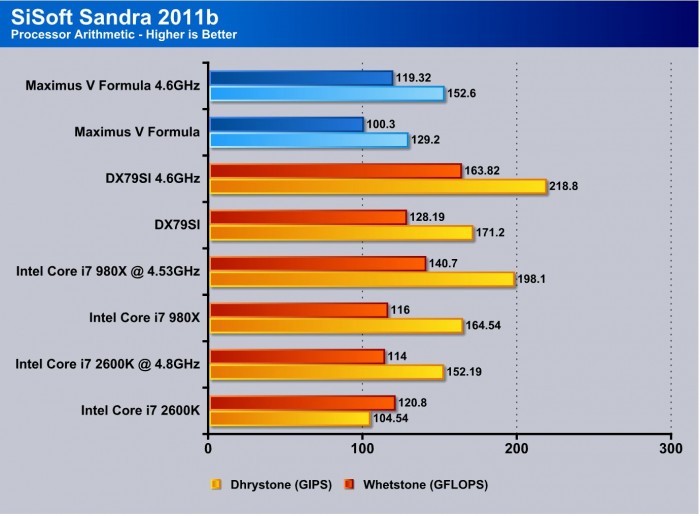
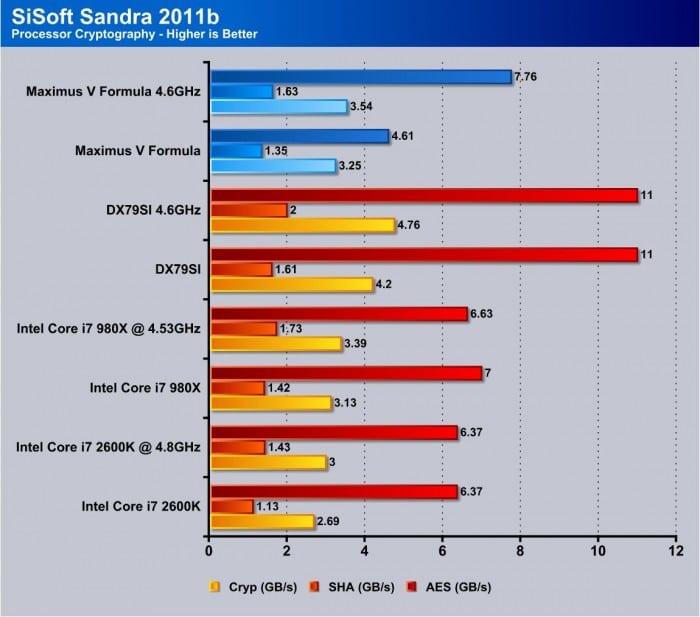
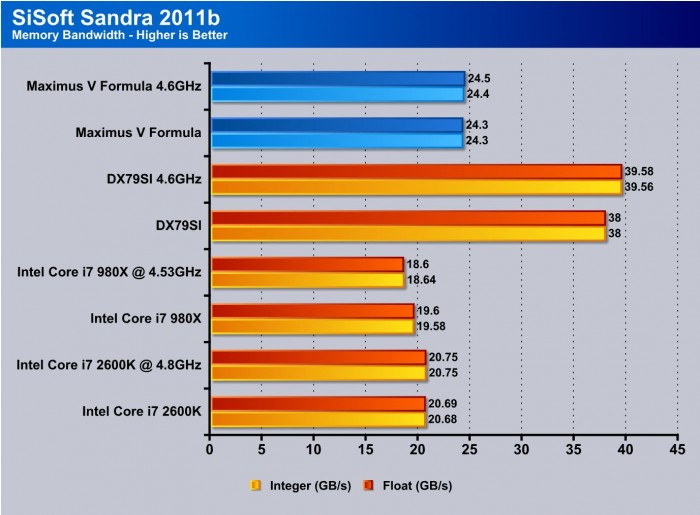
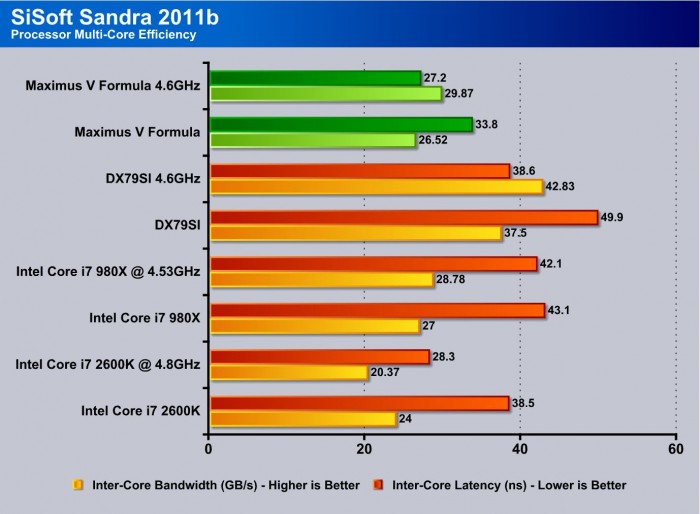
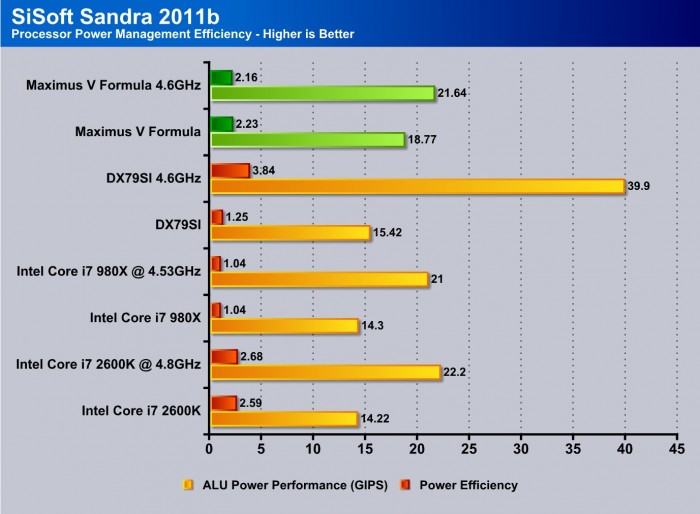
First up we test with SiSoft Sandra which is a pretty comprehensive benchmark. SiSoft Sandra has many tests that can give you a good gauge of relative performance for your system. For this we tested the Maximus V Formula vs pretty much every system we have record for and here are the results above. As you can see the 3770K has a decent but small advantage over the 2600K in most cases as the new architecture we have already found averages between 3-5% increases across the board but remember this is not an end all tell all test as there are many variables in each config which could easily and dramatically affect performance and efficiency.
Superpi
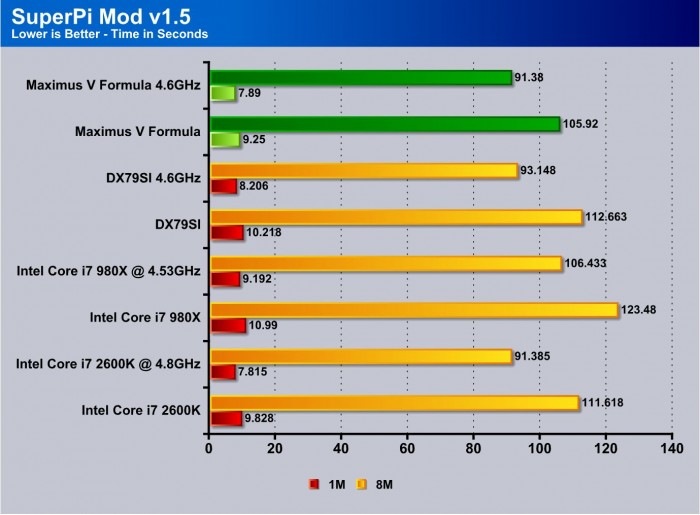
SuperPi is a single threaded benchmark which measures efficiency and is heavily influenced by architectural changes as much as it is by clockspeeds.
Superpi is a great efficiency benchmark and one we always use just because its simple and it shows improvements when they exist. Now bear in mind that the slightly higher clock speed plays a role in the difference. However, in the clock per clock comparison we are seeing similar to approximately 5% difference across our benchmark suite which means once again the 3770K is a small step up or forward so to speak. Here the Maximus V Formula showed a very small gain in efficiency, especially in the longer test which shows the board is quite well tweaked for efficiency.
X264HD
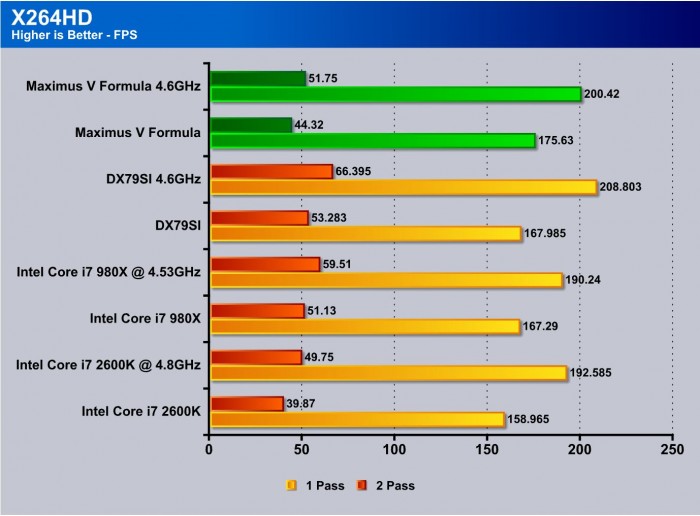
The X264 benchmark is all about encoding and how well your CPU can do it. We all know the story here as the benchmarks are pretty well known at this point. The Formula once again bests the Gene ever so slightly but it goes to show that no matter the board you get, the Maximus line in general is a performance line.
3DMARK 11
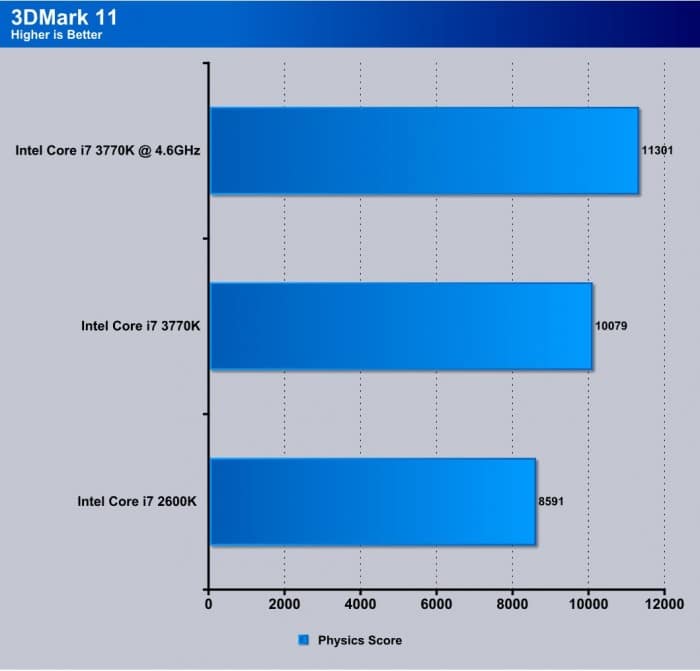
3DMark 11 is the newest in Futuremark’s suite of benchmarking utilities. Its a fully capable DirectX11 benchmark which also stresses and analyzes the system performance as a whole to simulate a heavy rendering environment such as a high end game or other app the end user may run. This benchmark was run with Performance settings 5 times and all runs were averaged for the result below.
3DMark 11 Physics test shows similar that the 3770K pulls a bit ahead of the 2600K and becomes a rocket as it is overclocked, but clock for clock it’s not a world changer.
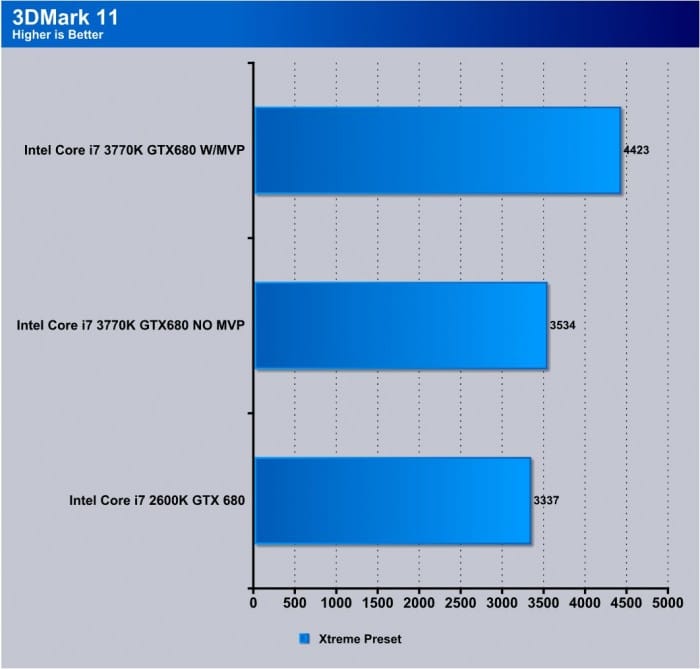
Here we look at how the system scores with an ASUS GTX680 installed in the system. Now remember that the 2600K offers PCI-E 2.0 whereas the 3770K is PCI-E 3.0 enabled, and therefore we do see a small jump in graphics performance when we run the Xtreme preset which pushes the benchmark with 1920 x 1080 resolution and high preset detail levels. We have observed this phenomenon in more than three boards tested, so it is no fluke: the Virtu MVP really does make that big of a difference.
Unigine Heaven 3.0
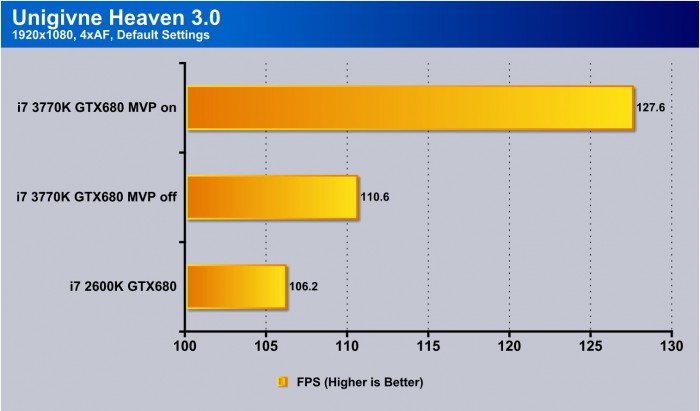
Unigine Heaven is a benchmark program based on Unigine Corp’s latest engine, Unigine. The engine features DirectX 11, Hardware tessellation, DirectCompute, and Shader Model 5.0. All of these new technologies combined with the ability to run each card through the same exact test means this benchmark should be in our arsenal for a long time.
After many times testing this there are minor variances, but for the most part MVP just flat out works and it works well.
Metro 2033
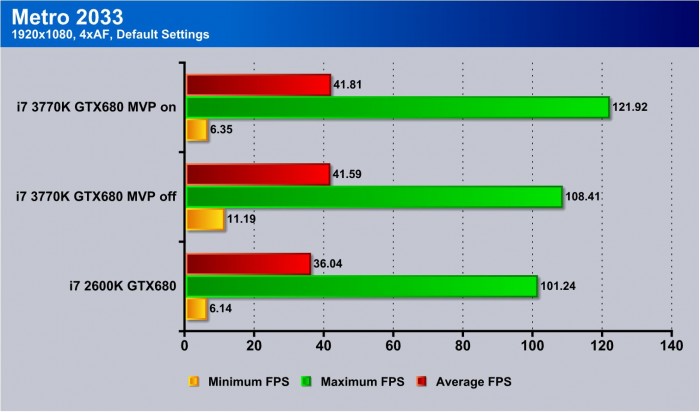
The game tests confirm the synthetics as it also shows gains with Virtu MVP as well, but also does show a dip in themin framerates but with Metro 2033 im not exactly surprised as it is one of the most stressful games we have in my small testing suite.
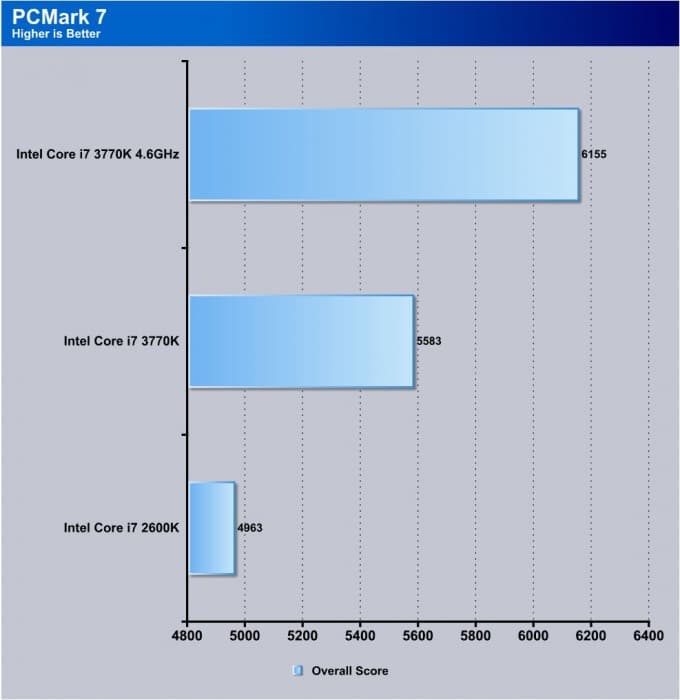
PCMark 7
PCMark 7 is a pretty good synthetic benchmark that mixes many everyday tasks to give a good representation of what kind of relative performance to expect from platform to platform. The Maximus V Formula does just fine here and it just goes to show that this board really can handle almost any workload.
CONCLUSION
The Z77 chipset has many boards to its name, and ASUS had quite a tough job carving out a niche for the Maximus V Formula, especially with the Extreme tight on its heels. We believe they accomplished this quite well, as each board tends to offer its own unique feature set to meet the needs of a specific user group.
The Maximus V Formula offers full 2 way SLI support with even triple slot cards, and with the 3rd slot it can support 3 way CrossFire. This is because CrossFire can run a card at 4X whereas SLI opts not to due to performance concerns when lane allocation is dropped that low. The Formula also offers WiFi onboard right out of the box which is a huge plus as well since many users want a system not tied to a network jack. The SupremeFX IV Audio offers very crisp and clear audio to our ears. The Fusion Thermo cooler allows for the extra cooling for the VRM so that even if used for rendering or constant heavy load, the power components will be nice and happy. There are so many features that we just cannot list them all here, but they are all found further up in the review.
We can’t say many negative things about this board. It is slotted in a segment below the most extreme gaming / benchmarking segment. It’s also above the segment that wants something simpler. The one thing we would have liked to see are adapters/reducers that would allow the Fusion Thermo to fit a standard enthusiasts LCS which is 1/2″ ID. Otherwise, this board is almost everything we want it to be, and the price it is in the right ballpark as well. If you want a board that has all the features, but without some of the extra goodies for the benchmarking crowd, this board is your perfect board.
| OUR VERDICT: Maximus V Formula | ||||||||||||||||||
|
||||||||||||||||||
| Summary: The Maximus V Formula looks awesome, and has the power and performance to back it up. With that it earns the Bjorn3D Golden Bear Award. |
 Bjorn3D.com Bjorn3d.com – Satisfying Your Daily Tech Cravings Since 1996












I wanted to get a Maximus series ROG board but they just coast too much 350+ at the time. I decided to go with a cheaper priced board. I like the marketing spin for the red line.