Benchmarks
PCMark 7

PCMark 7 is a complete PC benchmarking solution for Windows 7 and Windows 8. It includes 7 tests combining more than 25 individual workloads covering storage, computation, image and video manipulation, web browsing and gaming. Specifically designed for the full range of PC hardware from netbooks and tablets to notebooks and desktops, PCMark 7 offers complete Windows PC performance testing for home and business use.
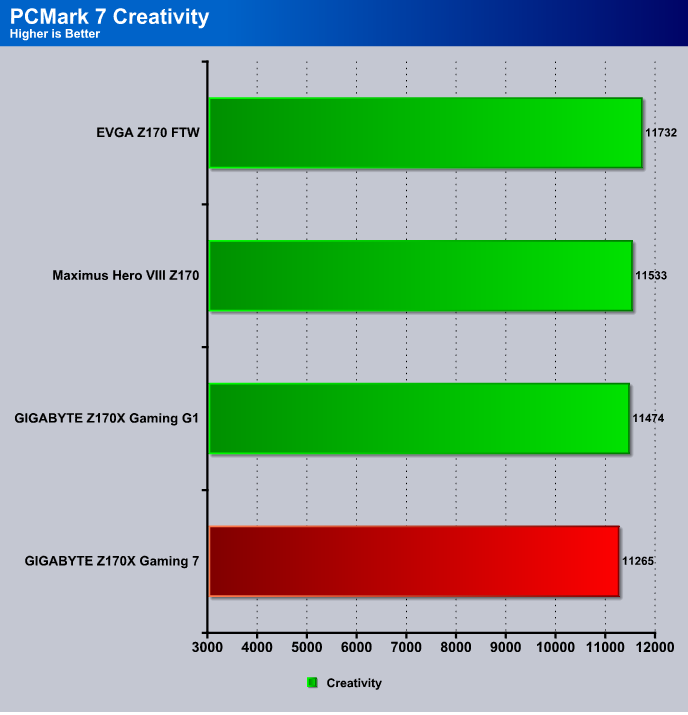
We need to explain something right from the start so we chose this benchmark to go first. The Z170 chipset is built by intel, many boards will offer similar performance and minuscule differences in Benchmark runs exist. The GIGABYTE Z170X Gaming 7 turned in a 11255 which is a respectable score considering that the small differences in the three averaged benchmark runs can account for the differences from top spot to bottom spot on the Creativity test.
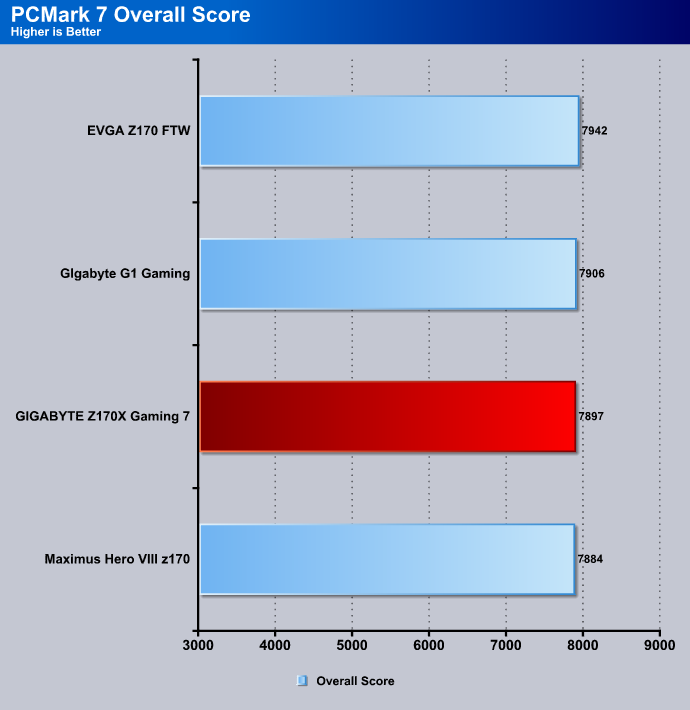
Here’s another good example of small differences in benchmark runs, the GIGABYTE Z170X Gaming 7 turned in a 7897 and around 50 points between the top and the Gaming 7 board. If you take your time tuning the motherboards and don’t rush the review into existence you will achieve similar scores. Most times in the lab we tune the OC and run a quick 1m SuperPi Mod and a WPrime short run, one measures one core performance and memory tuning and the other all the cores and affected by memory performance. The same CPU speed of 4.0 – 4.2GHz is used in all testing, unless we mention otherwise the 2666MHz Ram kit is stroking at 3000MHz. The Carefully controlled hardware and tuning produces similar results and is a product of stringent reproducible benchmark conditions.
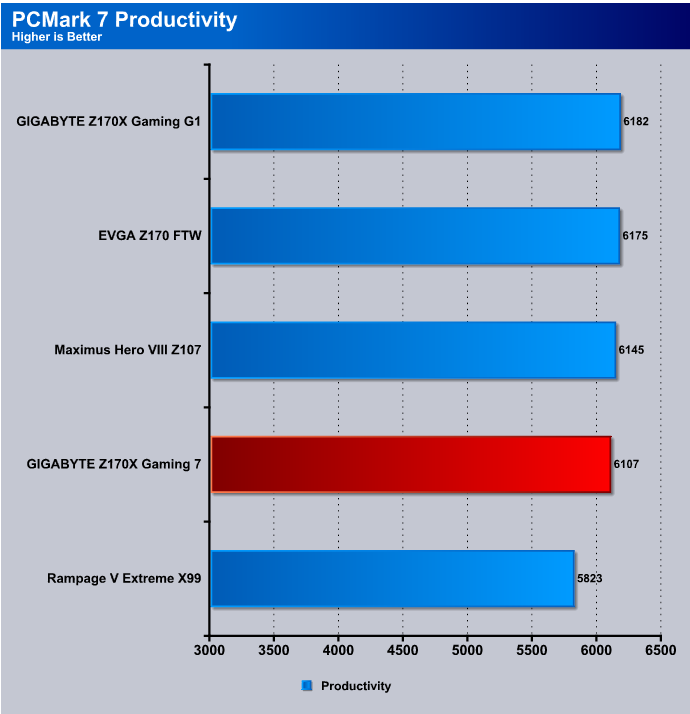
The GIGABYTE Z170X Gaming 7 produced a 6107 and the top score was 6182 so for all intents and purposes within given boundaries the boards are giving the same performance.
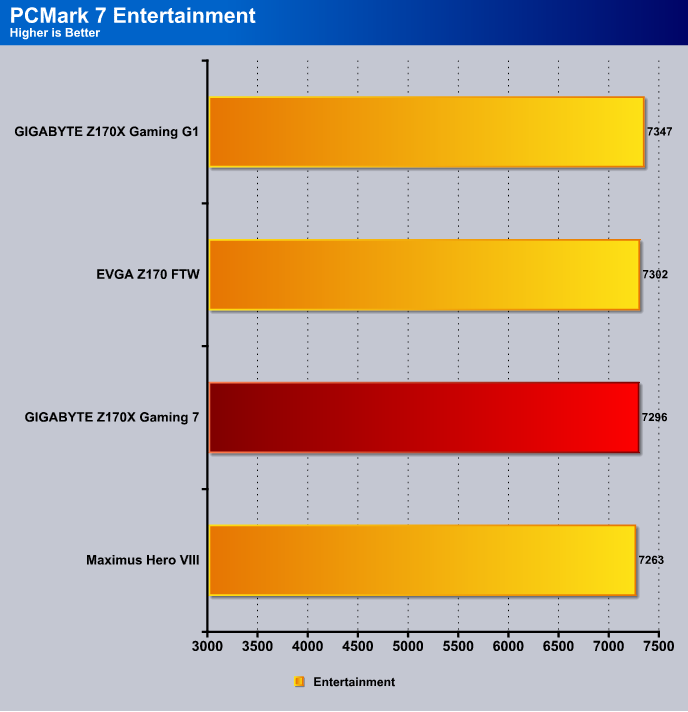
Here the GIGABYTE Z170X Gaming 7 turns in a 7296 in the Entertainment test and there’s less than a hundred points from top to bottom on the chart. At times we long for the Soho Dragon chipset, the VIA bargain chipset and the Nvidia chipset where real differences could be expressed in benchmarks but the consolidation of the chipset to Intel was pretty inevitable and has brought a booming age of excellent overclocking and reliable performance. We find features often differentiate board now.
Super PI Mod 1.5
Super PI is a single-threaded benchmark that calculates Pi to a specific number of digits. It uses the Gauss-Legendre algorithm and is a Windows port of a program used by Yasumasa Kanada in 1995 to compute Pi to 232 digits.
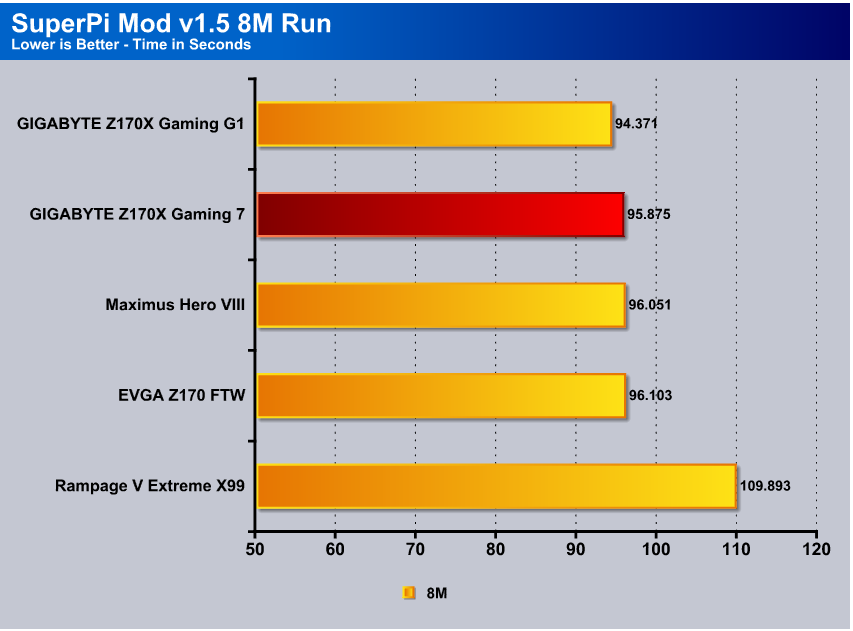
The SuperPi Mod 1.5 8M shows the GIGABYTE Z170X Gaming 7 about 1.5 seconds behind the Flagship GIgabyte Z170X Gaming G1 flagship board.
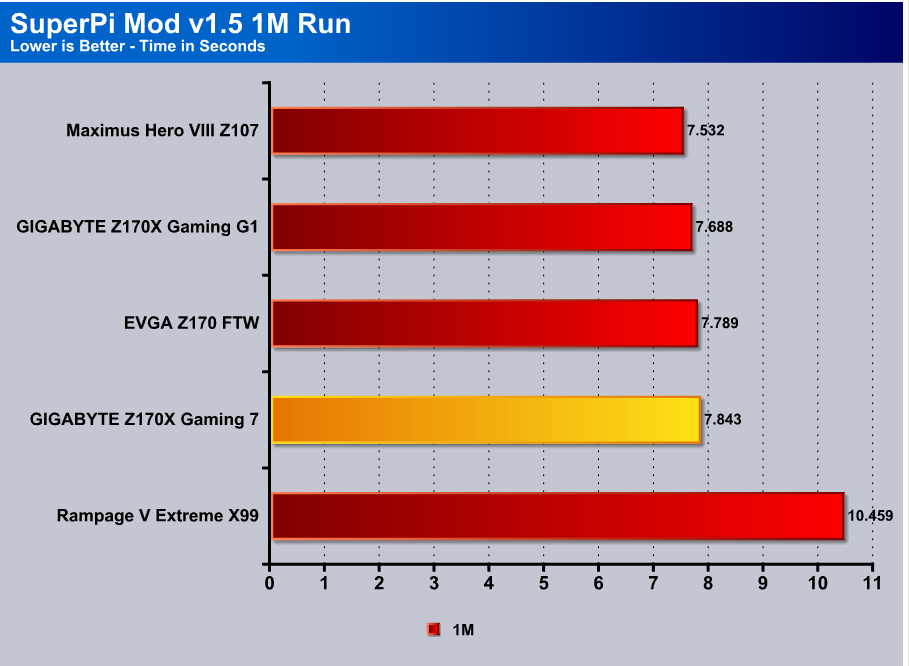
Dropping to the quick and dirty SuperPi 1M run we got a 7.843 Second run with about .3 seconds difference between the chart topper and the GIGABYTE Z170X Gaming 7.
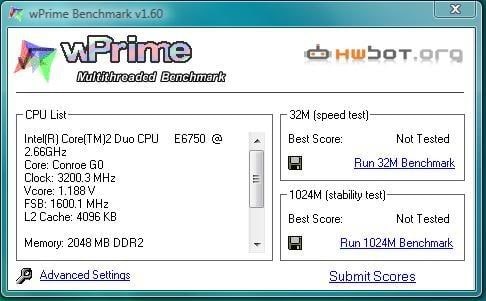
wPrime
wPrime is a leading multithreaded benchmark for x86 processors that tests your processor performance by calculating square roots with a recursive call of Newton’s method for estimating functions, with f(x)=x2-k, where k is the number we’re sqrting, until Sgn(f(x)/f'(x)) does not equal that of the previous iteration, starting with an estimation of k/2. It then uses an iterative calling of the estimation method a set amount of times to increase the accuracy of the results. It then confirms that n(k)2=k to ensure the calculation was correct. It repeats this for all numbers from 1 to the requested maximum.
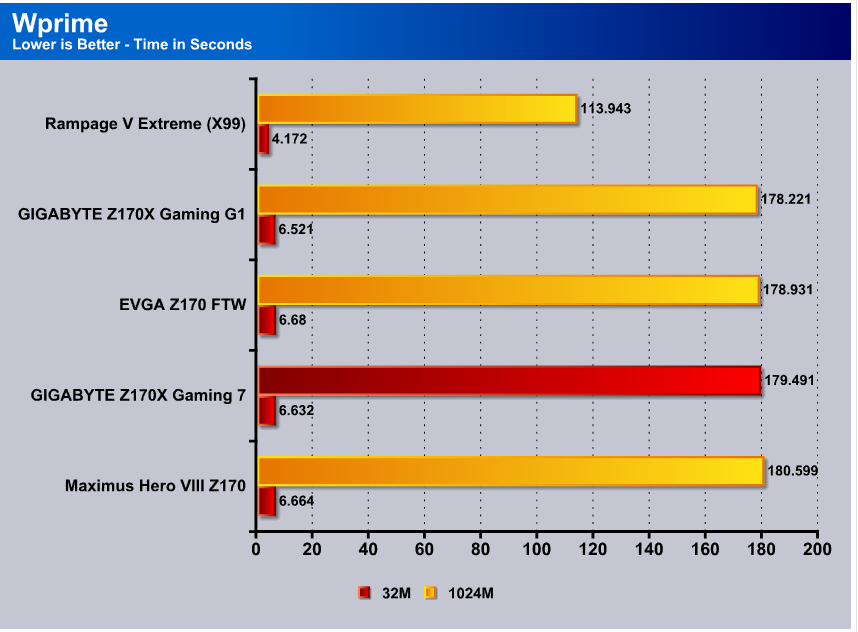
While SuperPi is a single core testing run that figures PI to X places WPrime is a fully threaded application that you can set from 1 thread to all threads. We run it with ever core pumping every thread we can get to see how the motherboard operates the CPU when every thread is required to cooperate in calculations. We are running about 1.2 Seconds behind the chart leader on the 1024M test and a fraction of a second behind in the 32M test.
CINEBENCH R15
CINEBENCH is a real-world cross-platform test suite that evaluates your computer’s performance capabilities. CINEBENCH is based on MAXON’s award-winning animation software CINEMA 4D, which is used extensively by studios and production houses worldwide for 3D content creation. MAXON software has been used in blockbuster movies such as Iron Man 3, Oblivion, Life of Pi or Prometheus and many more.

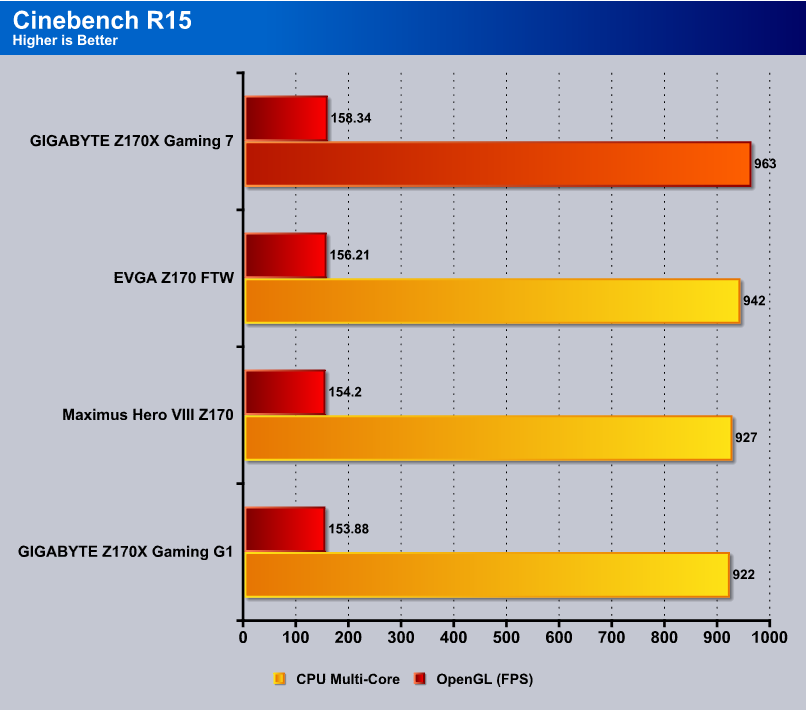
CineBench is an animation software and as suck renders animations testing you computers Multi-Core capabilities and throws in OpenCL testing as well. CineBench liked the GIGABYTE Z170X Gaming 7 well enough to put it on top the chart but here again we are talking minor league differences. The trap a lot of reviewers run into is changing system parts and expecting the same results and something as small as changing from one model r9 390 to another or changing hard drives and it will affect the benchmark numbers. This test bed is always exactly the same components with the exception of the component we are testing producing the most reliable numbers without hardware change skew.
x264 HD
Simply put, x264 HD Benchmark is a reproducible measure of fast your machine can encode a short HD quality video clip into a high quality x264 video file. It’s nice because everyone running it will use the same video clip and software.

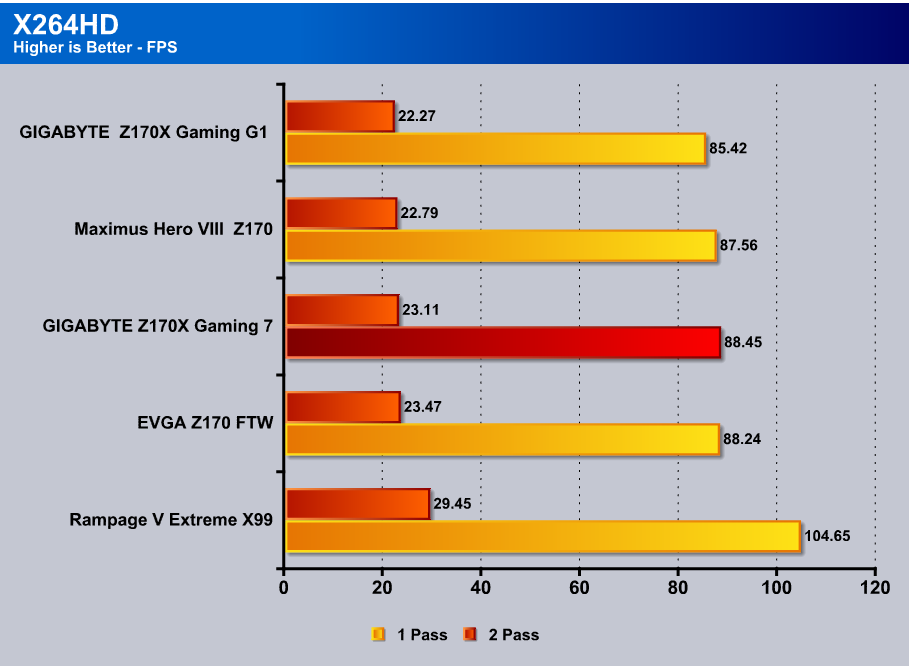
X264HD shows the GIGABYTE Z170X Gaming 7 almost tied for the lead on 2 pass with .16FPS difference and on one pass 3FPS separate it form the top spot. We can’t express enough that these minuscule differences in score just show us how good the boards actually are and all the boards perform excellently. Often it’s a matter of small benchmark differences or a more or less mature BIOS. Features and Price / Performance ratios differentiate motherboards, and in some cases OCing ability. The Uber high-end boards with 75 phase power will produce a higher more stable OC for LN2 users but it’s usually the high-end features and amenities that blow us away.
Unigine Heaven 4.0
Heaven Benchmark, with its current version 4.0, is a GPU-intensive benchmark that hammers graphics cards to the limits. This powerful tool can be effectively used to determine the stability of a GPU under extremely stressful conditions, as well as check the cooling system’s potential under maximum heat output. It provides completely unbiased results and generates true in-game rendering workloads across all platforms

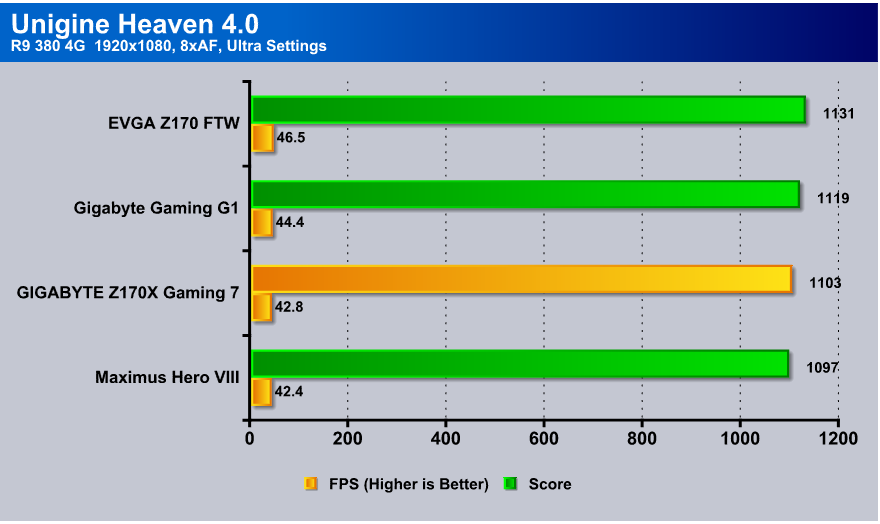
Unigine Heaven 4.0 is a long time used and trusted measure of performance using a real life gaming engine that hammers GPU’s as well as providing a sense of how well the system handles GPU’s and all the subsystems that support them. The EVGA FTW board is a great design but we think the simplicity and solid circuitry on the board gives it a little advantage here. At times the complex circuitry on high-end boards can cause a little latency and affect scores. For instance the PLX chip on the Flagship GIGABYTE Z170X Gaming G1 will produce some latency but on Z170x it’s really the only way you can get 16x 16x SLI or Xfire performance so that latency is easily overlooked for multi GPU users. The GIGABYTE Z170X Gaming 7 came in at 28 points below the chart topper and 4 FPS slower but for all intents and purposes the performance is the same and the small difference is more than likely just little variations in the benchmark runs.
Handbrake
We used a 900K Big Buck Bunny video and trans-coded it from AVI to MP4 three times, we added up those 3 runs and averaged the scores reported here.
Here is a detailed breakdown of HandBrake’s features:
Built-in Device Presets—Get started with HandBrake in seconds by choosing a profile optimized for your device, or choose a universal profile for standard or high quality conversions. Simple, easy, fast. For those that want more choice, tweak many basic and advanced options to improve your encodes.
- Supported Input Sources—Handbrake can process most common multimedia files and any DVD or Blu-ray sources that do not contain any kind of copy protection.
![]()
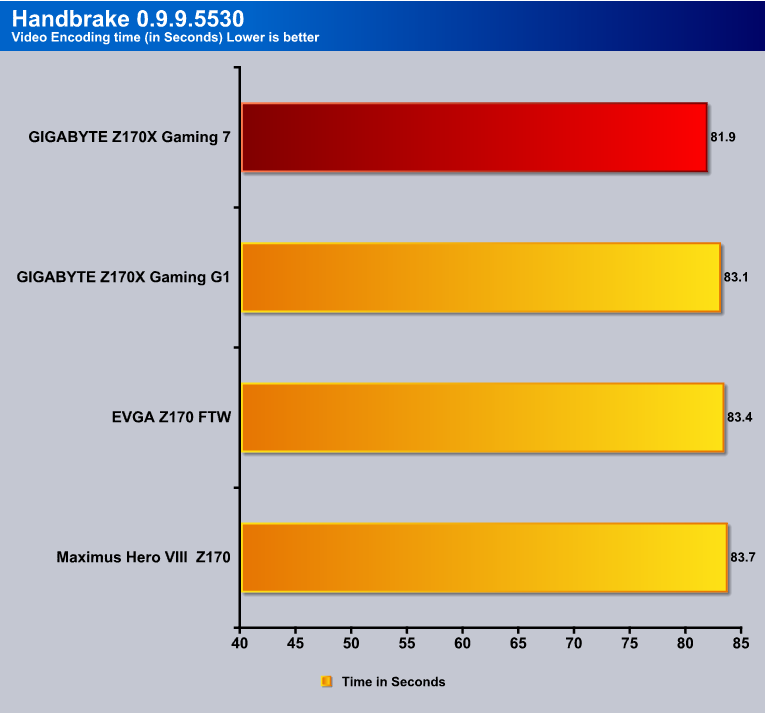
The GIGABYTE Z170X Gaming 7 rose to the chart’s top in Handbrake with a 1.2 second lead and by spending 6 or 7 hours tuning each board we see a 2.2 FPS difference between the top and bottom boards.
ROG RealBench
RealBench uses real, open source applications to test your PC as it would perform in RL. Although it can be competitive, it’s not primarily designed to be more hardcore and time-consuming – it’s a benchmark for everyone.
Select the three tests and run the benchmark to get your result. Each test uses different parts of your PC subsystem, so all areas are covered. Share the result here on the forum to compare to others, or, compare to pre/post overclocks and pre/post upgrades to get maximum value from your PC.

We’ve been testing RealBench since it’s inception and it utilizes open source software and in no way favors any specific manufacturer but it scales will with every component we test it on. You select the benchmarks you want (we leave all of them to run) then click “Start” and if you so much as move the mouse the test aborts. No human interference is allowed and as such is a reviewers dream.
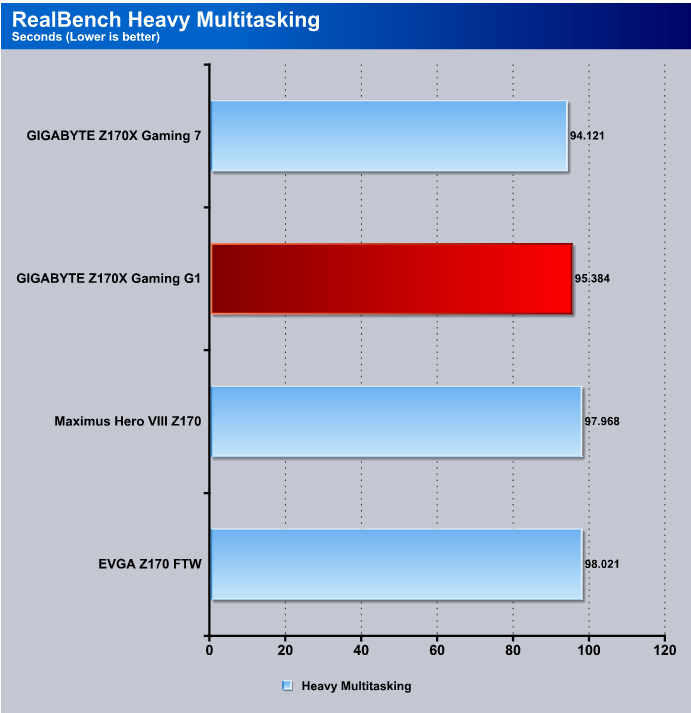
Heavy Multitasking drives all the cores as hard as they can go and the GIGABYTE Z170X Gaming 7 scores a 95.384 second run and places second on the chart but the boards are all still tightly grouped.
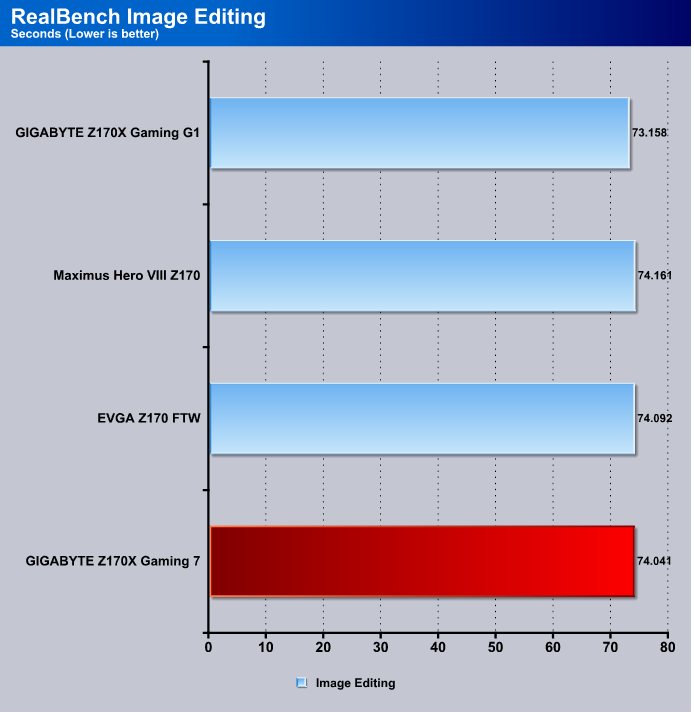
We got a 74.041 Second run on Image editing but be real and look at those scores one second from the top to the bottom and frankly a spike in the power or a small voltage variation in the circuits can account for that small a difference.
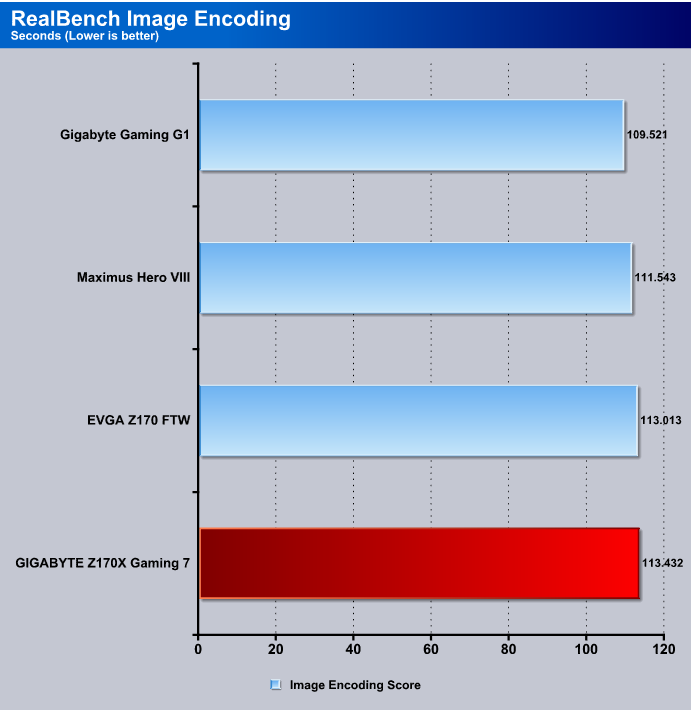
Image Encoding sees pretty much the same thing the GIGABYTE Z170X Gaming 7 stroked a 113.432 second run with 4 seconds separating the chart top and the GIGABYTE Z170X Gaming 7.
We got a small lead with the Asus Hero board and the GIGABYTE Z170X Gaming 7 ran a close second to it but the Hero board was about 82 points ahead of the rest of the boards which really isn’t much difference.
SiSoft Sandra
Designed as a complex utility for analyzing your computer’s software and hardware abilities as well as running various tests to stress out components separately, SiSoftware Sandra Lite is one of the most resourceful apps in its category. It includes numerous options that require significant time to get used to if you’re not familiarized with this kind of software. Suffice it to say, it targets power PC users.
When it comes to hardware data, it is possible to get a complete overview on the computer (e.g. processors, memory, graphics), storage adapters and devices (e.g. drive geometry, S.M.A.R.T.), mainboard, chipsets, busses, processors, power management, display and video adapters, GP (General Purpose) processors and accelerators, printers and faxes, and so on. Regarding software, the application shows details pertaining to the logical drives, file types, fonts, media devices, operating system, memory usage, processes, modules, services and drives, and more.
There are multiple types of benchmarks available, such as SIMD processor units, ALU and FPU processors, as well as financial analysis. Any tasks that you frequently perform can be added to a favorites list for quick access, while information from any area can be generated into a report and exported to file for close inspection and safekeeping. Modules that you don’t need can be easily deactivated. In addition, it is possible to monitor the environment of your computer.

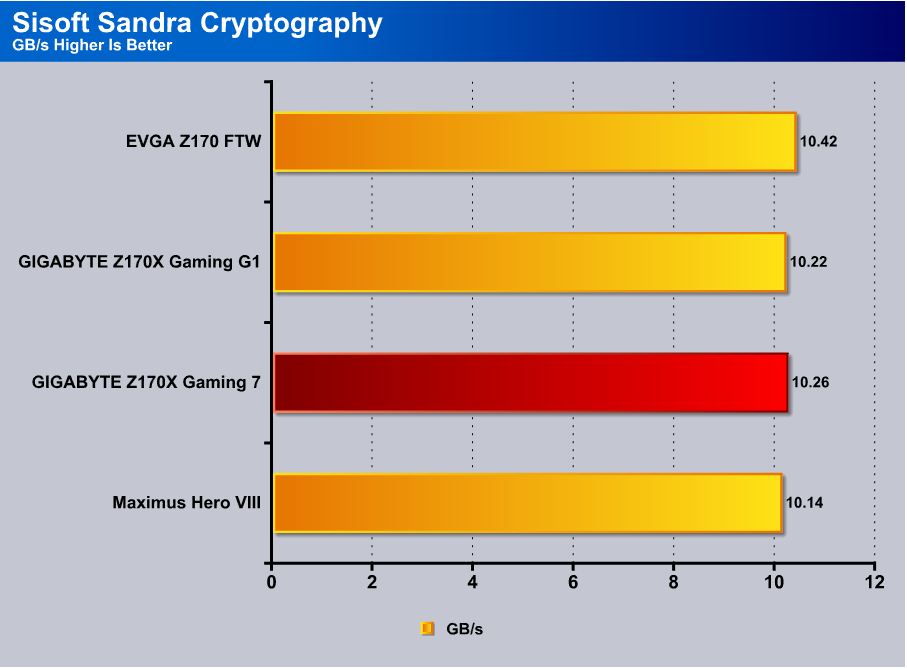
Cryptography is everywhere in computing, the world is a fairly paranoid place and for good reason, with all the data breaches cryptography becomes more important with each passing Day. The GIGABYTE Z170X Gaming 7 turned in a 10.26 GB/s on the test .28 GB/s behind the chart’s top runner.
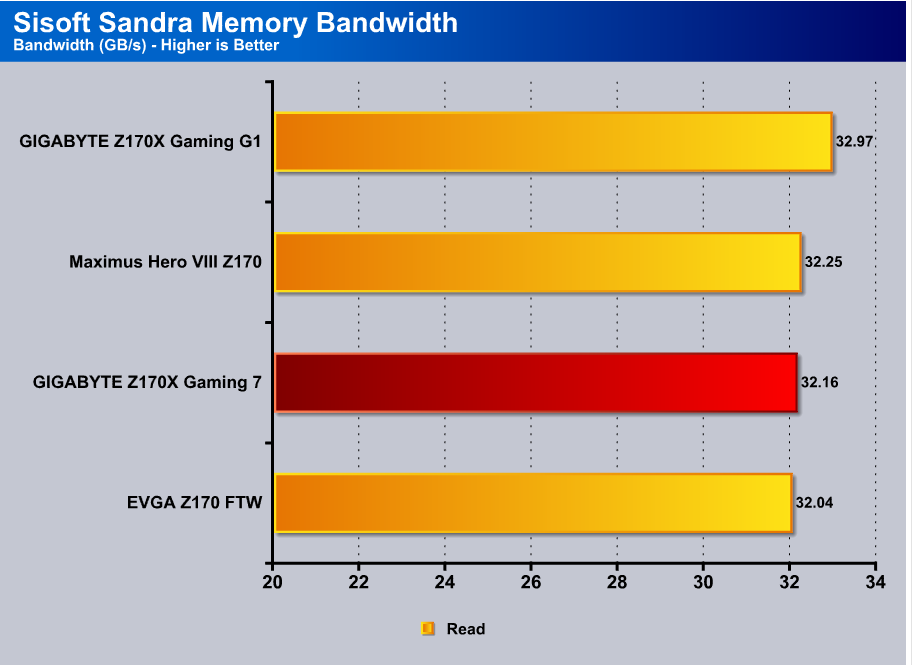
SkyLake and the Z179 chipset run Dual Channel DDR4 and all the boards report the Kingston 2666MHz kit in the 32 GB/s range while the GIGABYTE Z170X Gaming 7 turns in a 32.16GB/s ,81GB/s behind the top runner which realistically is a pretty small difference statistically.
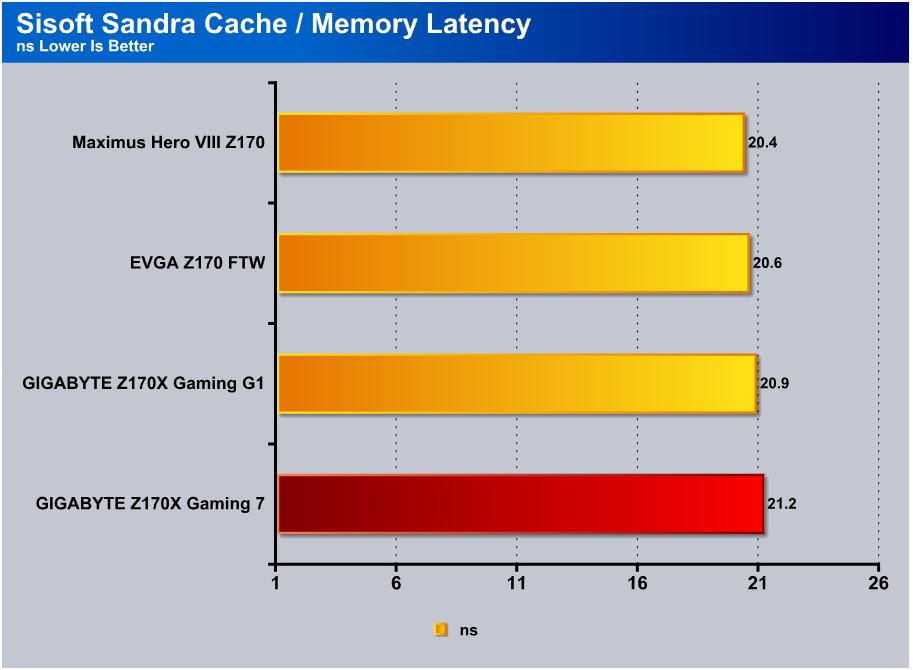
Using the same Kingston HyperX Fury kit across all four motherboards produces similar cache memory results and we are talking nanoseconds here. Our GIGABYTE Z170X Gaming 7 came out about 1ns behind the Asus Hero board.
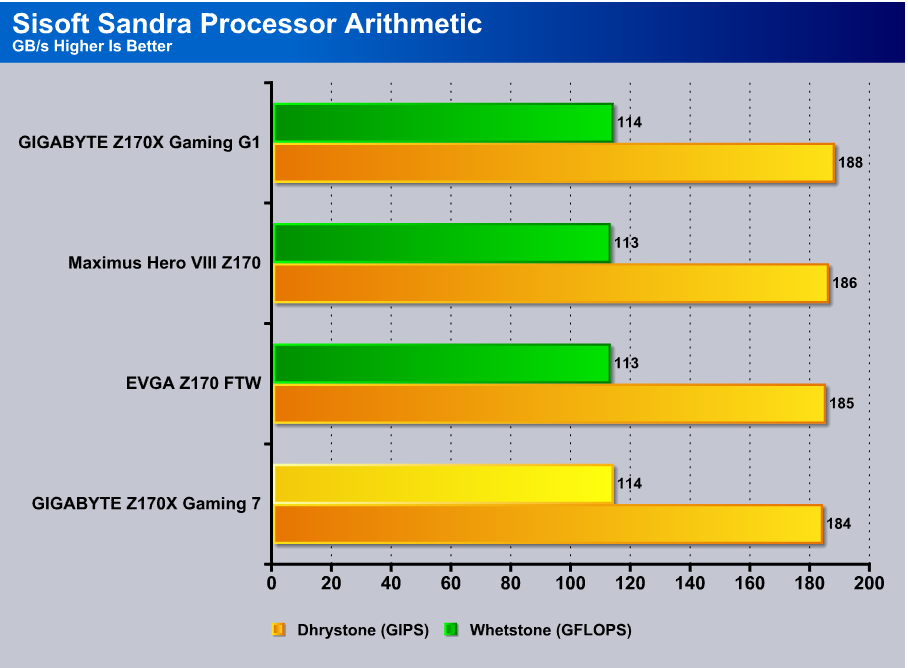
The GIGABYTE Z170X Gaming 7 ran as fast as any board on the charts in the Dhrystone portion of the Processor Arithmetic test, then in the Whetstone test came in 4 points behind the GIga Gaming G1 board.
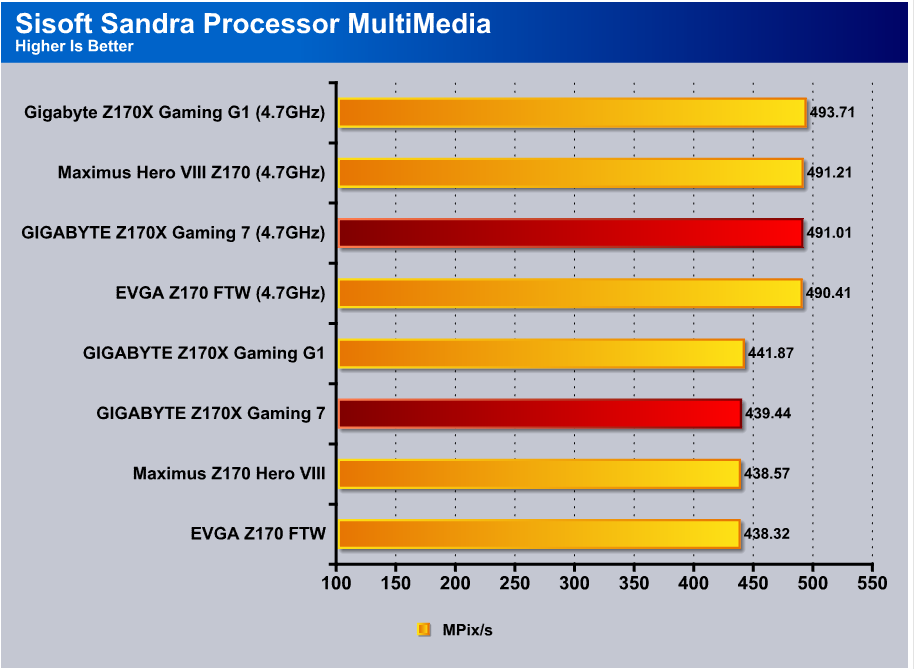
For Sandras Multimedia test we went whole hog and ran both stock speed and OC’d tests on the boards, all the boards hit 4.7GHz with minimal effort but to get the best performance out of each board we spend about 6 or 7 hours tuning the different aspects of the voltage. SOme boards will have a little more voltage droop than others depending on the VRM setup and every board overclocks a little different even if it’s the exact same board.
TrueCrypt
TrueCrypt is a discontinued source-available freeware utility used for on-the-fly encryption (OTFE). It can create a virtual encrypted disk within a file or encrypt a partition or (under Microsoft Windows except Windows 8 with GPT) the entire storage device (pre-boot authentication).
![]()
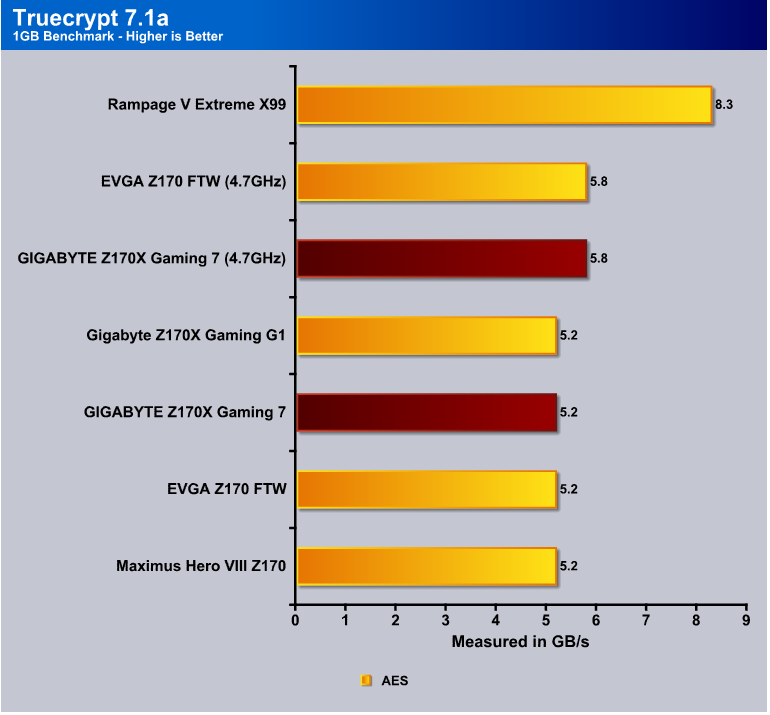
Truecrypt hasn’t been giving us benchmark love, all the test done on the exact same platform with a different motherboard were yielding the same scores and it was about to fall off the bench, Then it struck us go back and OC the boards and see if it scales. The 4.7GHz OC yields a 0.6GB increase in decryption and the boards all move up to 5.8 GHz so it’s some small use to show the performance increase but not to separate the pack performance wise.
Metro 2033
In 2013, a nuclear war occurred, forcing a large amount of Moscow’s surviving population to relocate to underground metro stations in search of refuge from the outside world. Eventually, those who settled in the underground train stations evolved their homes into independent station-countries. Soon, new factions grew, ranging from the independent “Rangers” to the communist “Red Line” faction to the “Fourth Reich” which constantly engages in skirmishes with the former group. As these small states began to evolve, the Red Line and the Fourth Reich entered a permanent state of war, as both sought to control the metro and its resources. As the war raged, those stations who refused to join either side were massacred by the militants, raided by bandits, or outright destroyed by the Dark Ones – paranormal, otherworldly, mutated humans who live on the ravaged surface. While most of the stations are controlled by the three factions, several stations are abandoned, some have independent tribal rule, while some are occupied by the Dark Ones. Within one of those stations is where the events of Metro 2033 unfold.

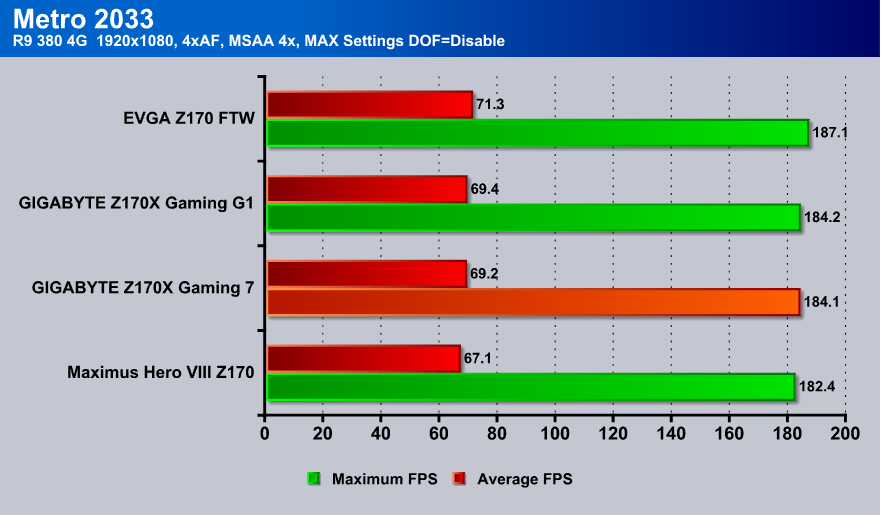
Metro 2033 sees the GIGABYTE Z170X Gaming 7 in at 69.2 FPS Average FPS using the R9 380 4G and as you can see all of the board perform well with the R9 380 4G. Now we could pop on a GTX 980 Ti and blow a million FPS but the R9 380 4G is a good everymans card and since we are testing the motherboard and not the GPU it’s an affordable choice more people use than a massively expensive GPU.


Hey! Great Info. I just got one. Running on 360 Predator AIO.
You mention,
” We played with the cache speeds keeping them at 4.1 and setting them equal to the CPU speed. ”
Where on earth are you setting that in the BIOS? I can find nothing for cache speeds?!
Thanks for any clarification
I am wishing I had spent more and had gone with ASUS. Lots of weird power-related and graphics-related glitches with the Gaming 7. I think I finally solved the problem of the computer restarting itself every time I shut it down. Sometimes the machine turns itself off when it’s supposed to be in standby. I use the onboard graphics, and sometimes only one of my two monitors will display anything when coming out of standby, starting up, etc. You’d think getting basic power and display functions right would be important. Hopefully BIOS updates will solve some of these issue, but I’m not terribly optimistic about that happening.
The feature list is really nice, and I really wanted the native Thunderbolt support, but I wish I had chosen differently.
Excellent in depth review which made my mind up to by this motherboard over the Asus Hero motherboard… and yes I made the right decision… Excellent straight out of the box. The sound is exceptional with the Soundblaster 3d sound and the OP AMP feature. The intel based 3.1 USB controller also makes a difference. I have used a Samsung SM951 M.2 NVme SSD with is nothing short of incredible.
Looks are subjective but I liked the white and red theme. The metal shroud over the PCIE slots actually make a difference by keeping my Palit 1070 straight…no sag at all.
Overclocking was a breeze with 4.5 achieved without even trying… will go further later. Overall a well priced high spec z170x motherboard… I would recommend this to anyone who wants something a little different from Asus with a bit more value for the money..