Testing Methodology
The OS we use is Windows 8.1 Pro 64bit with all patches and updates applied. We also use the latest drivers available for the motherboard and any devices attached to the computer. We do not disable background tasks or tweak the OS or system in any way. We turn off drive indexing and daily defragging. We also turn off Prefetch and Superfetch. This is not an attempt to produce bigger benchmark numbers. Drive indexing and defragging can interfere with testing and produce confusing numbers. If a test were to be run while a drive was being indexed or defragged, and then the same test was later run when these processes were off, the two results would be contradictory and erroneous. As we cannot control when defragging and indexing occur precisely enough to guarantee that they won’t interfere with testing, we opt to disable the features entirely.
Prefetch tries to predict what users will load the next time they boot the machine by caching the relevant files and storing them for later use. We want to learn how the program runs without any of the files being cached, and we disable it so that each test run we do not have to clear pre-fetch to get accurate numbers. Lastly we disable Superfetch. Superfetch loads often-used programs into the memory. It is one of the reasons that Windows Vista occupies so much memory. Vista fills the memory in an attempt to predict what users will load. Having one test run with files cached, and another test run with the files un-cached would result in inaccurate numbers. Again, since we can’t control its timings so precisely, it we turn it off. Because these four features can potentially interfere with benchmarking, and and are out of our control, we disable them. We do not disable anything else.
We ran each test a total of 3 times, and reported the average score from all three scores. Benchmark screenshots are of the median result. Anomalous results were discounted and the benchmarks were rerun.
Test Rig
| Case | Thermaltake Level 10 |
| CPUs | Intel Core i7-3930 @3.2 Ghz |
| Motherboards | ASUS P79X Deluxe |
| Ram | 32 GB |
| CPU Cooler | Corsair H100 |
| GPU |
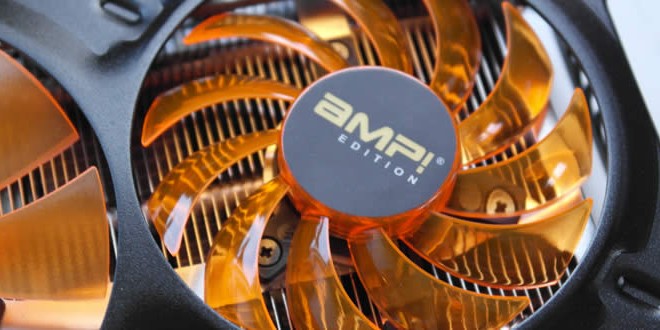
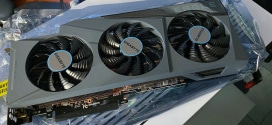
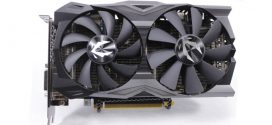
R9 280X Crossfire HIS R9 280X IceQ X2 Turbo HIS R9 270X IceQ X2 Turbo Gigabyte GTX 770 2 GB Zotac GeForce GTX 760 AMP! Zotac GeForce GTX 770 Zotac GeForce GTX 780 Asus GeForce GTX Titan Zotac GeForce GTX Titan AMP! Zotac GeForce GTX 680 Zotac GeForce GTX 780 Ti AMP! Edition |
| AMD |
Catalyst 13.11 Beta 3 |
| GeForce Drivers |
331.40 (Gigabyte GTX 770) 320.14 (GTX 680, 690 and TITAN) 320.18 (GTX 780, GTX760 AMP!) 320.08 (GTX 770) – This is the version included on the CD, none of the downloadable worked. R331.82 (GTX 780 Ti AMD) |
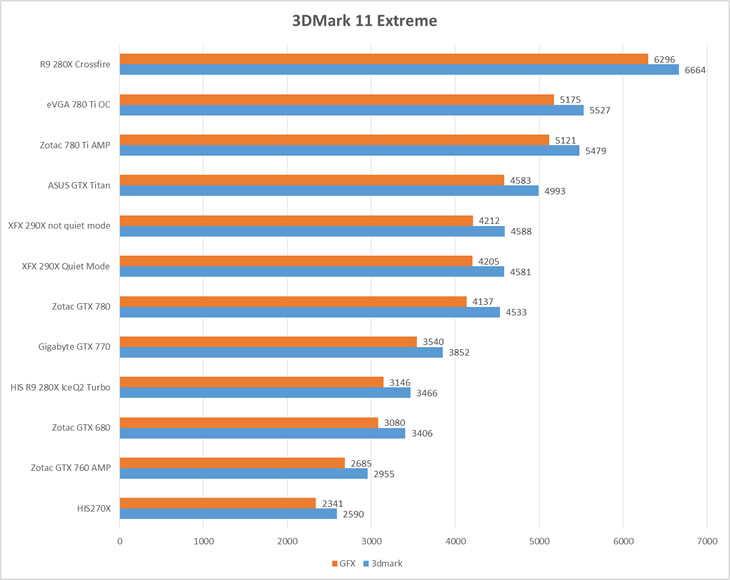
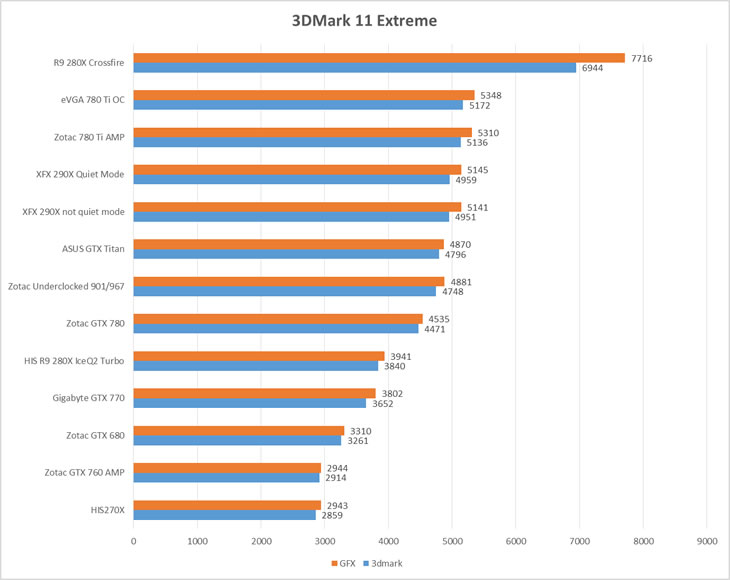
The Zotac 780 Ti AMP? Edition is together with the similary overclocked eVGA 780 Ti SOC the fastest single GPU card in these two synthetic tests. It easily passes the expensive GTX Titan. We did unfortunately not have a regular clocked GTX 780 Ti on hand so we underclocked this card as much as possible. From the result for the underclocked card we can deduct that the Zotac is about 10% faster than a regular GTX 780 Ti.
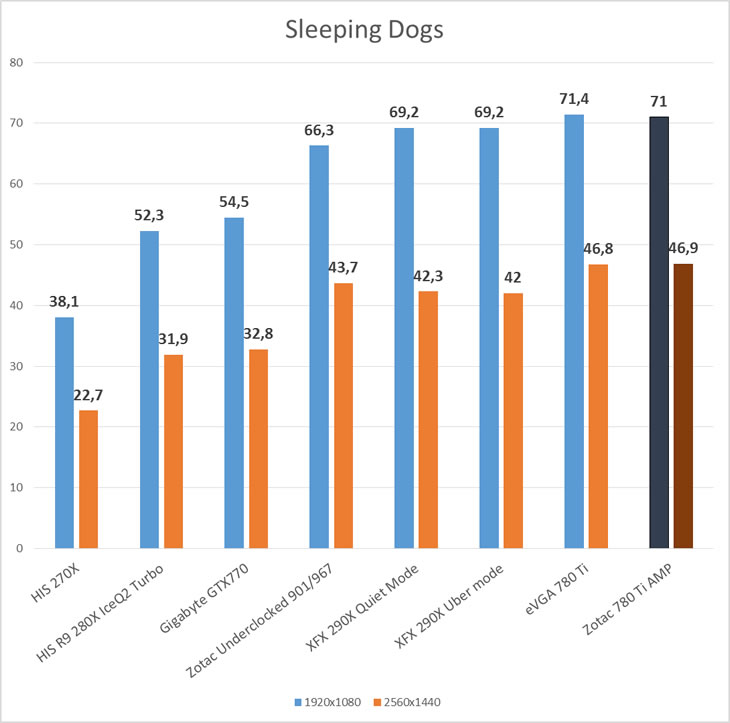
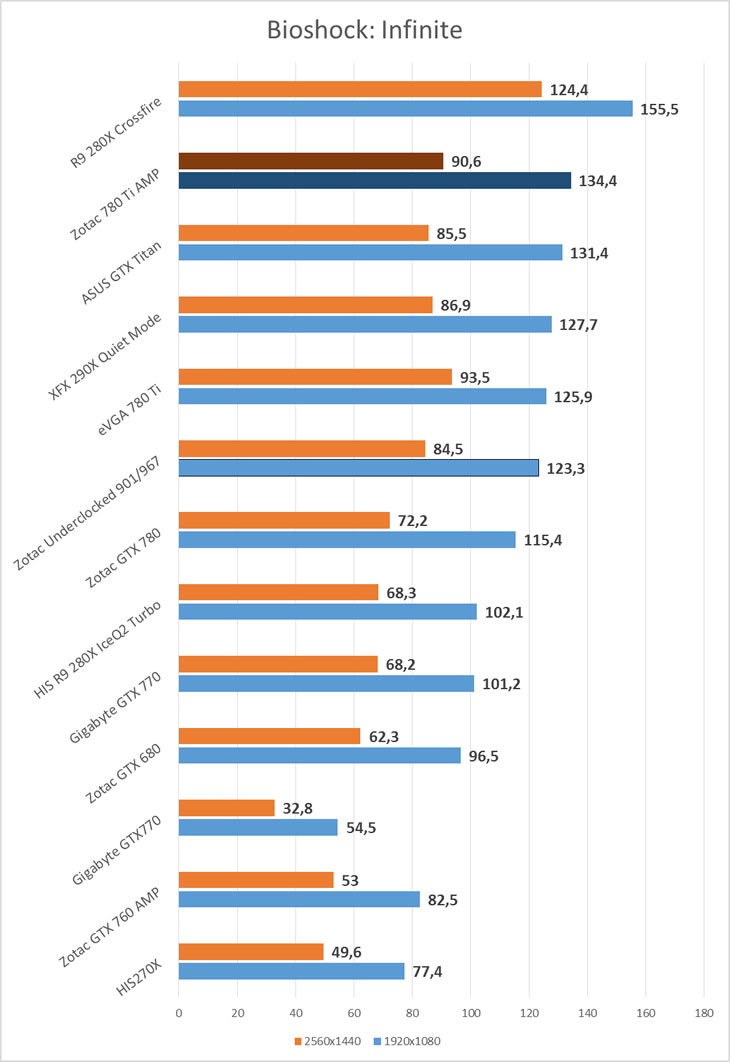
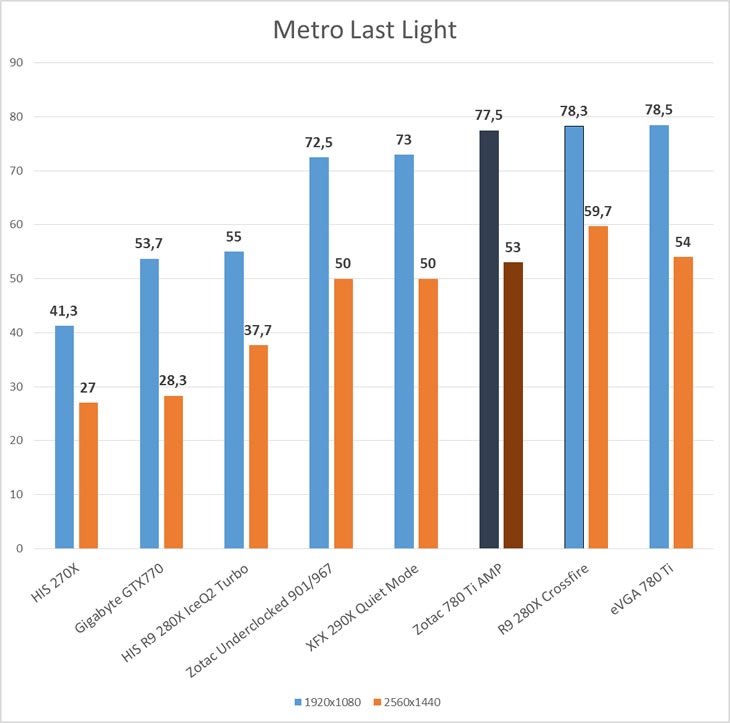
As we move to proper games the result is similar. In Bioshock: Infinite the Zotac GeForce GTX 780 Ti AMP Edition even beats out the GTX Titan. This card packs some serious punch!
Overclocking
Zotac includes a overclocking utility with the card called Firestorm. This gives us the same type of control over the card as for example the MSI Afterburner including the ability to affect the voltage. We used Zotacs own utility when trying to overclock this card. Any overclock had to run several benchmarks and burn-in tests before being accepted.
This is one freakingly overclockable card! It tooks some time to find a core-clock and memory clock to settle at. We did not mess with the voltage so there might be even more to get out of the card. So what was the final overclock? How about 1095 MHz for the core, 1161 MHz boost core clock and 7850 MHz for the memory! That is almost an 10% increase in both core and memory clock over the already overclocked settings of the card.
| 1006 / 1072 / 7200 MHz | 1100/1166/7800 MHz | |
| 3DMark 13 Firestrike Extreme | 5136 | 5465 |
| GFX | 5310 | 5676 |
| Sleeping Dogs 1920×1080 | 71 | 73,8 |
| Sleeping Dogs 2560×1440 | 46,9 | 49,4 |
| Bioshock: Infinite 1920×1080 | 134,4 | 140,8 |
| Bioshock: Infinite 2560×1440 | 90,6 | 94,9 |
An overclock does not automatically mean you get the same percentage of better performance since framerates depend on many things. In the few tests we benched we see a increase in performance but not close to the 10% we expect.
Noise and power consumption
This amount of performance usually comes with a price, either with a big power usage, high temperatures, lots of noise or all three. The TDP of the GeForce GTX 780 Ti is the same as the GTX 780 and the Titan: 250 Watt. We measured the power consumption at the wall for the whole system.
| Power consumption | Temperature | Noise, measured 1 meter from the front of the case | |
| Idle | 98 W | 30 degrees | 37.7 dB |
| Running MSI Combustor | 405 W | 68 degrees | 42 dB |
| Running Metro: Last Light | 465 W | 65 degrees |
As we all know you do not need a 1200W PSU to run such a powerful card unless you have several. The fans also have no problems keeping the card cool. That also means we never have to worry hitting the 82 degrees that are the default limit before the card throttles down.
As for the noise the card has a soft sound (hard to explain) meaning that even when we push it very hard via MSI Combustor and the noise level rises to over 40 dB it still isn’t annoying. We have heard other fans that have a more sharper annoying sound even at lover sound levels.
Zotac definitely has done a good job with the fans on this card.
Review Overview
Performance - 9
Value - 7.5
Quality - 8.5
Features - 9
8.5
The Zotac GeForce GTX 780 Ti AMP Edition impresses us with great performance, excellent room for more overclocking, a good cooling solution and interesting features.
 Bjorn3D.com Bjorn3d.com – Satisfying Your Daily Tech Cravings Since 1996
