TESTING & METHODOLOGY
PC – Windows 7
To test the OWC 240GB Mercury EXTREME Pro 6G SATA III SSD we cloned our test rig drive to the SSD. It is the same test drive we’ve been using on all of our drive testing and is nothing more than a clean Windows load with all the drive testing software installed, as well as all the current drivers and patches for the OS. It’s the equivalent of doing a fresh load of Windows 7 from the disc but takes a lot less time and ensures that every drive tested uses exactly the same OS load and drivers. Nothing that may effect the outcome of the testing procedure can creep in. We ran all of the tests a total of 3 times and averaged those results. The Average of the three results are presented here. In the case of a pictorial benchmark we ran the bench 3 times and picked the median result. As with most SSD testing differences from run to run are minimal and the median result is a good indication of what you can expect from the drive.
We ran our usual battery of tests on the drive, and used it as the primary boot drive during testing. All of the drives tested were used as the primary boot drive during testing. That’s a more realistic test than strapping the drive in and testing it with a bare format or as a non-boot drive and it represents real life transfer rates, much like you can expect when you install and operate the drive in your own system. Each test was performed 3 times and the average of the 3 test run is reported here.
Mac OS X
We have performed the same cloning procedure as we have done on windows, but when we used the SSD in our Macbook Pro 2011 mode, we made sure it was placed in the SATA III main connectors, and that we had a fresh install of OS X Lion installed.
Test Setup
| Test Setup – PC | |
| Case Type | Cooler Master Storm Trooper |
| CPU | Intel Core i7-2600K @ 4.8GHz |
| Motherboard | ASUS P8P67 WS Revolution |
| Ram | Patriot Gamer 2 Series 16GB (4x4GB) Memory Kit |
| CPU Cooler | Noctua NH-D14 CPU Cooler |
| Storage Drives | OWC Mercury EXTREME Pro 6G 240GB SSD Kingston HyperX 240GB SSD OCZ Vertex 3 OCZ RevoDrive OCZ Solid 2 Kingston SSDNow V+ 128GB MLC OCZ Agility EX 60GB (SLC) Kingston SSDNow V 40GB (MLC) Kingston SSDNow V+ 128GB (MLC) G.Skill Titan 256 GB SSD (FM-25S2S-256GBT1) (MLC) Patriot 128GB Warp SSD (MLC) Intel 80 GB SSD X25-M G.Skill 64GB SSD (FM-25S25-64GB) (MLC) 2 WD VelociRaptor’s 300GB (In single and RAID 0) WD 160 GB SATA 2 Maxtor 160 GB SATA 2 WD & Maxtor in RAID 0 |
| Optical | ASUS DVD-RW Drive |
| GPU | 3x Nvidia GeFroce GTX 580 in 3-Way SLI |
| Testing PSU | Cooler Master Silent Pro Gold 1200W Modular PSU |
| Mouse | Razer Mamba |
| Keyboard | Tt eSports Meka G1 Mechanical Keyboard |
| OS | Windows 7 Pro 64-bit |
| Test Setup – Mac | |
| Model | MacBook Pro, 15-inch, Early 2011 |
| CPU | Intel Core i7-2720QM 2.2GHz Processor (3.3GHz Max Turbo Freq) |
| Ram | Kingston HyperX Plug-n-Play 8GB (2x4GB) 1600MHz Memory |
| Storage Drives | OWC Mercury EXTREME Pro 6G 240GB SATA III SSD(Main SATA)Hitachi 7200RPM 500GB 2.5″ SATA II Hard Drive (Secondary SATA) |
| Optical | N/A |
| GPU | AMD Radeon HD 6750M 1024MBIntel HD Graphics 3000 |
| OS | OS X Lion v.10.7.2 |
Test Suite
PC
| Benchmarks |
| ATTO |
| CrystalDiskMark |
| HDTach 3.0.4.0 |
| HD Tune Pro |
| AS SSD Benchmark |
MAC
| Benchmarks |
| OS X Lion Boot-Up Time with Browser |
| Speedtools Utilities 3 Pro |
| AJA System Test |
ATTO
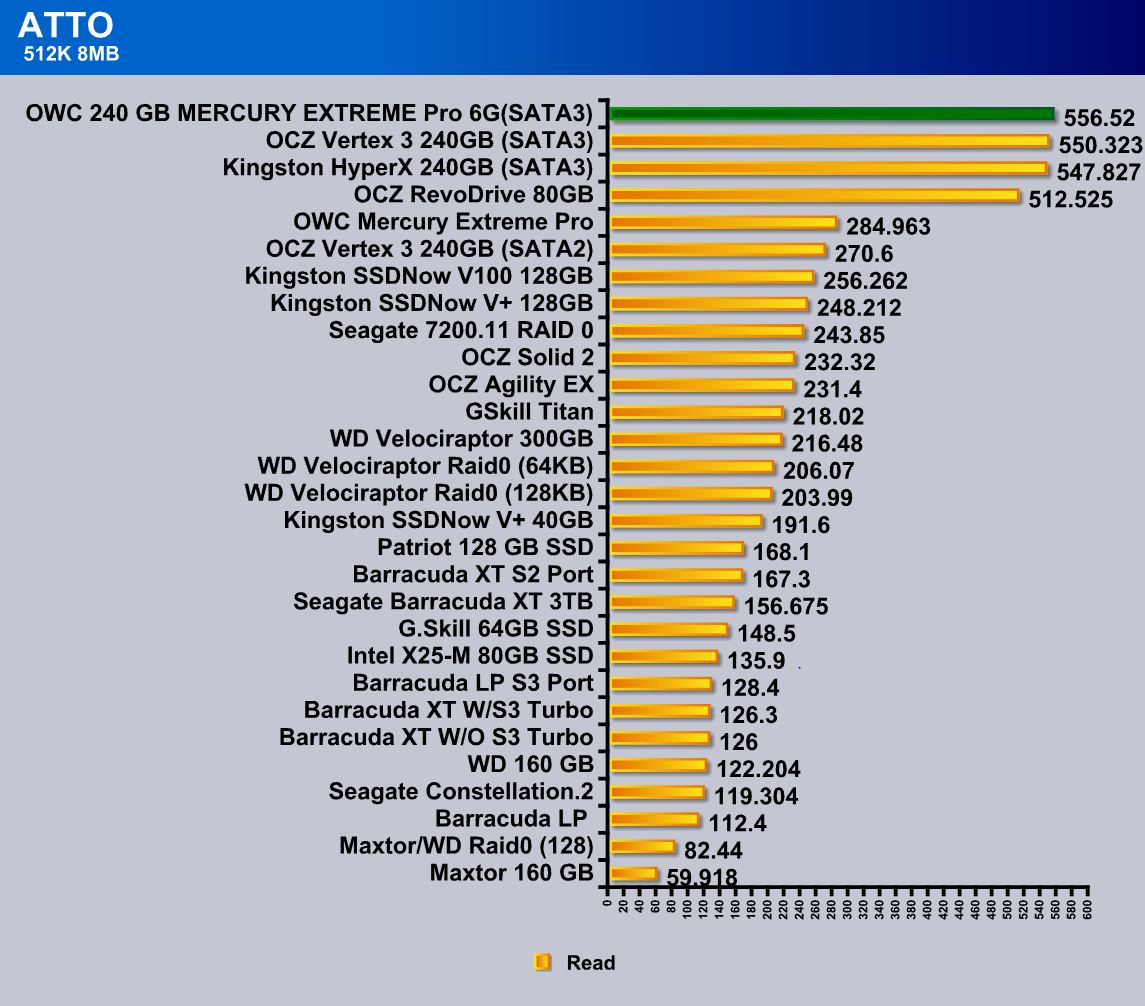
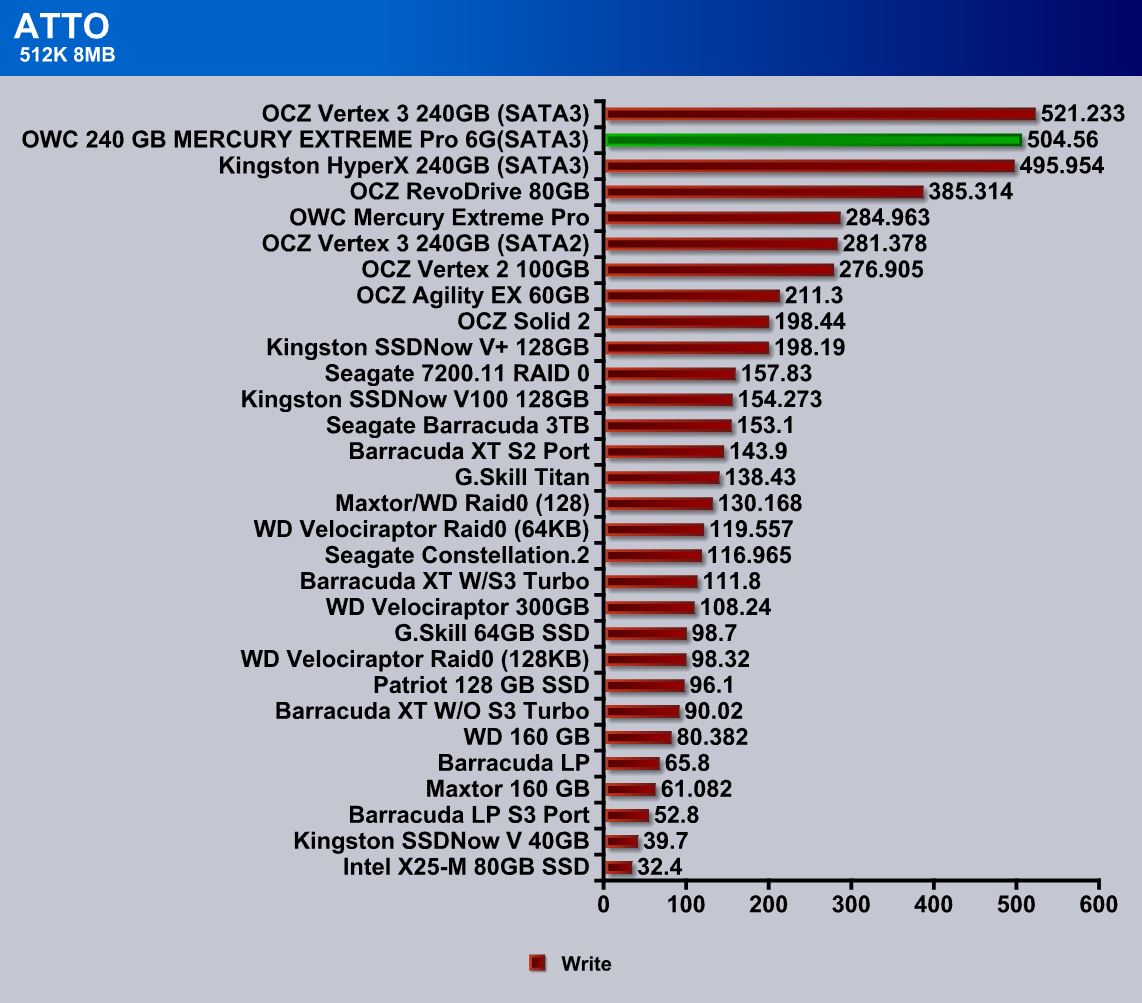
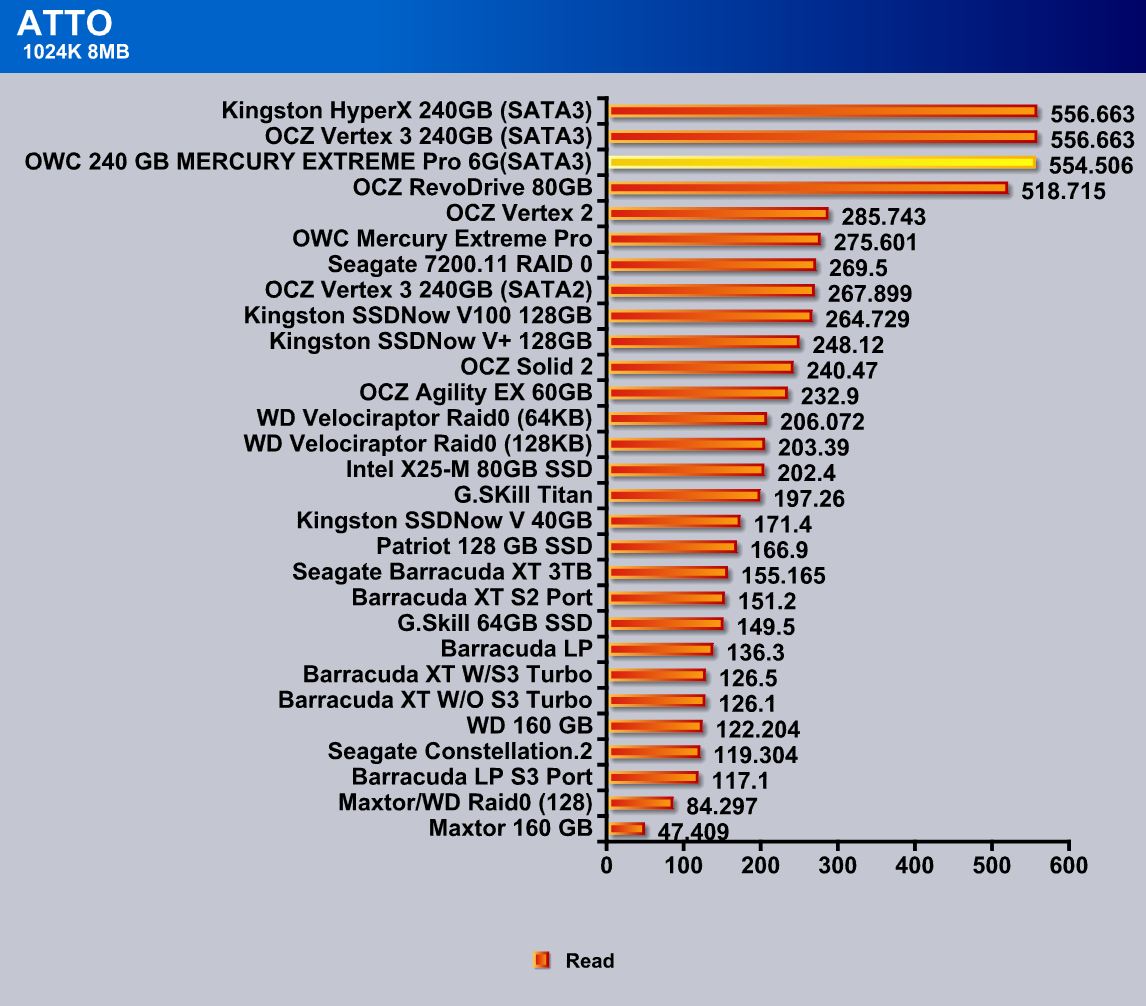
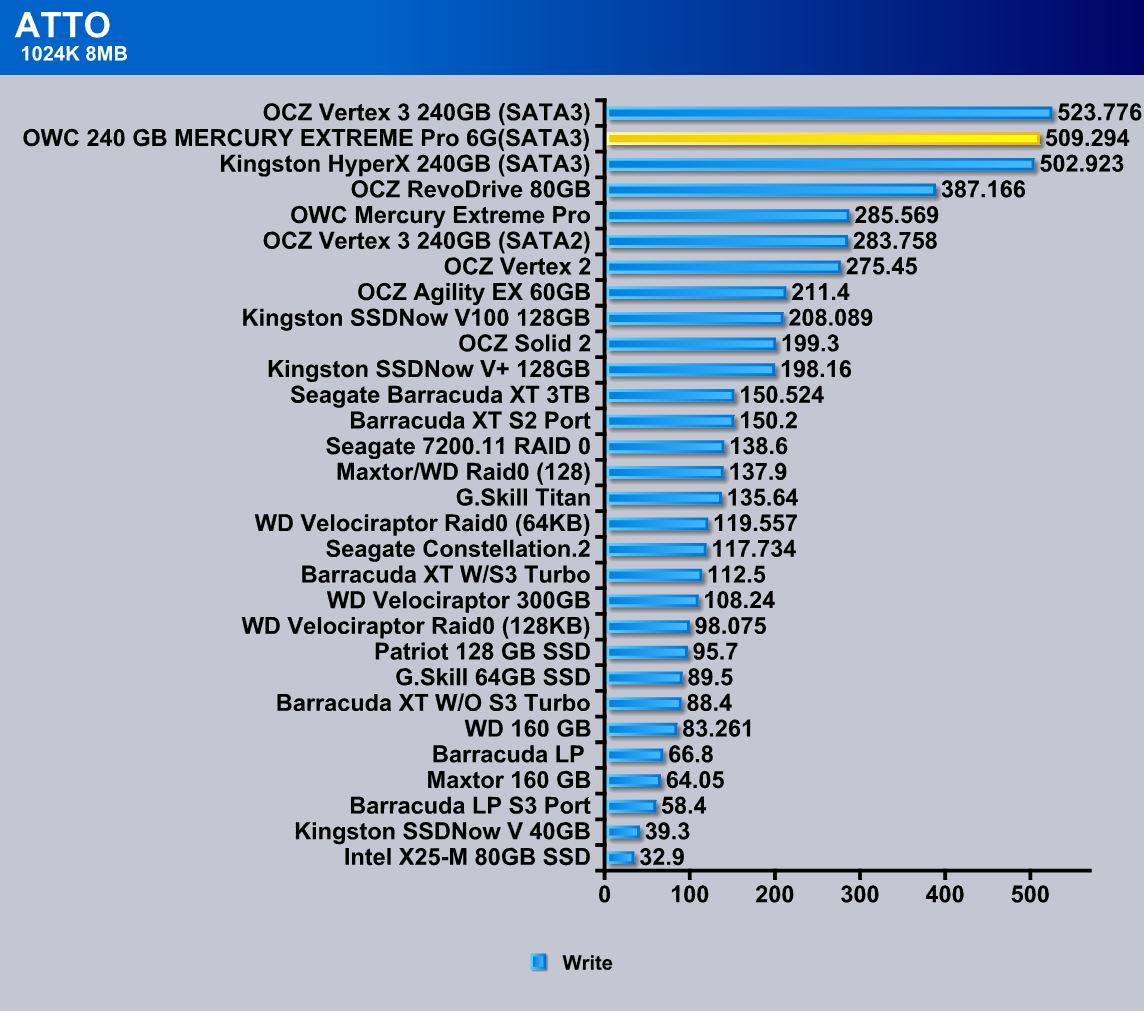
We are displaying the average performance of the SSDs in ATTO. In the 1024K 8MB Read test, there was an occasion when we actually got 558.823MB/s for our result, but because we are averaging 3 runs into one, the average performance of the OWC Mercury EXTREME Pro 6G was roughly around the Kingston HyperX 240GB SSD, or just a few MB/s higher or lower. These are very impressive scores.
HDTach 3.0.4.0
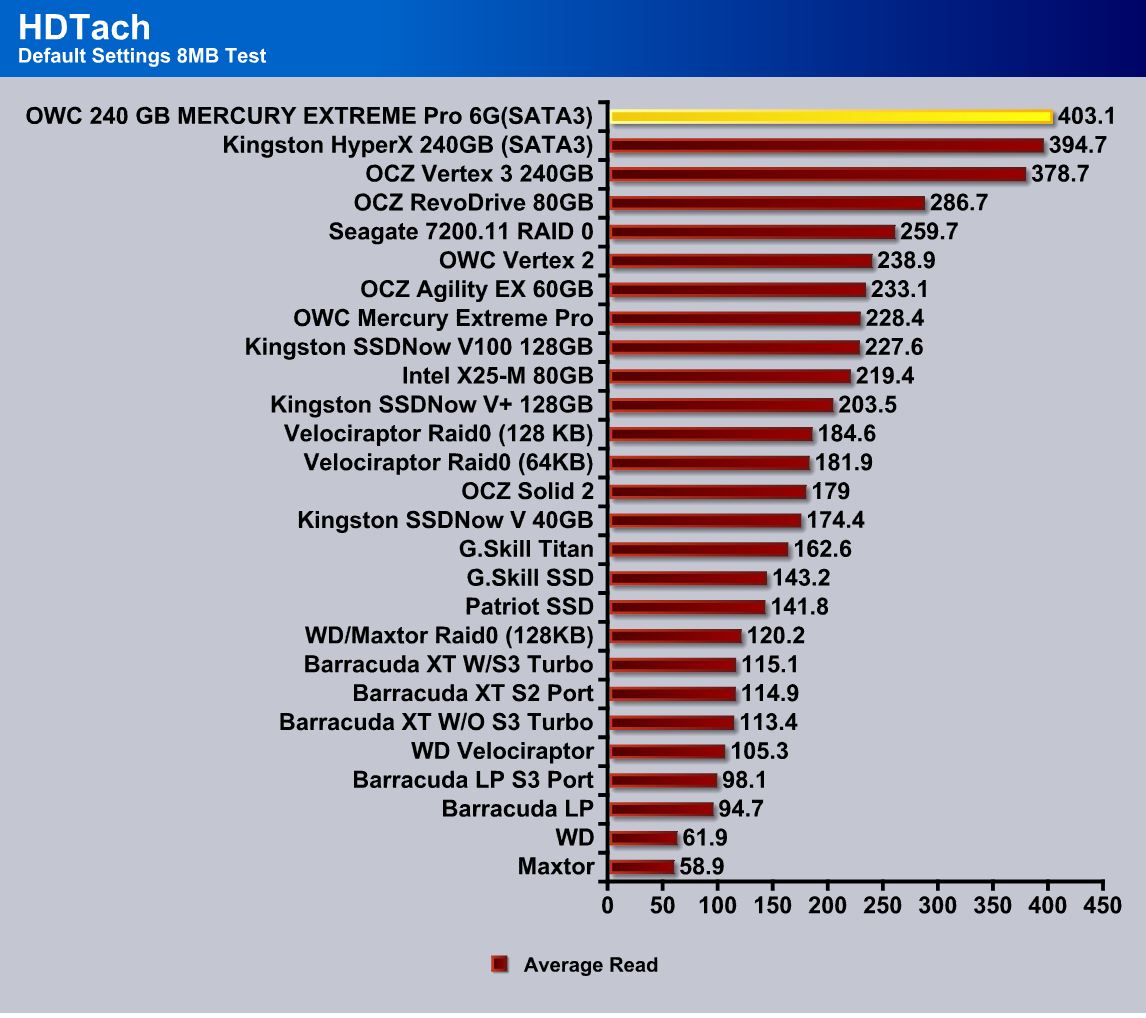
HDTach is a well trusted benchmarking suites that we use for testing our SSDs and Hard Drives. We performed the 8MB test just like we have done it on ATTO and the results were once again very impressive compared to the competition. We see about 9MB/s higher average read performance, and slightly higher Burst speeds compared to the Kingston HyperX 240GB SSD.
HD Tune Pro
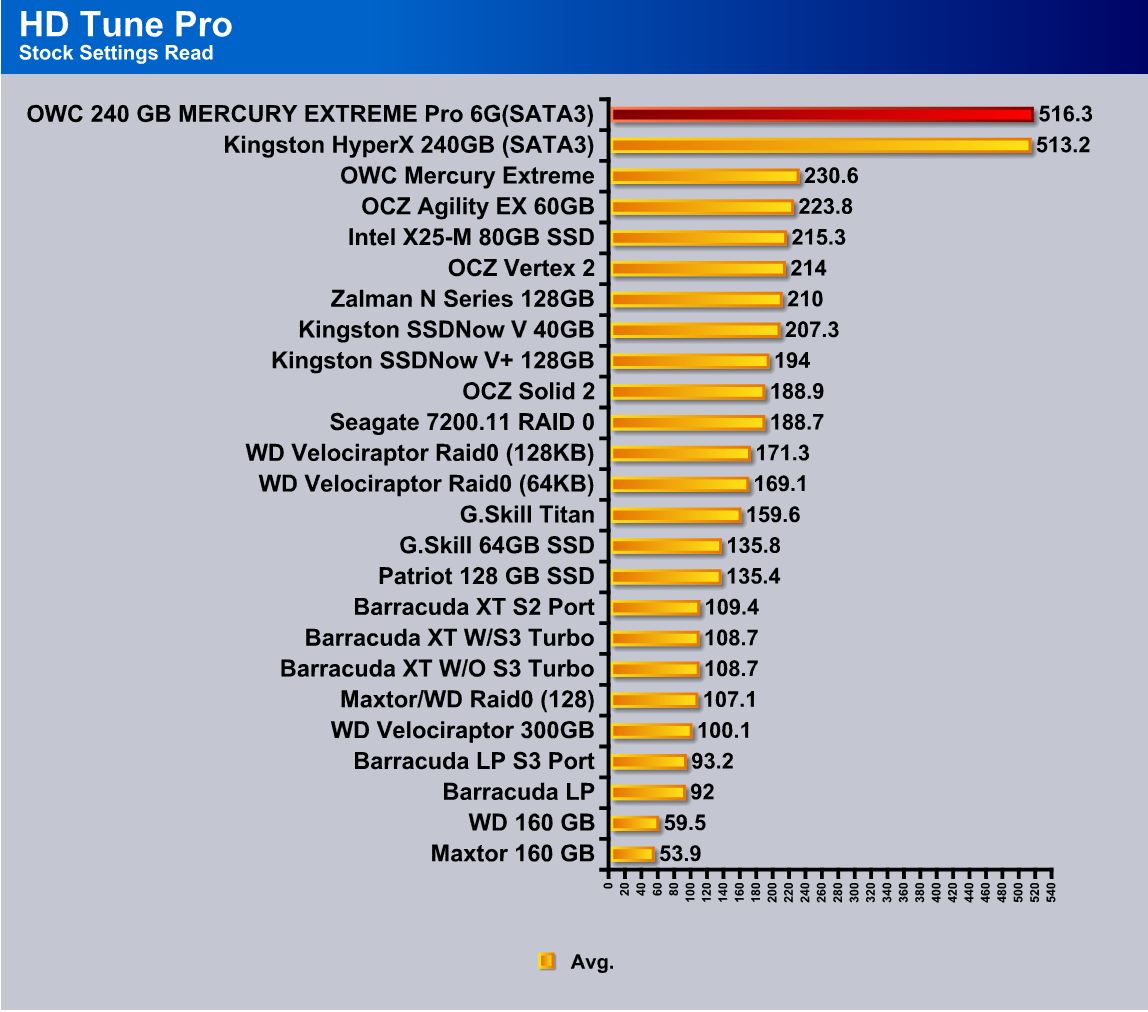
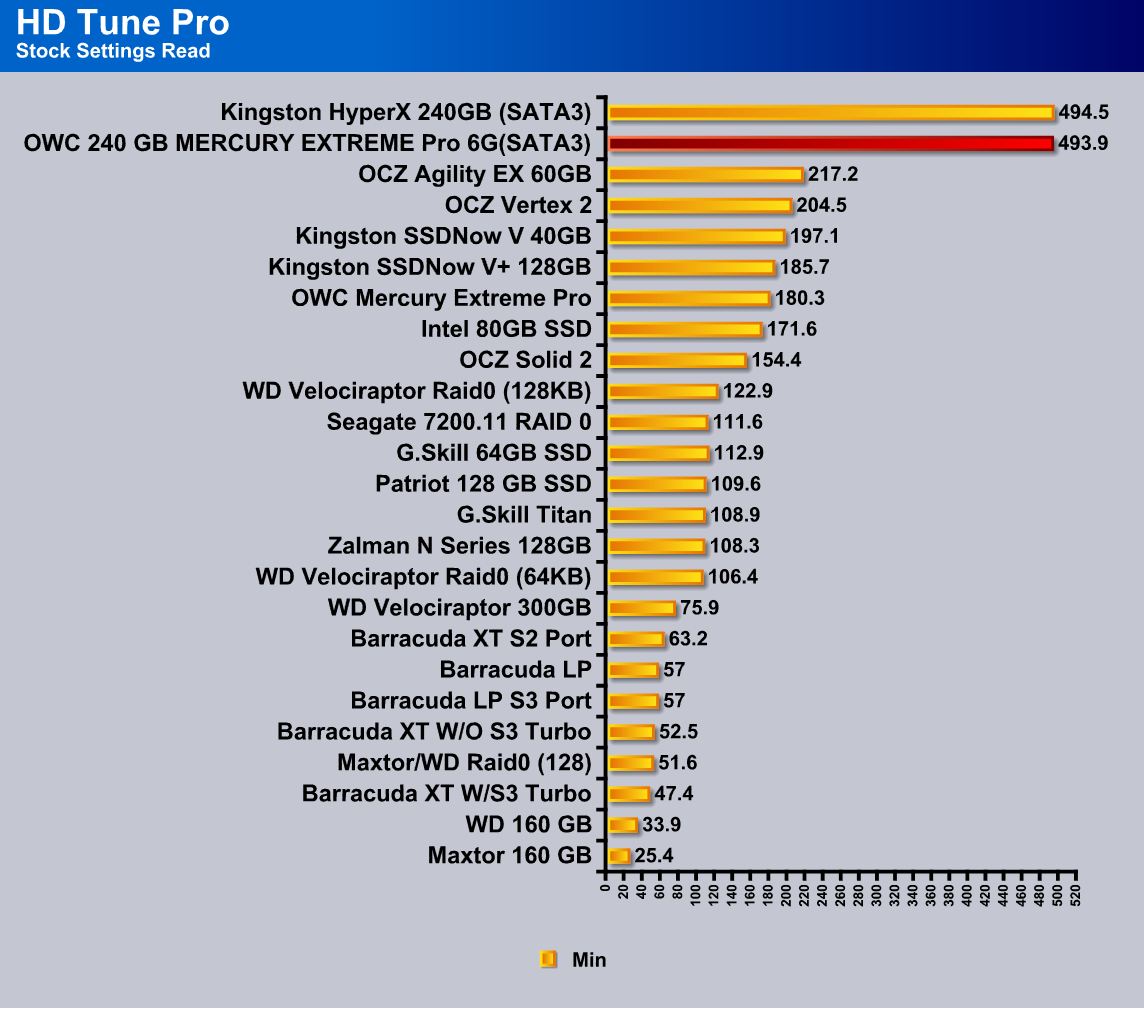
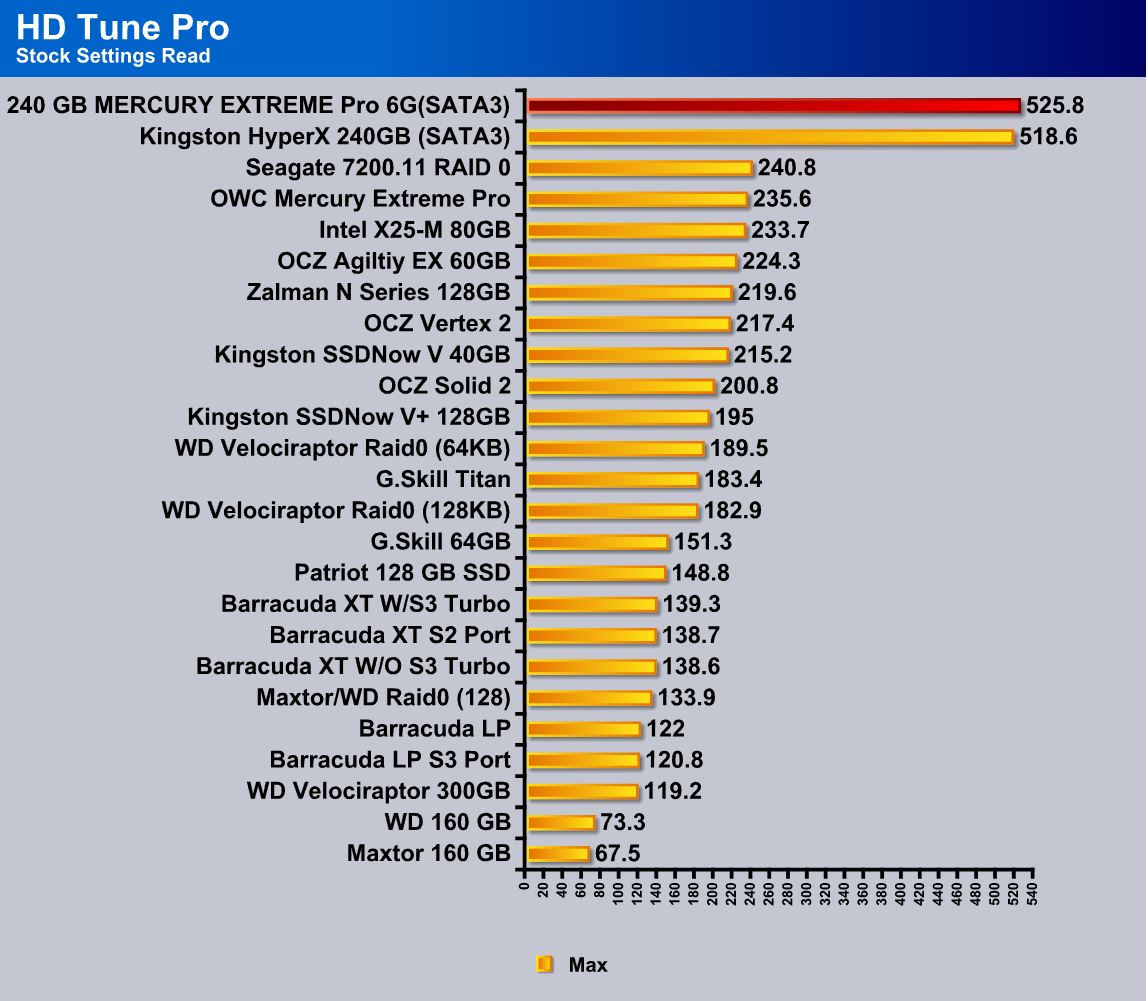
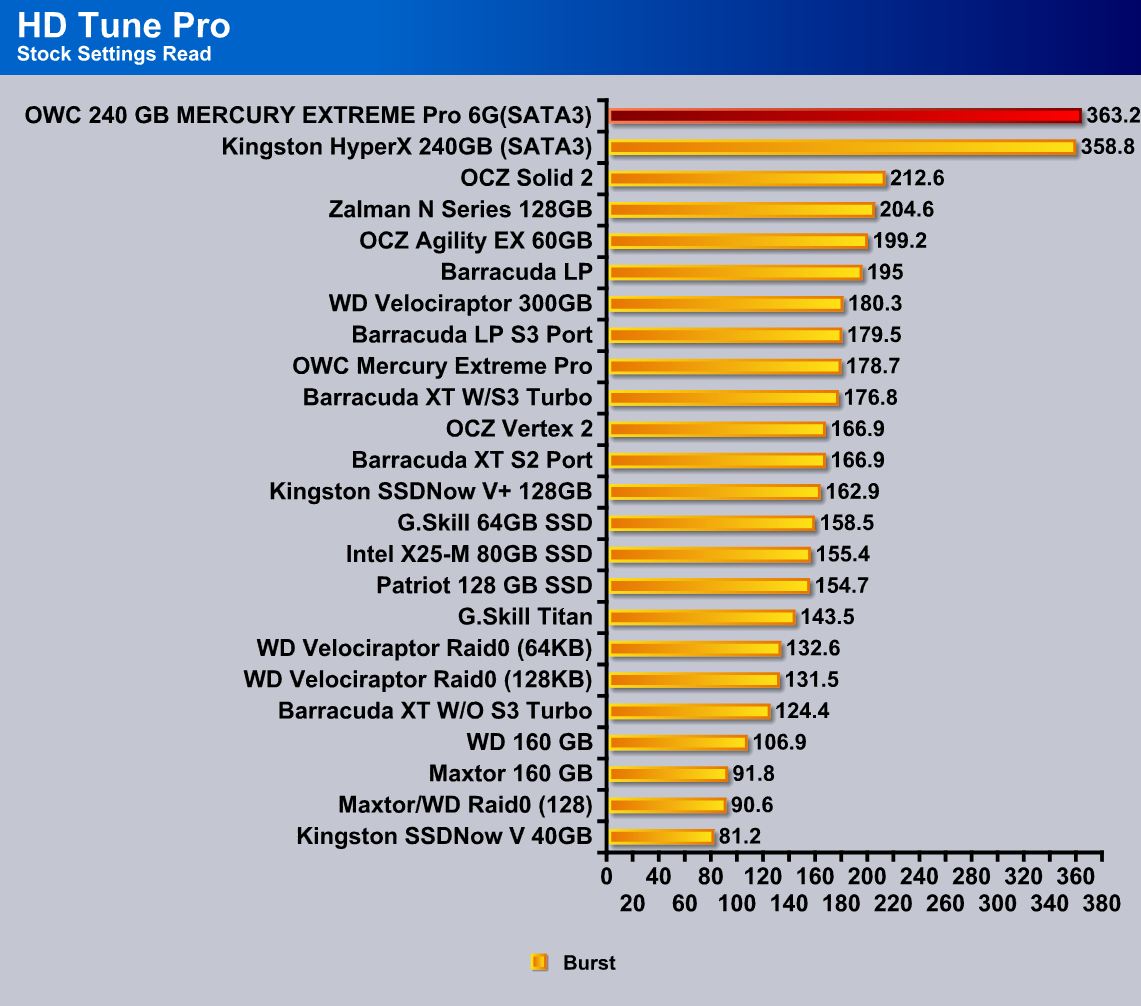
HD Tune Pro never fails to give us very precise and accurate performance numbers on our tested drives. The test goes through the whole drive getting an average read results along with the Min and Maximum performance the SSD reached. Its very interesting to see that the OWC Mercury EXTREME Pro 6G just surpassed the Kingston HyperX SATA III SSD in all but minimum performance.
Crystal DiskMark
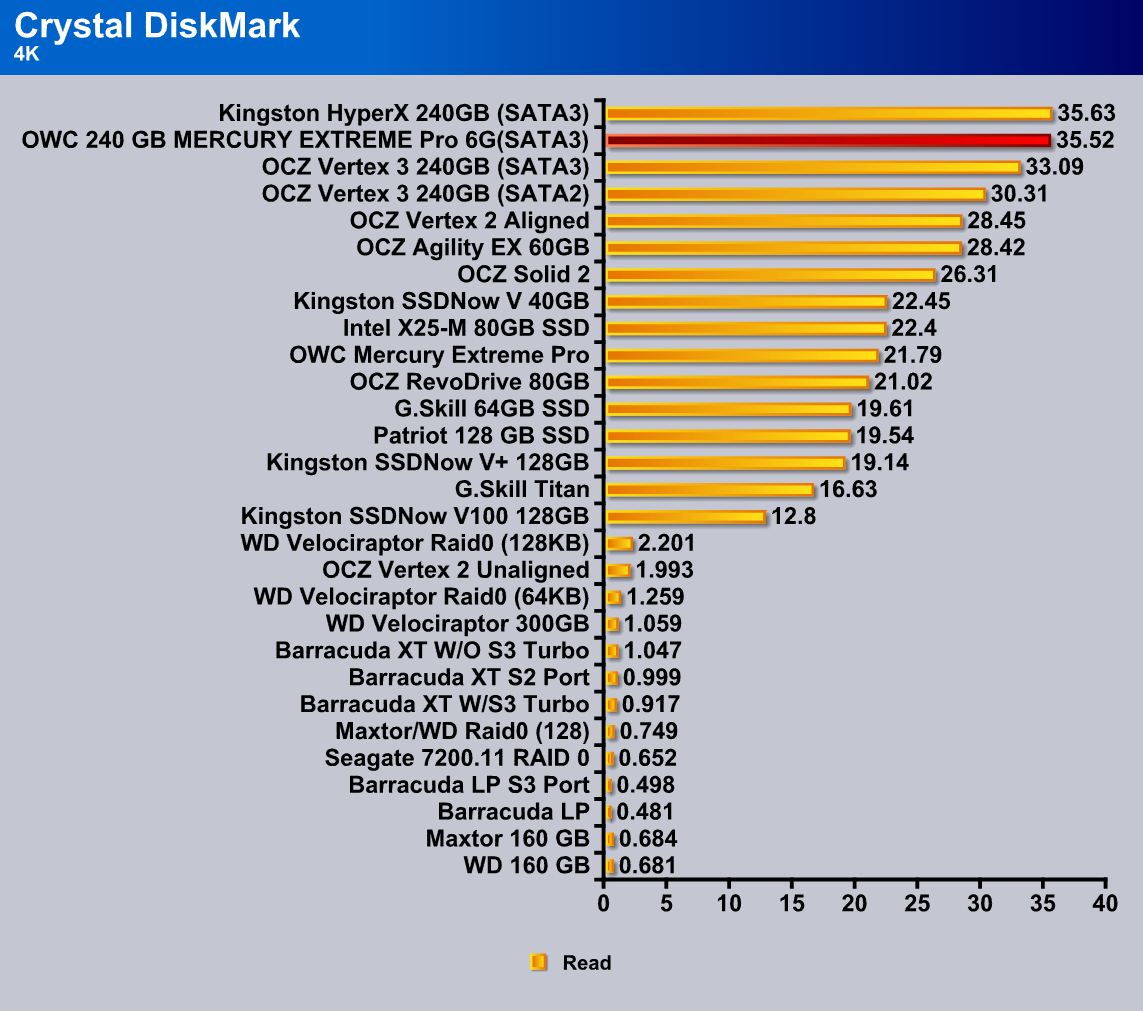
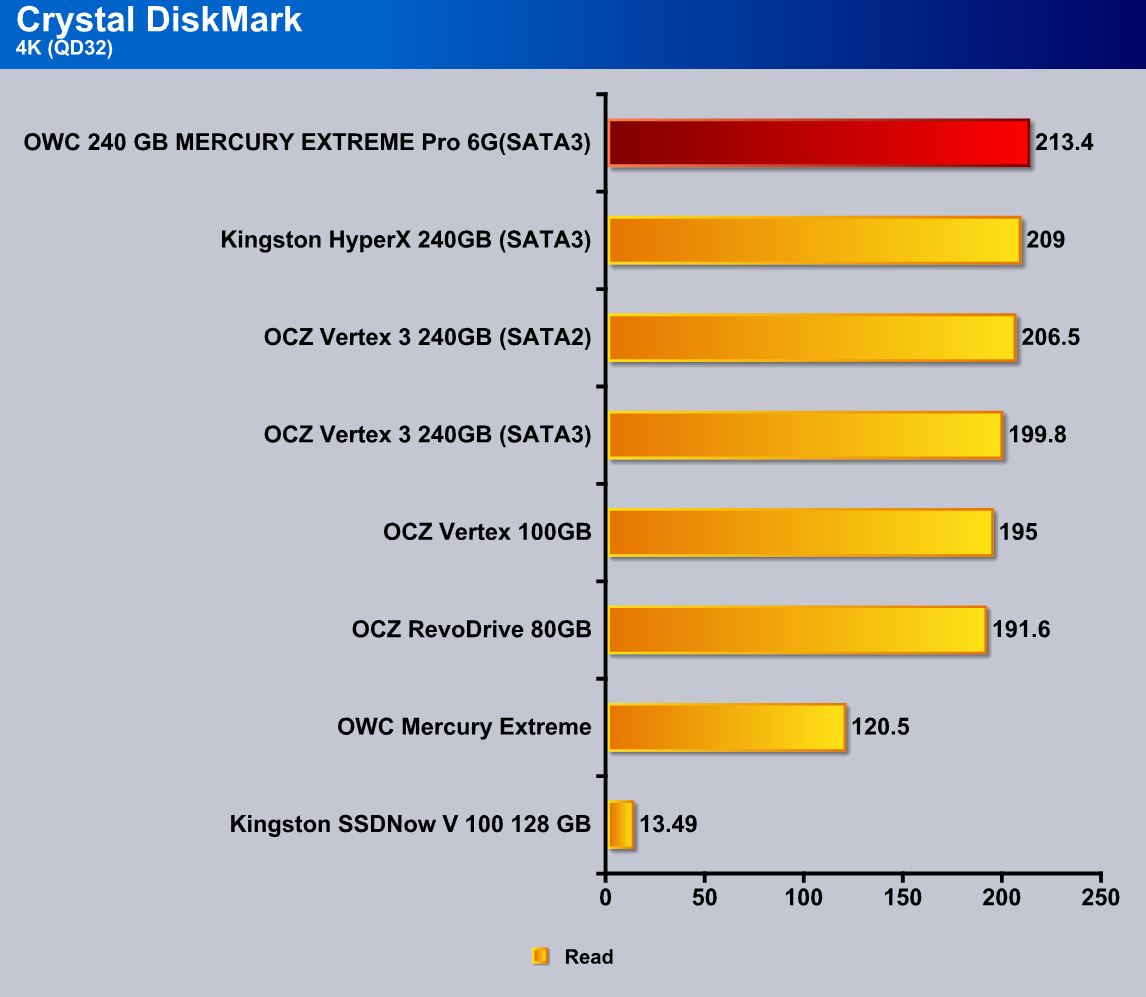
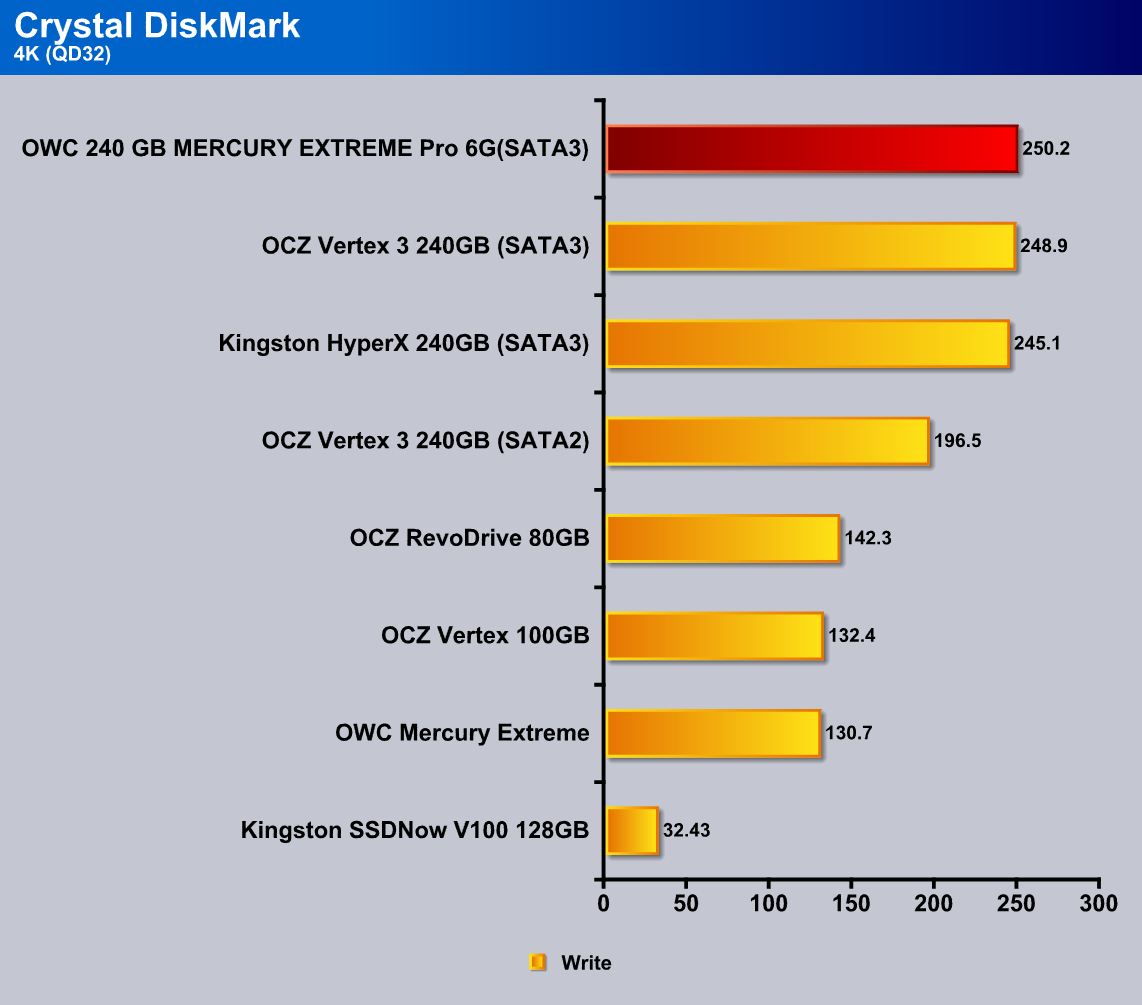
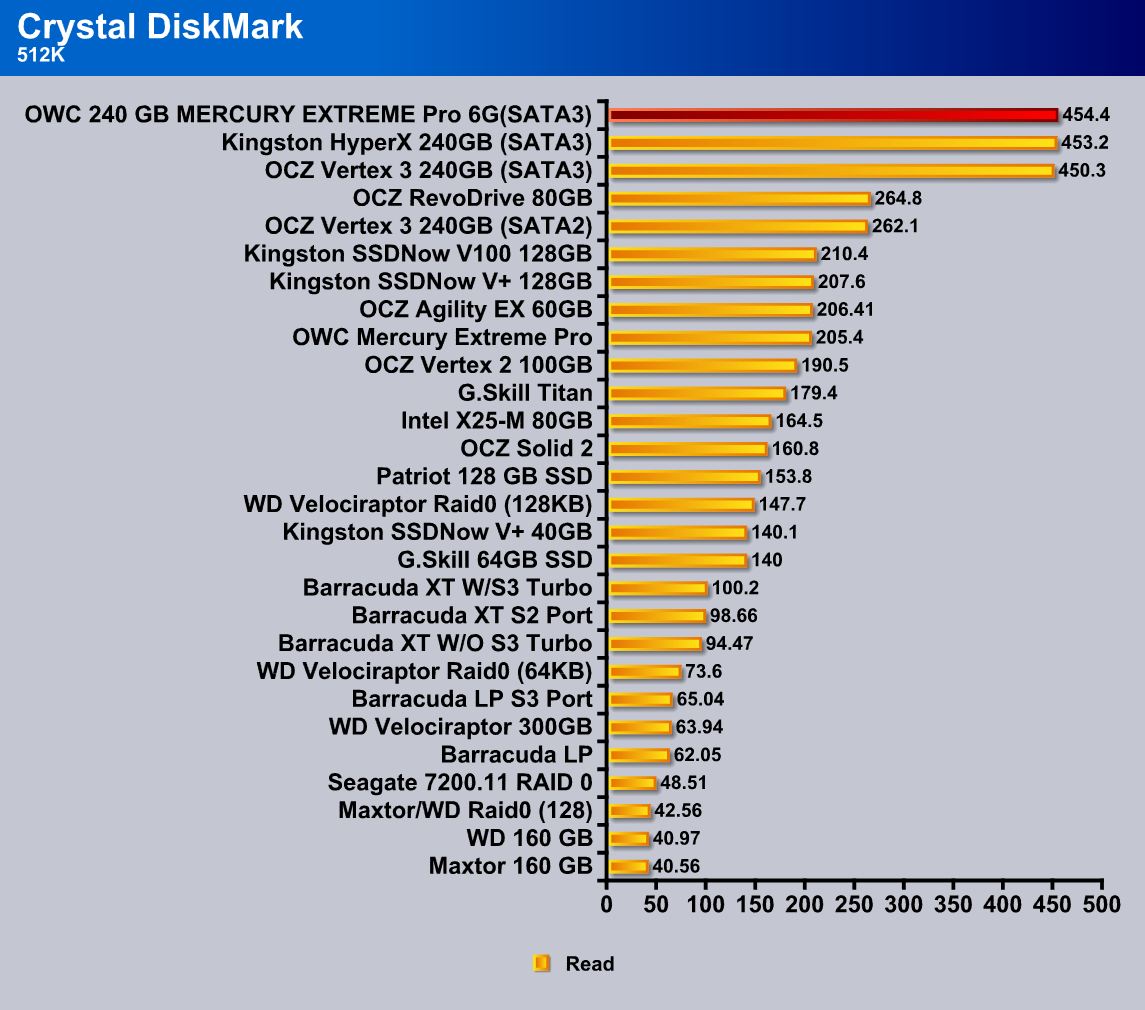
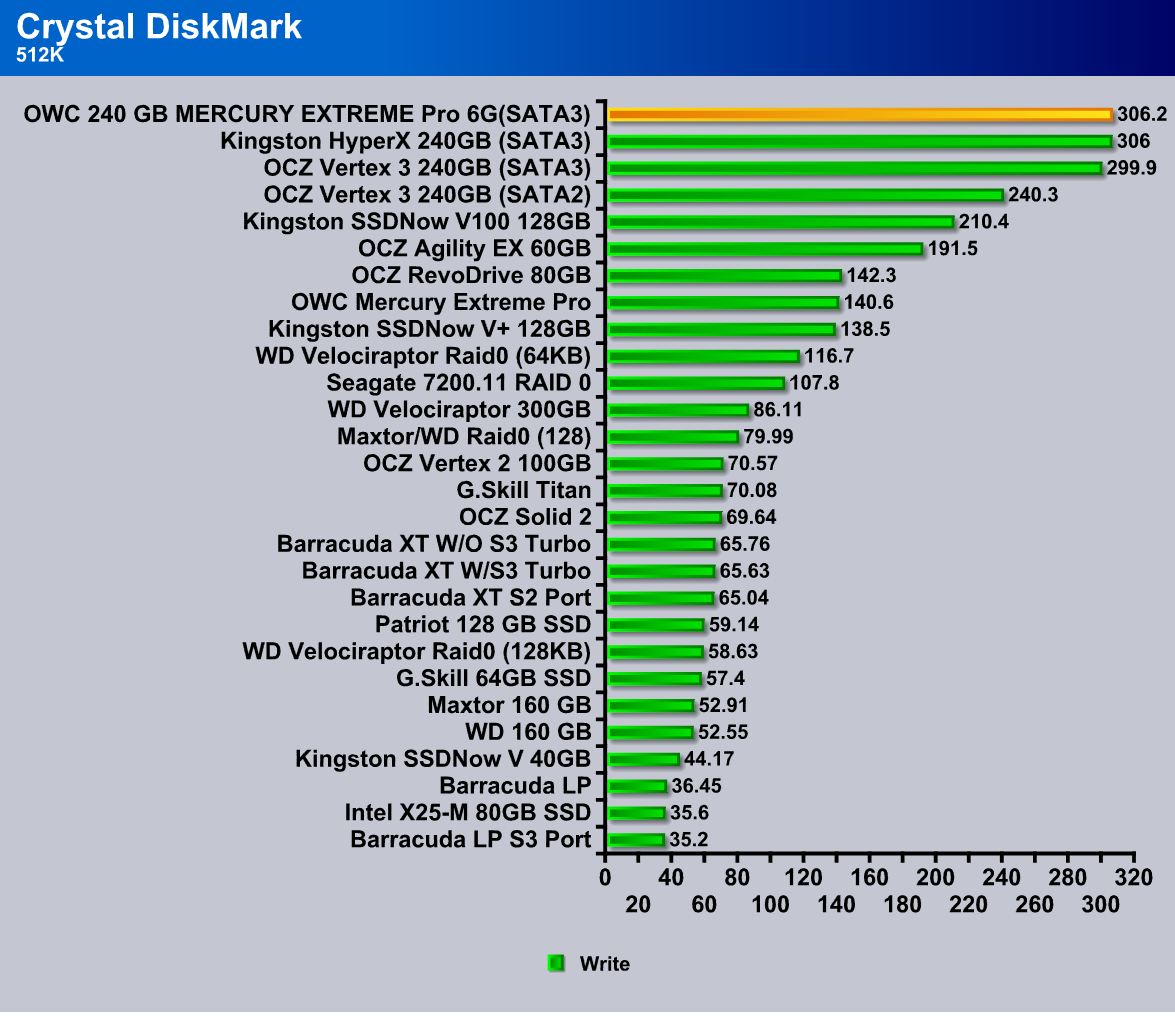
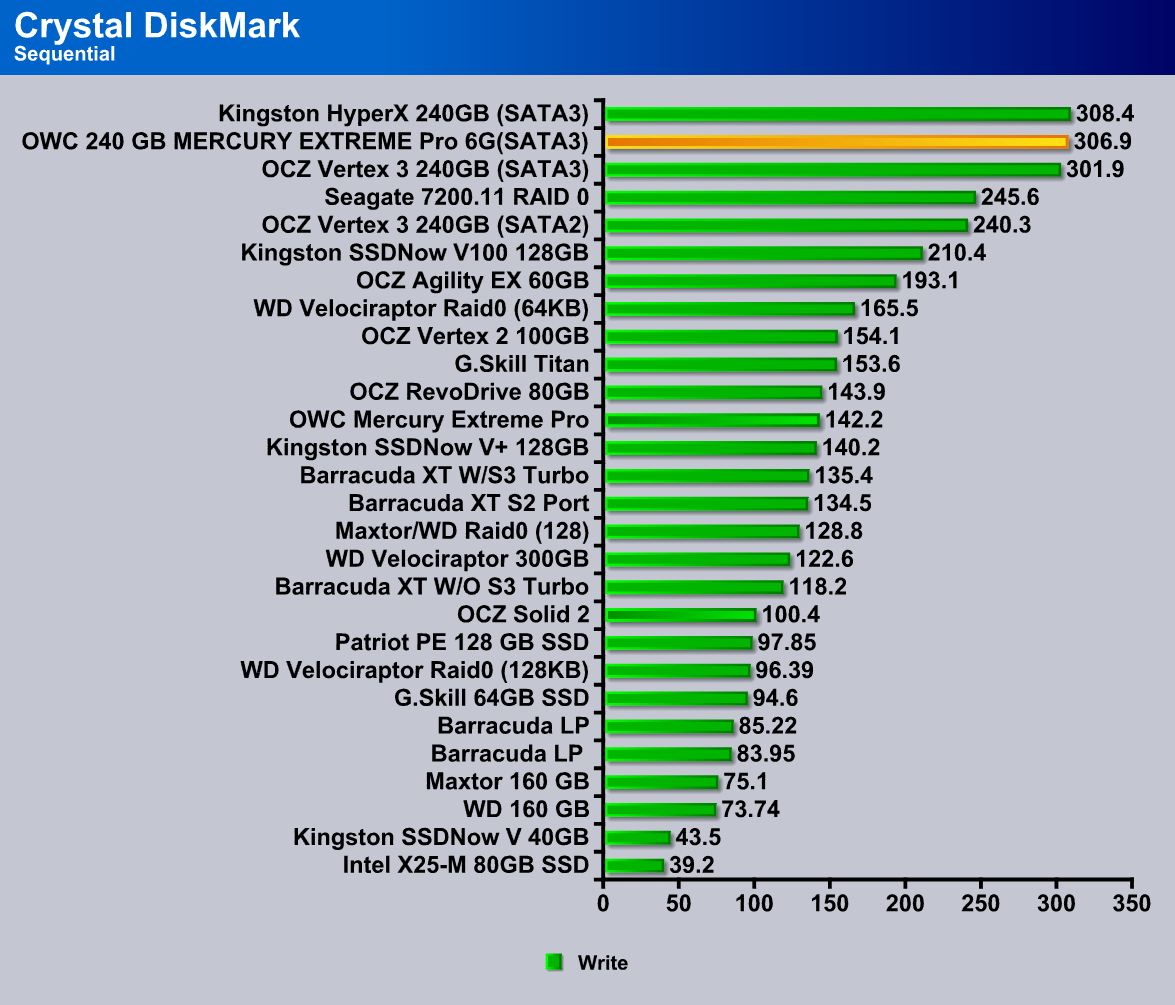
We have so far only tested Read performance. With CrystalDiskMark we take a look at the performance we can get out of the OWC Mercury EXTREME Pro 6G during write operations. Once again we see the same pattern for the Mercury EXTREME Pro 6G as on the previous tests. It performs between first and second place in each test. It is important to understand though that with 4K tests, it is normal to see much slower performance. Compared to single and RAID 0 based hard drives, we can see about a 10x-30x performance difference, which is amazing. This is where SSDs have a big performance increase over hard drives and that’s why reading and writing of thousands of small files is so much faster on SSDs.
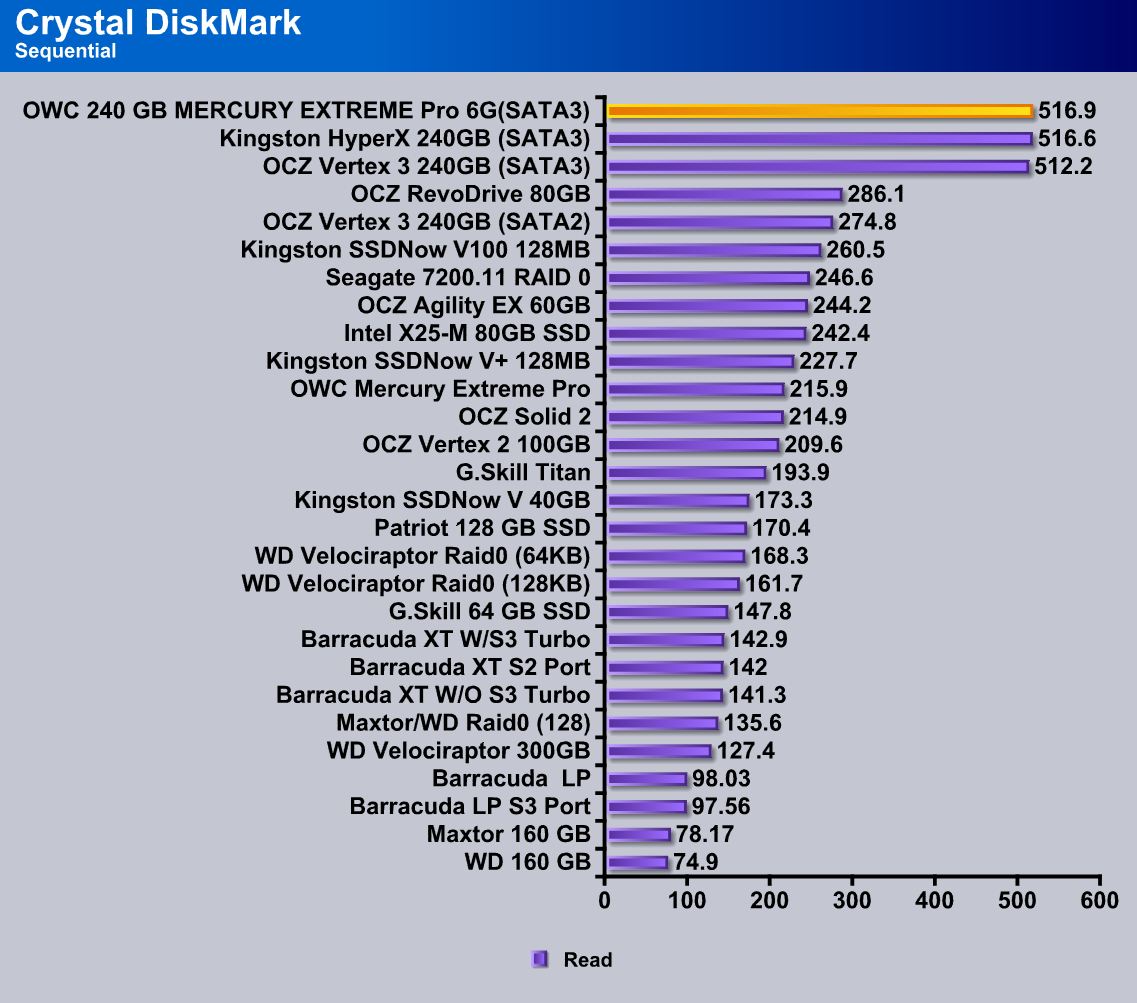
Next up we take a look at the Sequential Read and Write performance. This type of reading and writing is mainly used when working with videos and other massive files. For read, the OWC Mercury EXTREME Pro 6G SSD managed a crazy 516.9MB/s throughput which is multiple times the amount of throughput a Full HD video requires (35MB/s). This means that even a 4K video recorded at YUV 4:2:2 color model at 24FPS and 12-bits/color would require about 2.55Gbps or about 318.5MB/s maximum throughput. This means that having a system with one of the OWC Mercury EXTREME Pro 6G SSD would easily allow a person working with 4K footage to playback the videos without any lags, unless other parts of their system would be bottlenecking the playback. At 517MB/s the up to 5K resolution video could be used at a 4:2:2 and 12bits/color compression. Add another SSD for RAID0, and the performance would almost double.
ASS SSD Benchmark
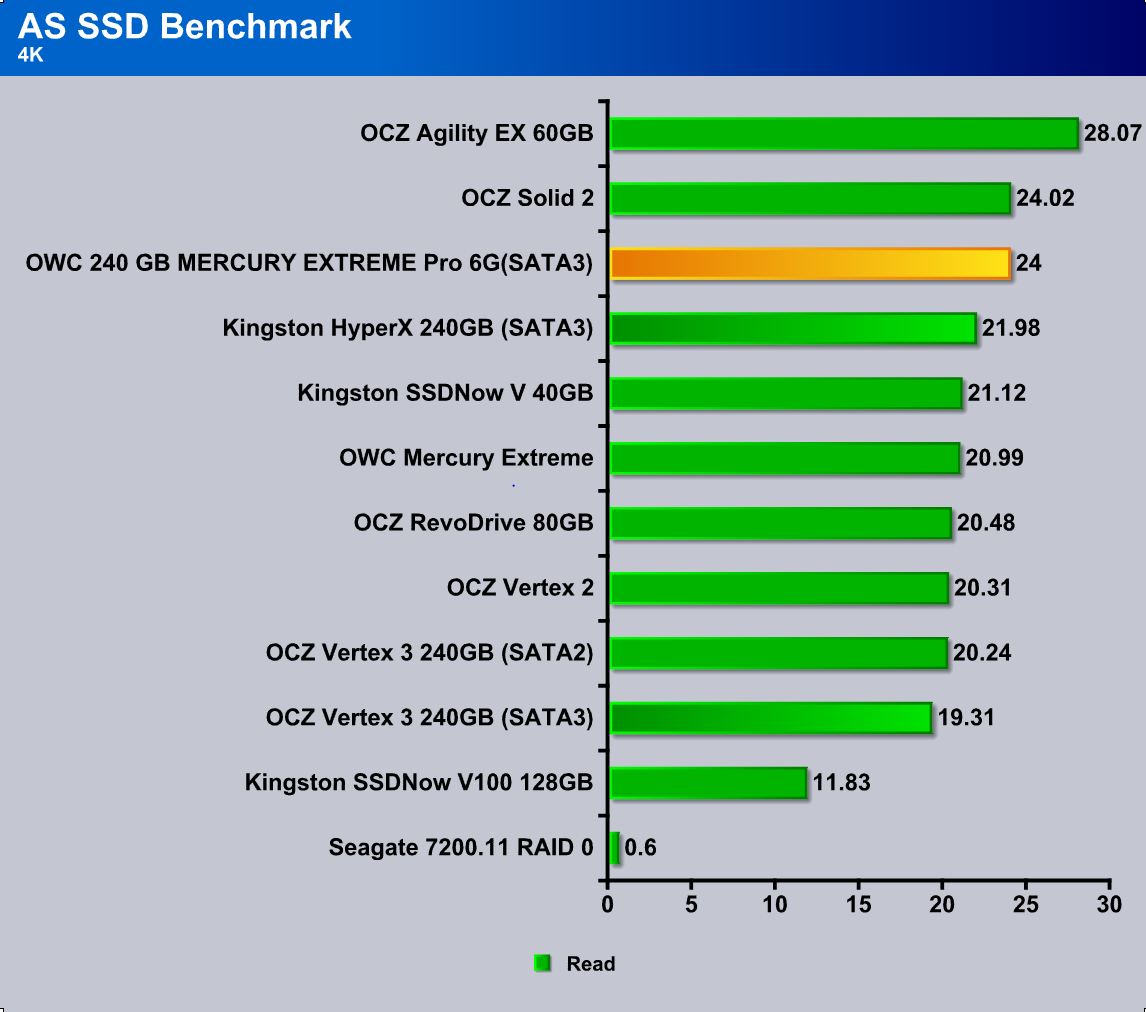
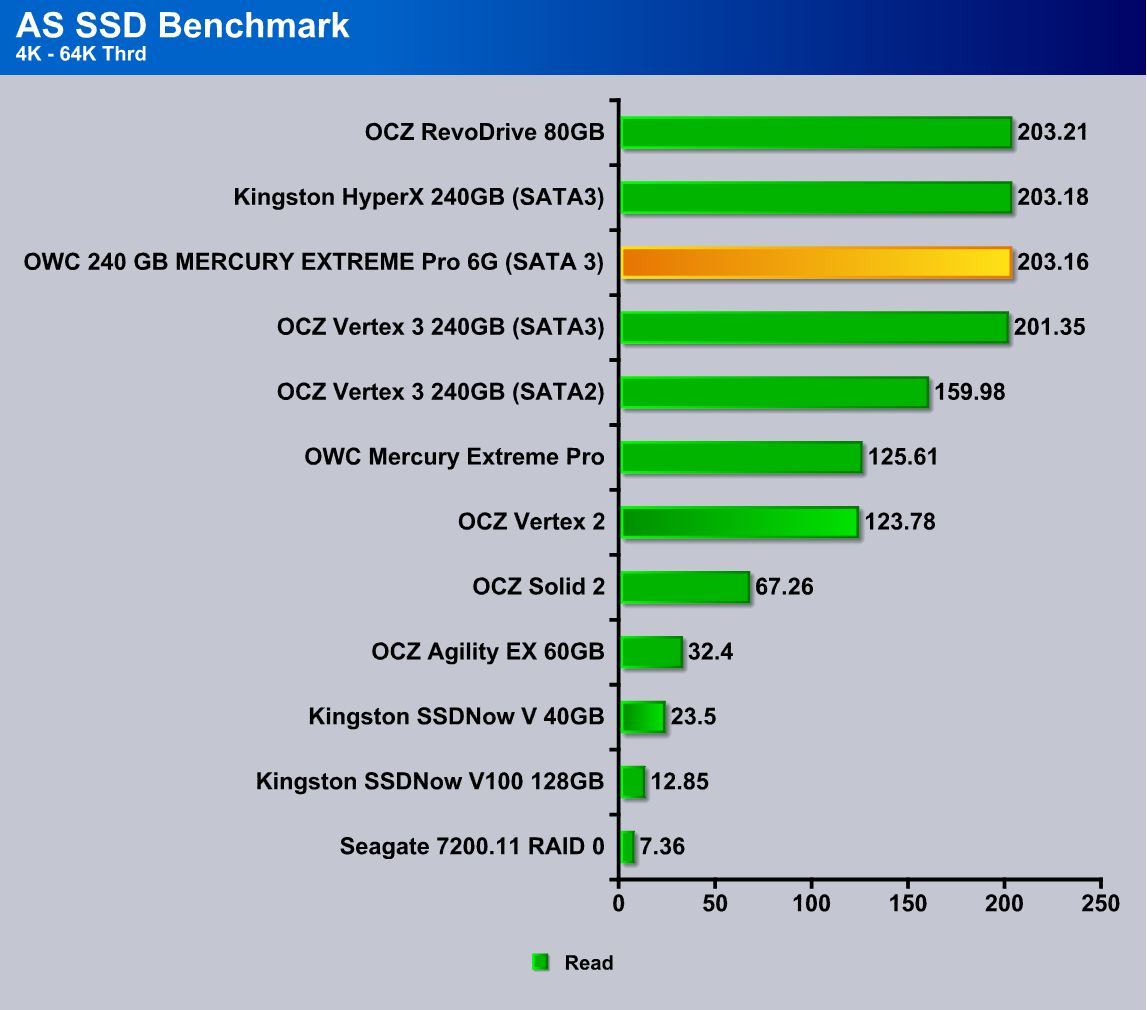
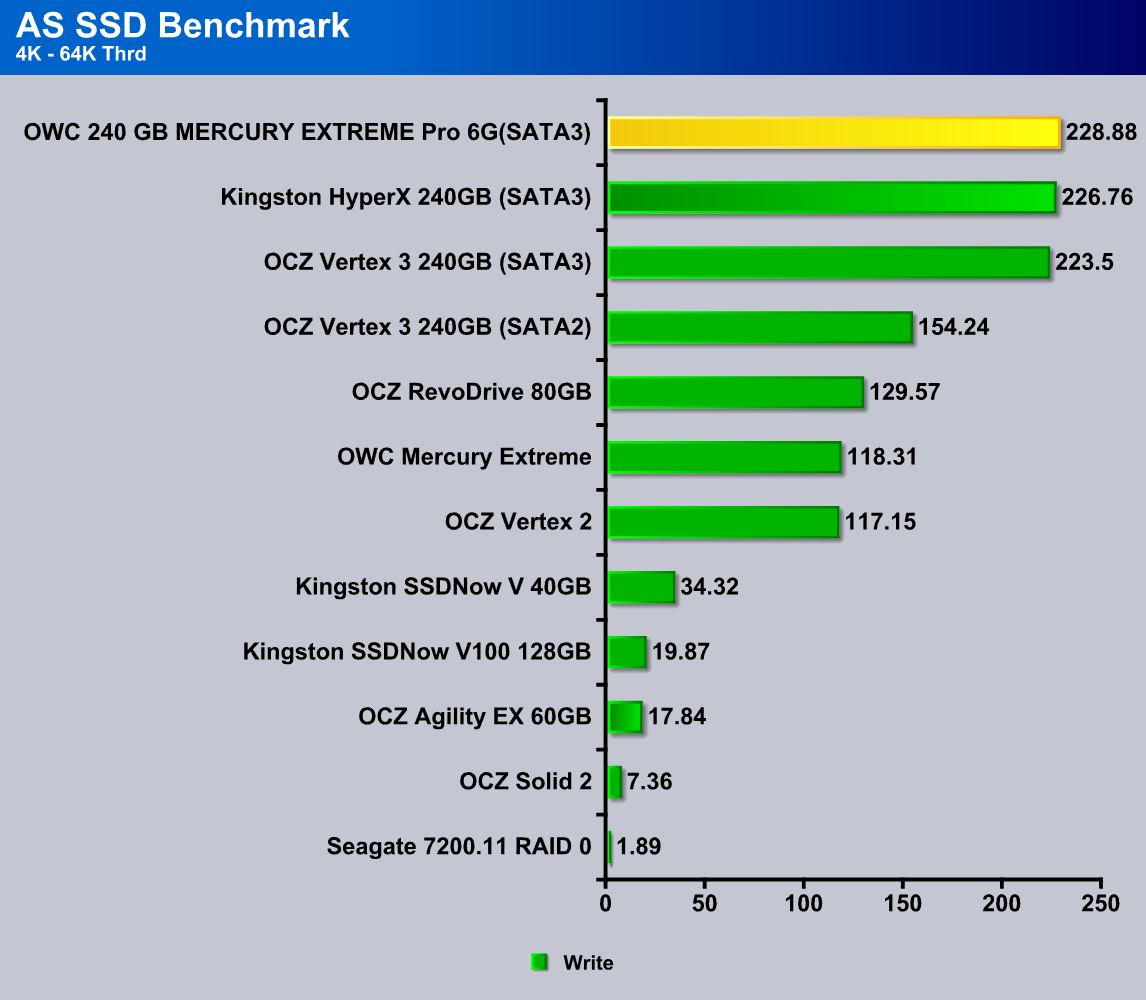
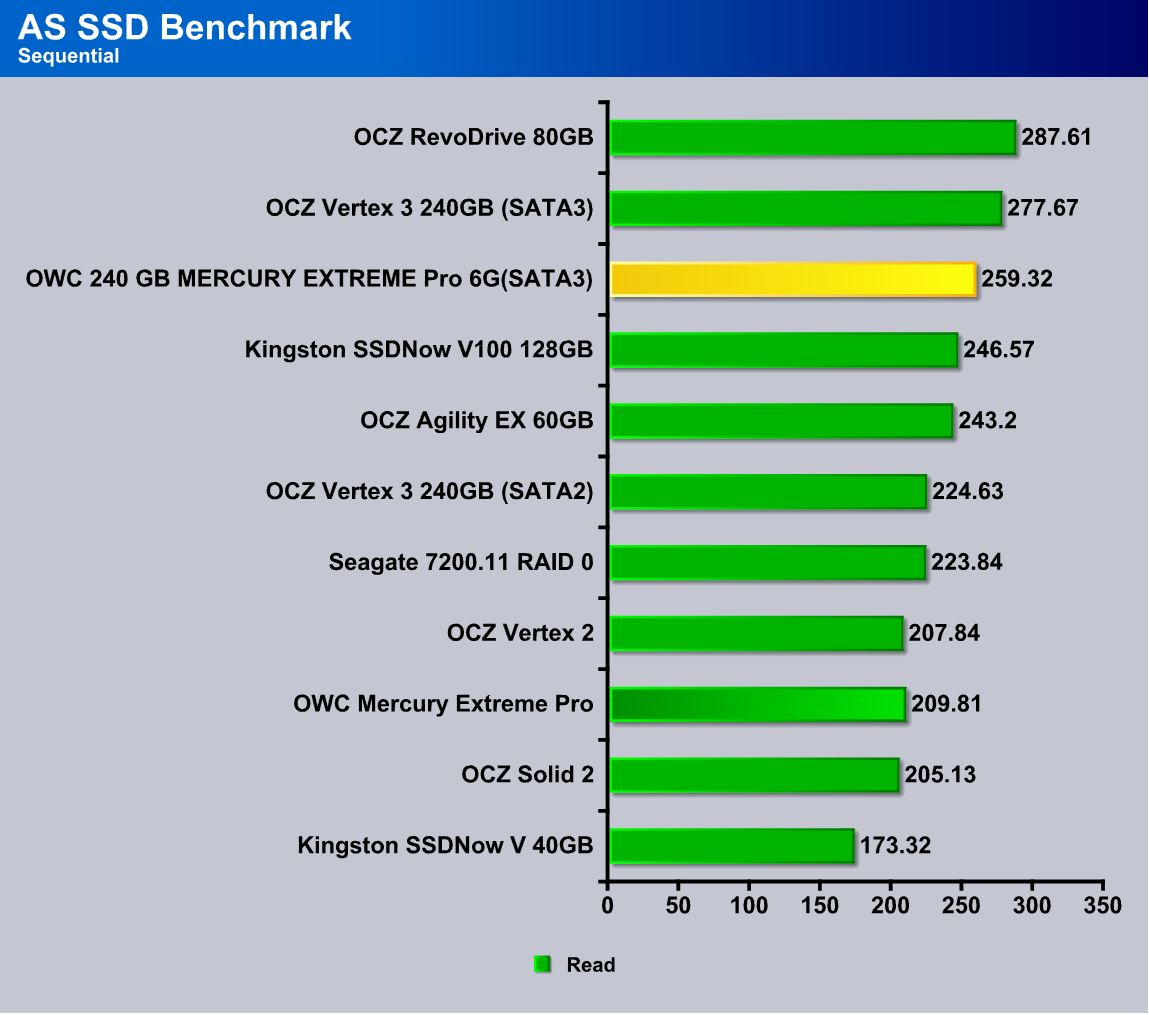
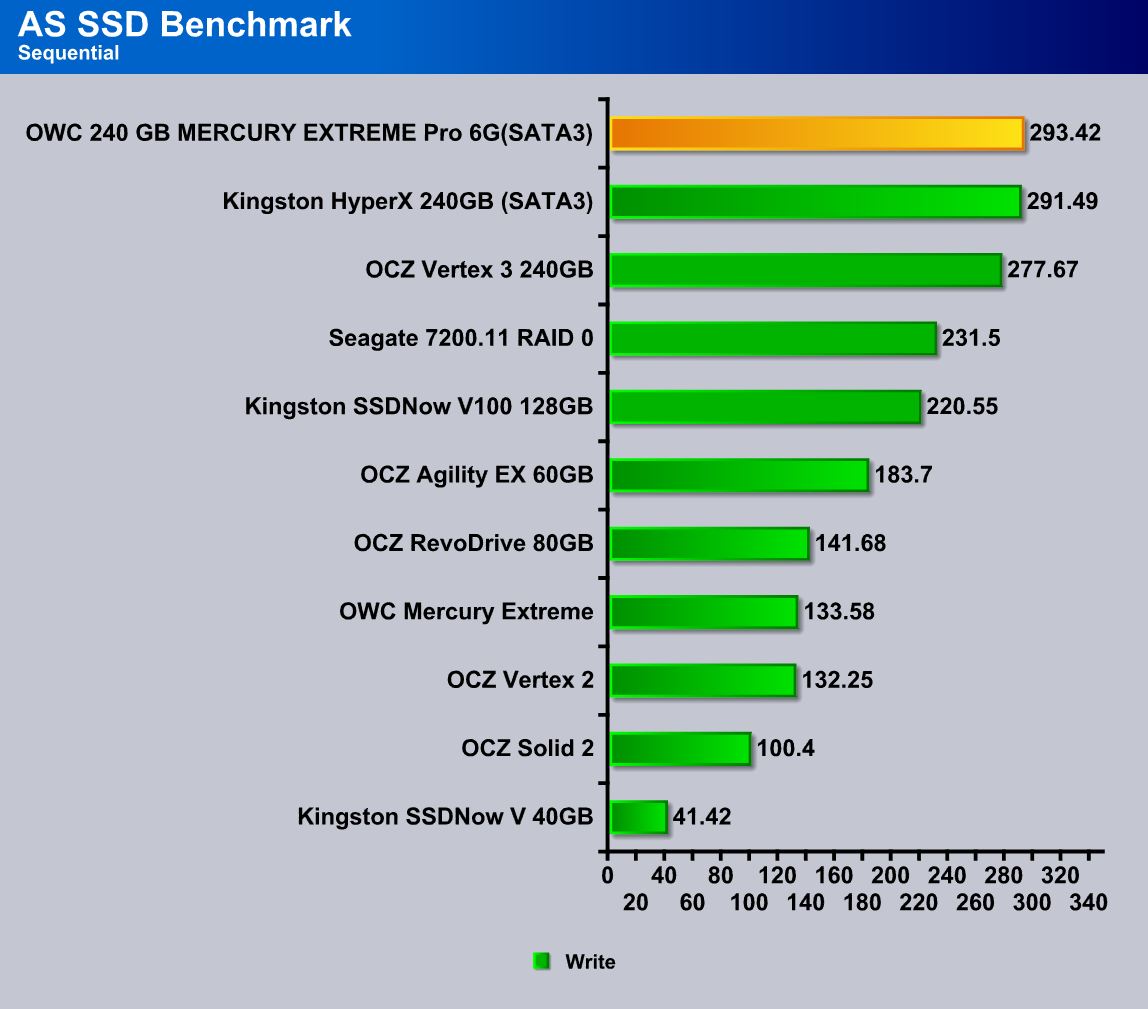
There are a few interesting points to take a look at in these results. As we’ve seen previously the OWC performs exceptionally well, but AS SSD reported a much lower number for Sequential Read performance than what we were expecting. The OCZ Vertex 3 is about at the same performance as the Kingston HyperX SSD, however, the OWC Mercury EXTREME Pro 6G fell almost 20MB/s short from the Vertex 3. On the other hand, for the 4K read resutls, the OWC SSD performed way better than the Kingston HyperX SSD.
OS X Lion Boot Time
As we can see from the video, the upgrade from a standard 7200RPM Hard Drive to a 6Gb/s SandForce SF-2282 controller SSD shows a tremendous performance increase. Users that have the 5600RPM hard drives would most likely have a slower booting time as well. The clear conclusion from this video is that if you want to have a fast booting time and fast application loading time, get an SSD for your system. SATA II SSDs running the older SandForce SF-1xxx series controllers will be slightly slower than the SF-2xxx series controllers, but they should still be way faster than a traditional hard drive.
Speedtools Utilities 3 Pro
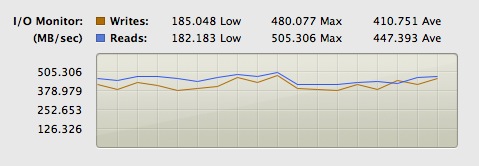
We used the Test Data Transfer Integrity tool to measure Read and Write throughput. This feature benchmarks the storage device in a MacBook Pro for its ability to reliably and repeatedly read and write precise data patterns. After running the benchmark for 10 minutes, the minimum performance we got were 185.048MB/s for write and 182.183MB/s for read. On the other hand, the maximum performance we reached was 480.077MB/s write speed and 505.306MB/s read speed. Average write and read performance was between 410MB-450MB/s
AJA System Test
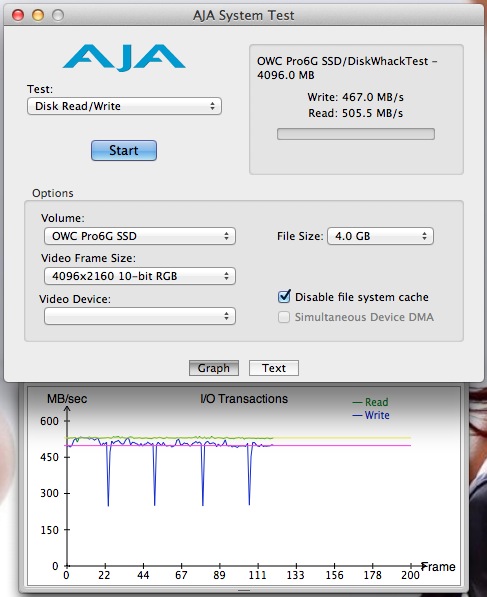
AJA System Test showed spot on results for the Read speed compared to the SpeedTools Utilities 3 Pro tool. The Write speed was slightly slower then what we saw on SpeedTools, but still very nice results of 467.0MB/s AJA System Test helps us take a look at performance we can reach with different video formats. In our case, we were testing 4K video resolution with 10bits/color RGB compression, and a video file size of 4GB. We have also disabled the file system cache option, which prevents the cache from interfering with our results.
 Bjorn3D.com Bjorn3d.com – Satisfying Your Daily Tech Cravings Since 1996






Dear all ,
this is wily from saudi arabia , and i do need your help … i do like to upgrade my macbook pro 13-inch, Late 2011,
i do looking to have an idea what part that i might need to upgrade my mac , and how much it will coast me . your immediate replay will be highly appreciated , thank you all for support
regards
wily