TESTING & METHODOLOGY
To test the drive, we cloned our test rig drive to the SSD. It is the same test drive we’ve been using on all of our drive testing and is nothing more than a clean Windows load with all the drive testing software installed, as well as all the current drivers and patches for the OS. It’s the equivalent of doing a fresh load of OS from the disc but takes a lot less time and ensures that every drive tested uses exactly the same OS load and drivers. Nothing that may effect the outcome of the testing procedure can creep in. We ran all of the tests a total of 3 times and averaged those results. The Average of the three results are presented here. In the case of a pictorial benchmark we ran the bench 3 times and picked the median result. As with most SSD testing differences from run to run are minimal and the median result is a good indication of what you can expect from the drive. We ran our usual battery of tests on the drive, and used it as the primary boot drive during testing. All of the drives tested were used as the primary boot drive during testing. That’s a more realistic test than strapping the drive in and testing it with a bare format or as a non-boot drive and it represents real life transfer rates, much like you can expect when you install and operate the drive in your own system. Each test was performed 3 times and the average of the 3 test run is reported here.
Test Setup
| Test Setup | |
| Case Type | None |
| CPU | Intel Core i7 3770K |
| Motherboard | Gigabyte GA-Z77-UD3H |
| Ram | Kingston HyperX 1600 |
| CPU Cooler | Prolimatech Megahalem |
| Storage Drives |
|
| Optical | None |
| GPU | PNY GTX 670 |
| Case Fans | 120mm Fan cooling the mosfet CPU area |
| Docking Stations | None |
| Testing PSU | Cooler Master UCP 900W |
| Legacy | None |
| Mouse | Microsoft Intellimouse |
| Keyboard | Logitech Keyboard |
| Gaming Ear Buds | None |
| Speakers | None |
RESULTS
IOMETER
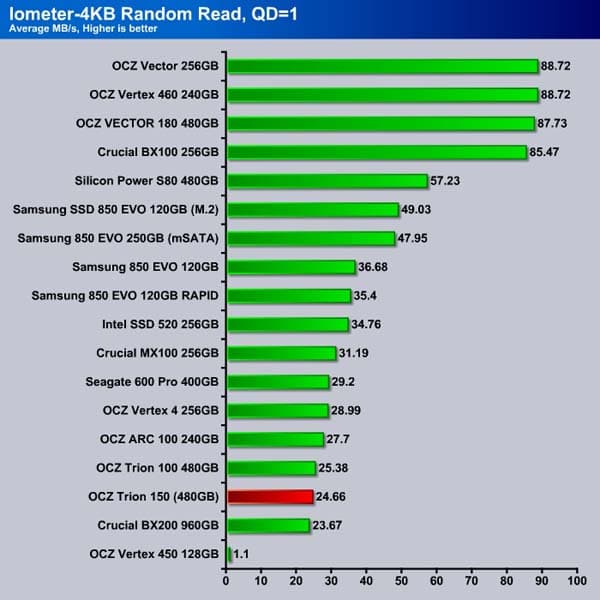
We start off with the Iometer result. The Trion 150 has a poor start with a relatively low random read performance here. At queue depth of 1, the drive just barely beats out the Crucial BX200 and is slower than the Trion 100 that it is replacing.
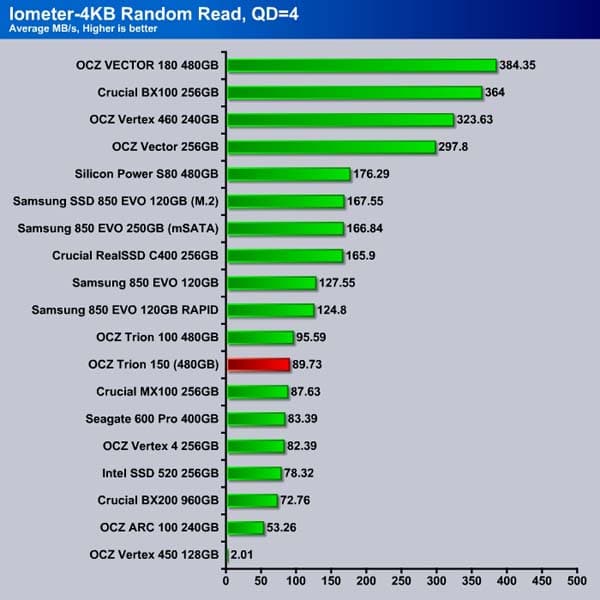
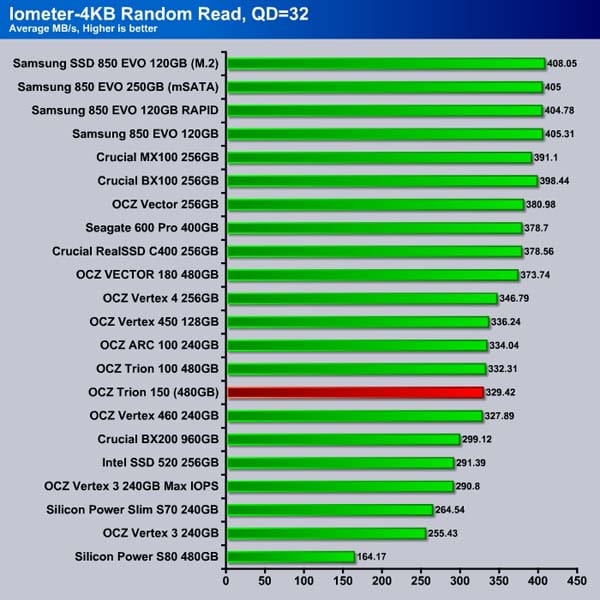
Luckily at typical desktop workloads of queue depth of 4, the drive is much more competitive against other mid-range drives. Here we can see the Trion 150 is still trailing behind the Trion 100, but it is faster than the Crucial BX200, and is about as fast as last year’s budget drive, the Crucial MX100. The higher queue depth of 32 unfortunately is not the Trion 150’s strength, as it is trailing behind the competiton.
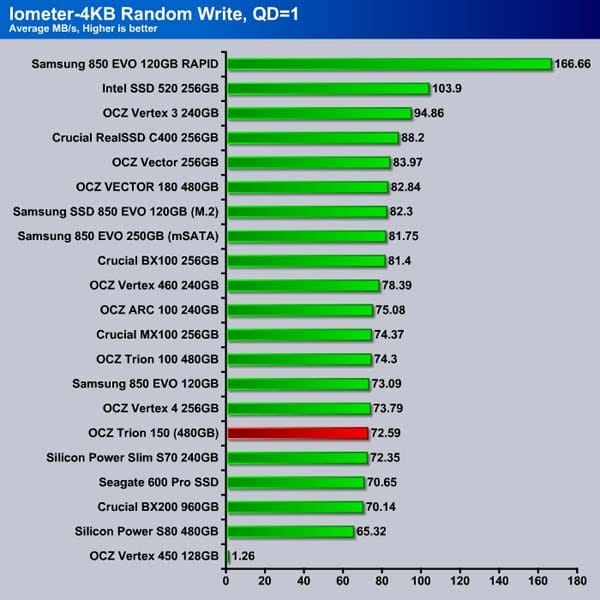
At queue depth of 1, the random write for the Trion 150 performance again is lagging behind the Trion 100. However, its performance is not terribly bad.
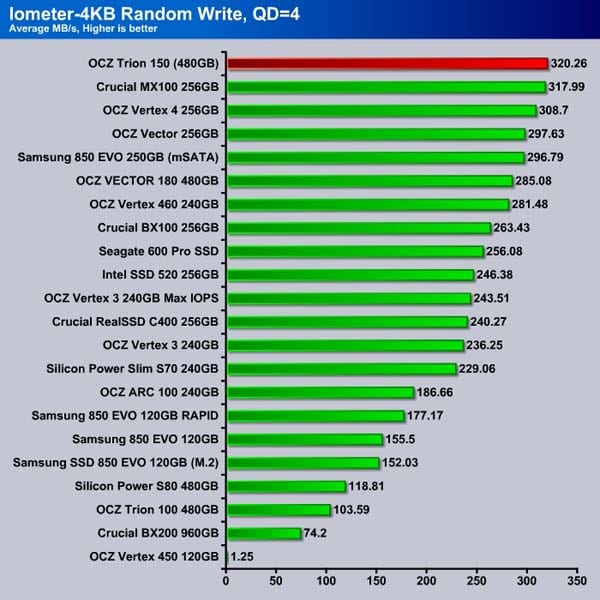
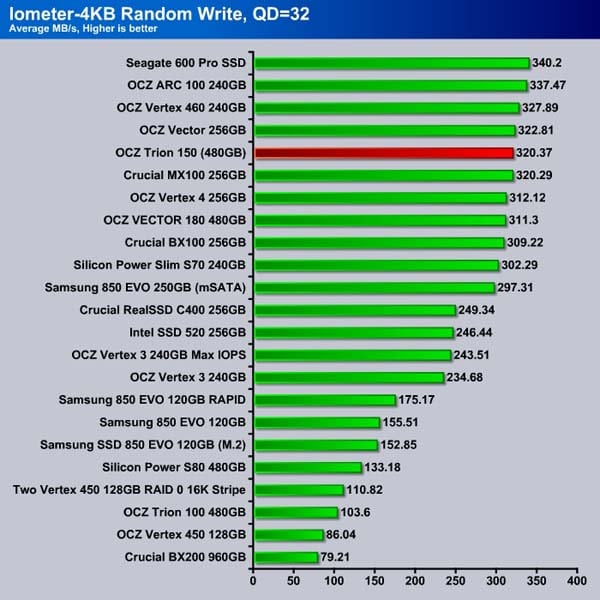
Luckily, the drive’s performance under typical desktop workloads of queue depth of 4 is quite good the Trion 150 showing much promising result. The drive is clearly much better than the Trion 100 with 320 MB/s transfer rate. Notice that the drive even manages to out-performs the Samsung 850 EVO when we take out the Samsung’s Turbo Write to help caching the data. The Trion 150 manages to offer respectable performance at queue depth of 32. While not on the top of the chart, it is nonetheless delivering great performance that is even able to compete against enthusiast drives.
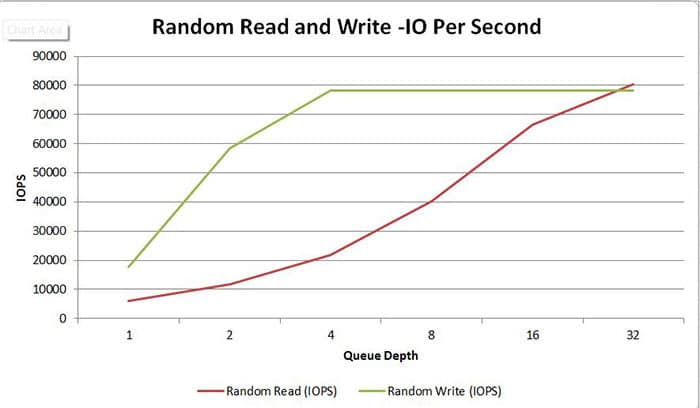
Let’s take a look at how the drive performs as the queue depth scales up. The random read scales quite well where the drive reached about 80K at queue depth of 32. The write speed is able to reach its maximum of 66K IOPS at around queue depth of 4, thanks to the fact that the drive essentially has maximized all available channels.
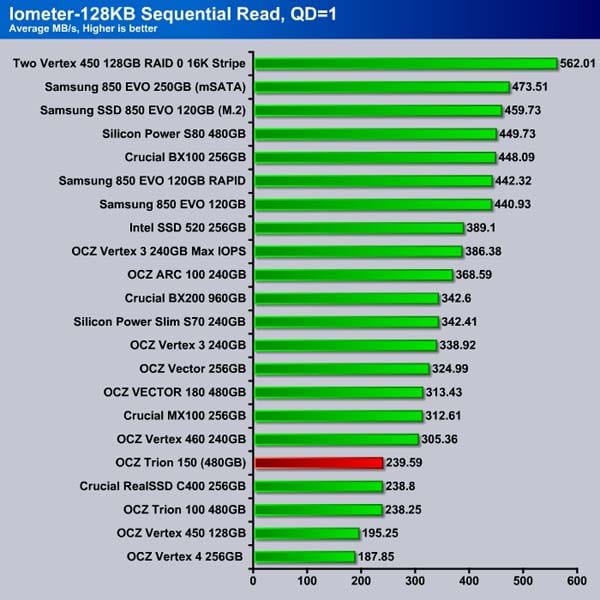
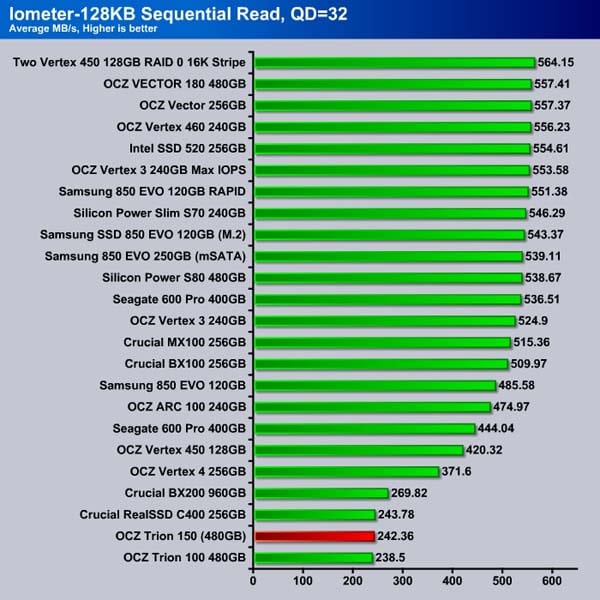
The sequential read for the Trion 150 is on par with the Trion 100. It is not as fast as the current crops of the performance drive, but it is nonetheless fast enough compared to enthusiast drives that were released a couple of years ago, such as the Vertex 4. Interestingly enough, the drive seems to deliver the same performance even at a higher queue depth.
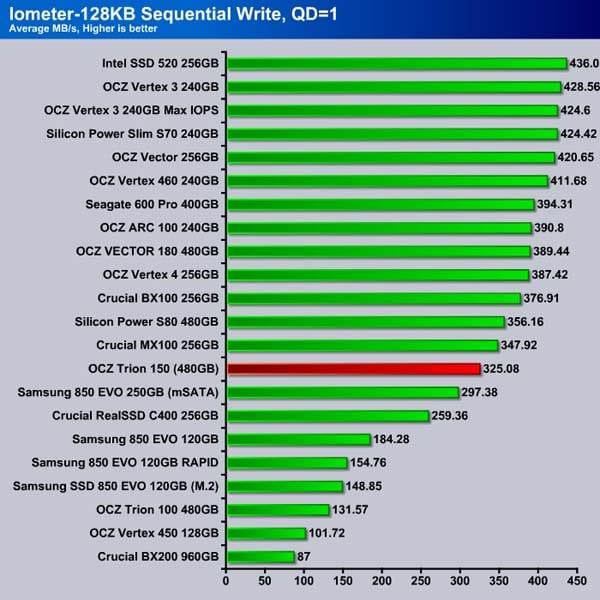
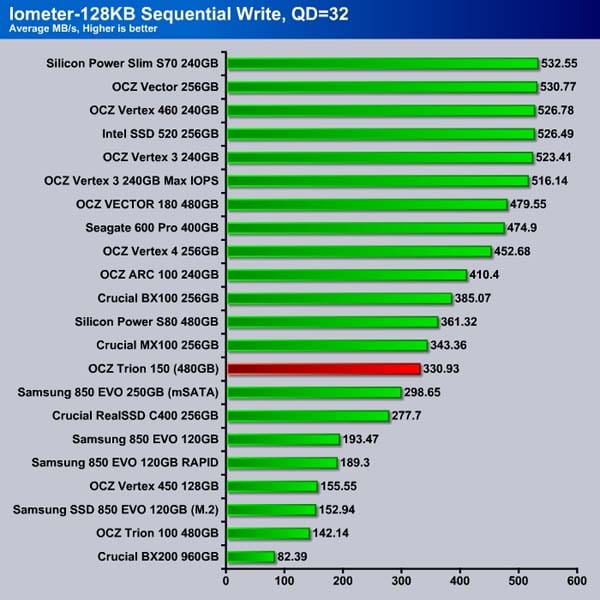
The sequential write for the Trion 150 is in the middle of the pack. However, compared to the Trion 100, we can see a huge improvement in performance. Here we can see that the drive is more than two times faster than the Trion 100. This makes the drive more competitive among other mid-range drives than the Trion 100 was. Much like the sequential read, the sequential write performance shows no difference between queue depth of 1 or 32.
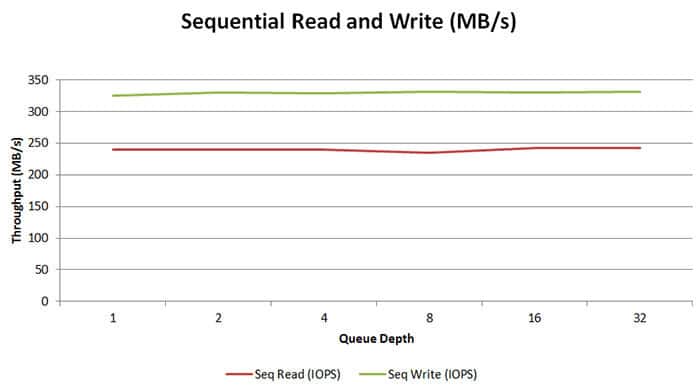
The sequential read and write performance does not alter much with the number of queue depth. This is good news, as most sequential writes are often a couple of queues only, so we can expect the Trion 150 to be able to maintain a good performance here.
AS SSD
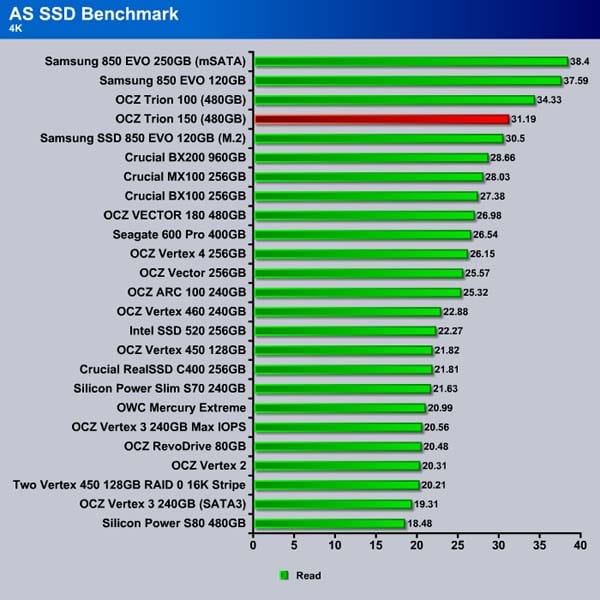
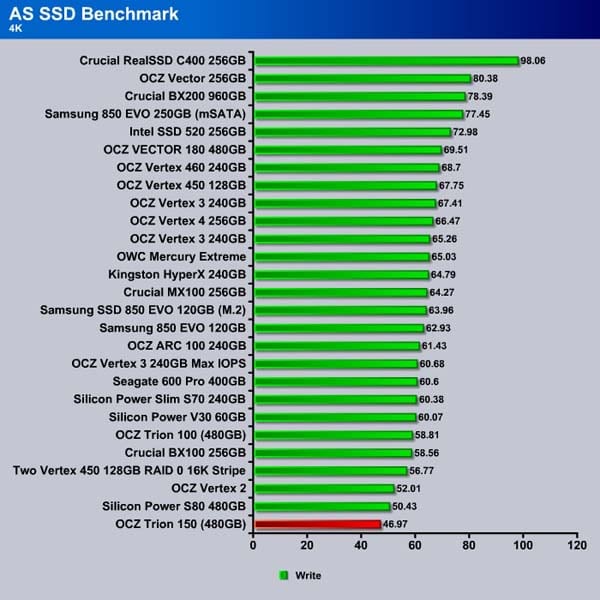
We again turn to AS SSD to assess how a drive handles incompressible data. The Trion 150 does quite well here in the random read, but unfortunately the write speed is the bottom of the chart, lagging behind even the Trion 100 by as much as 20%.
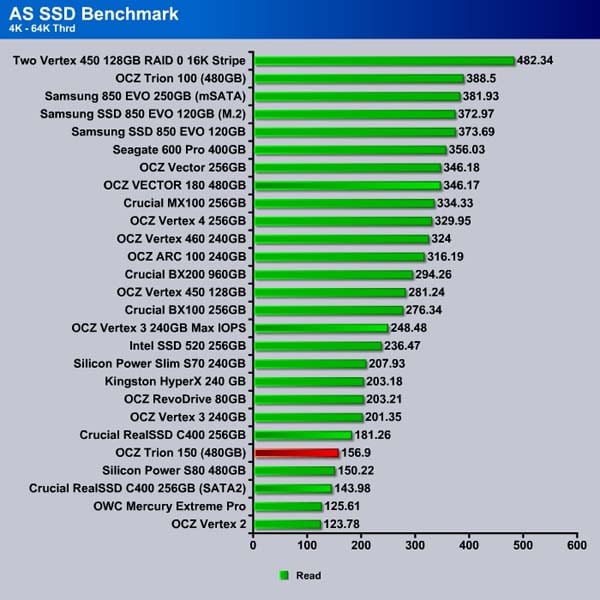
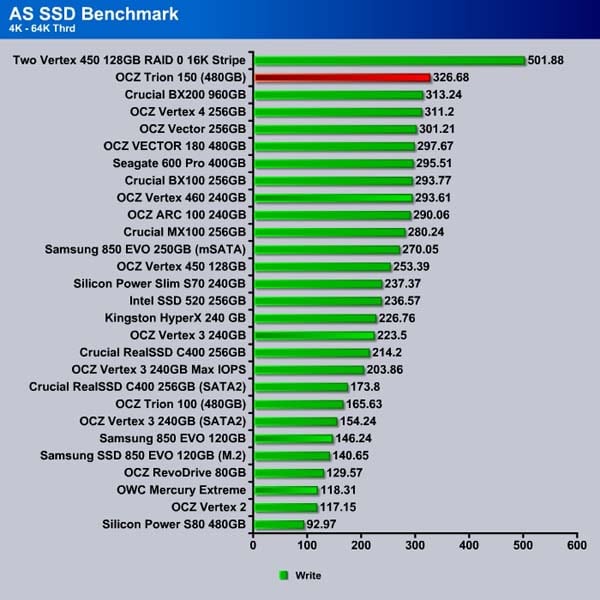
Interestingly, high thread read shows the Trion 150 is taking a slight beating and it ended up in the middle of the pack. However, the drive manages to take first place in the random write speed.
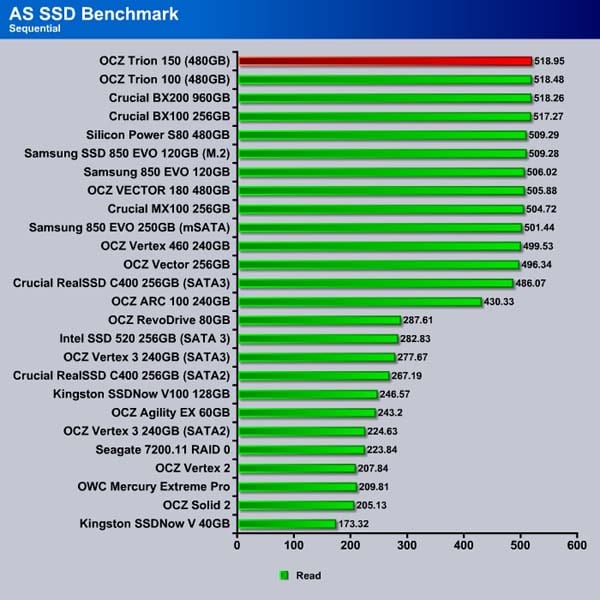
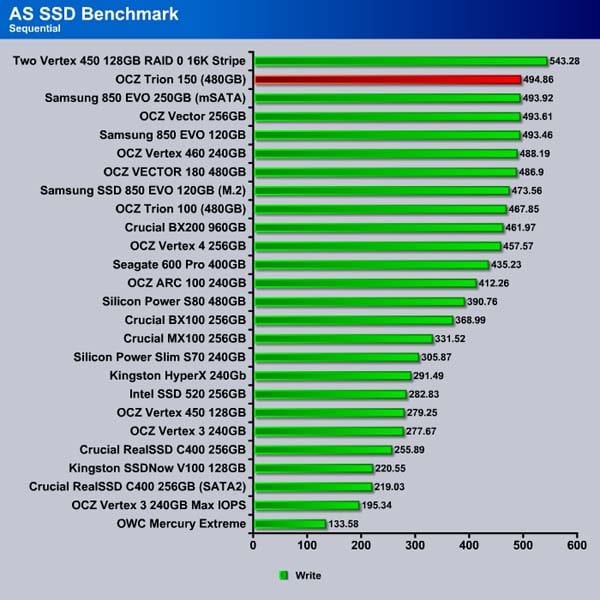
The Trion 150’s sequential read and write speed is quite impressive at 519 MB/s and 495 MB/s, respectively. Here the drive takes the top spot on both charts (not counting the striped Vertex 450s in write performance).
CrystalDiskMark
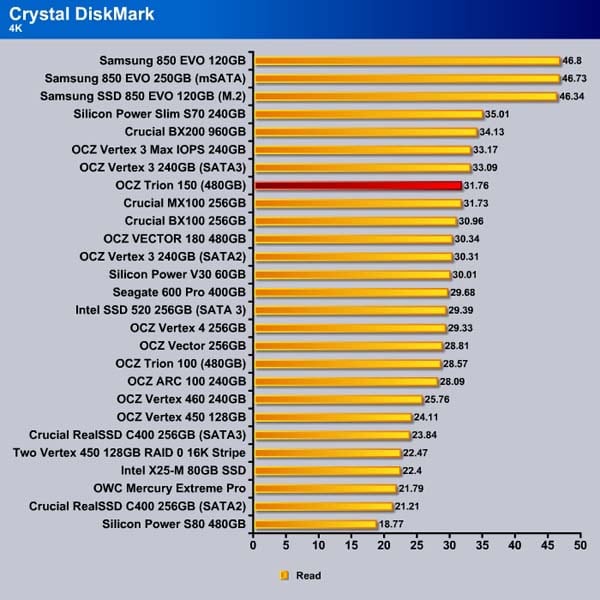
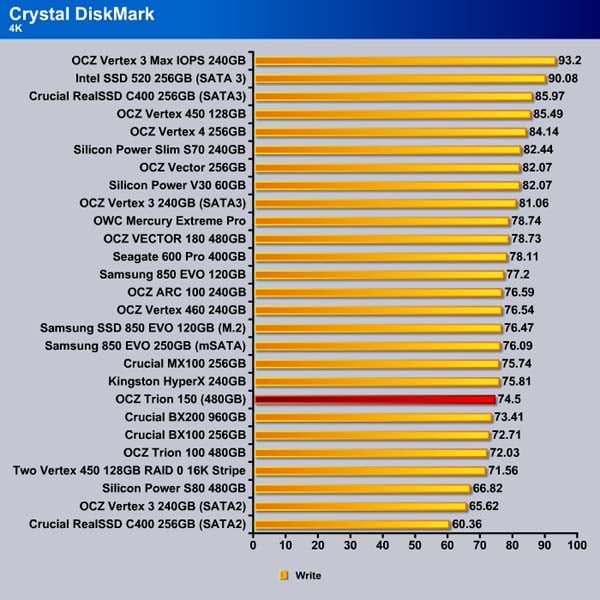
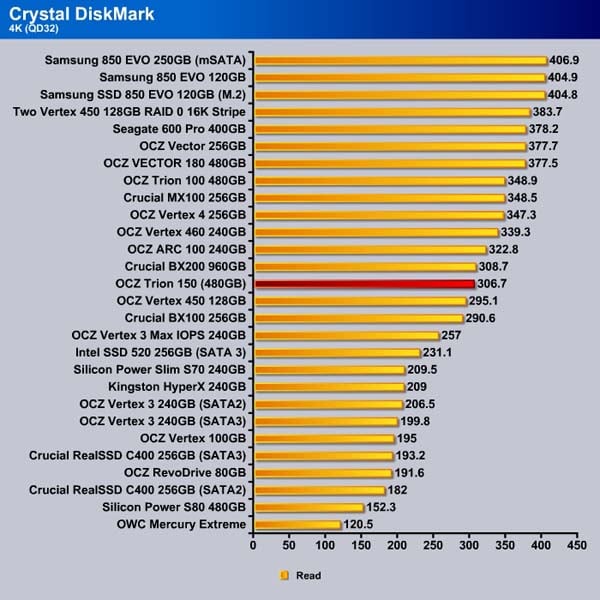
With CrystakDiskMark, the Trion 150 shows that its random read speed is faster than the Trion 100 and manages to deliver competitive performance against other drives. The random write speed, however, is about the same as the Trion 100 and lags slightly behind other mid-range drives, but it narrowly beats the Crucial BX200.
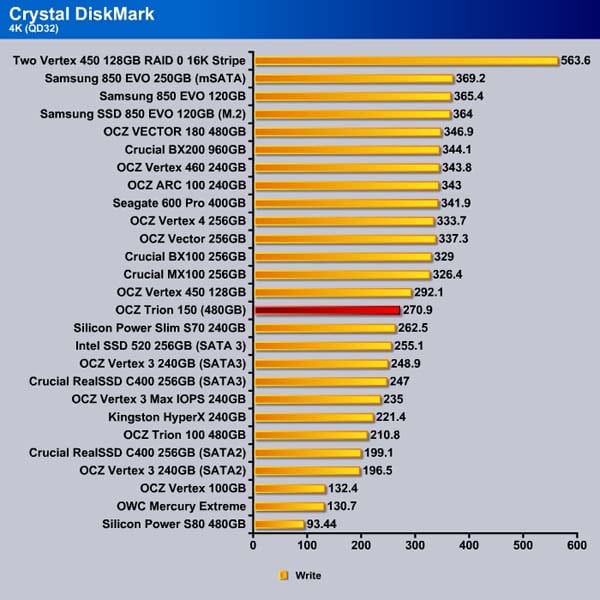
Once again, high queue depth is not the Trion 150’s strength. While it is not slow by any means, it is just not as fast as other drives and is placed in the middle of the pack. However, it is worth noting that the write performance shows quite a big improvement over the Trion 100.
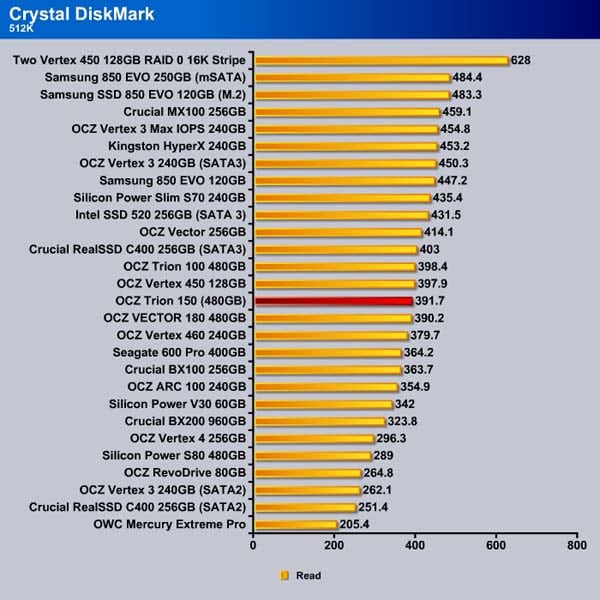
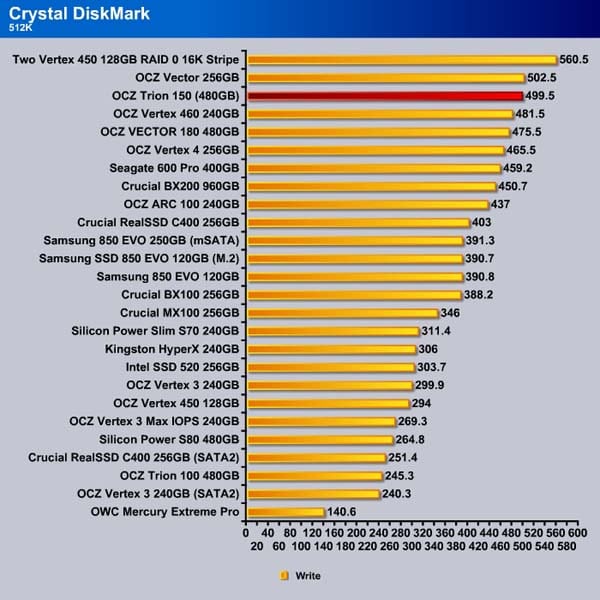
The Trion 150’s 512K read performance is in the middle of the pack but the drive excels at the write here.
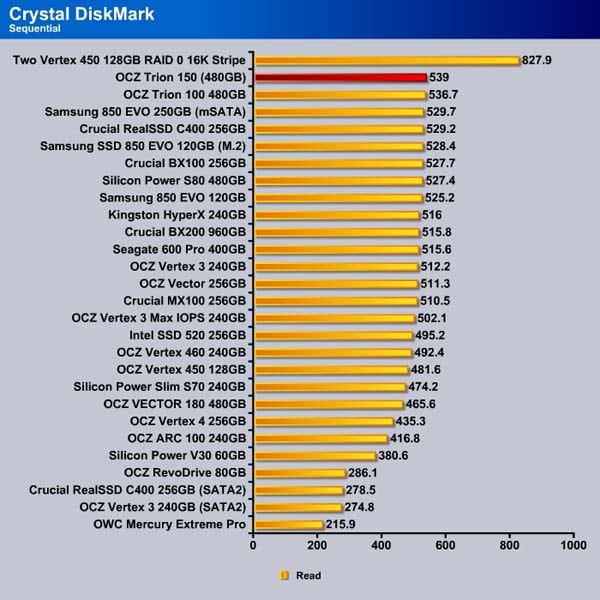
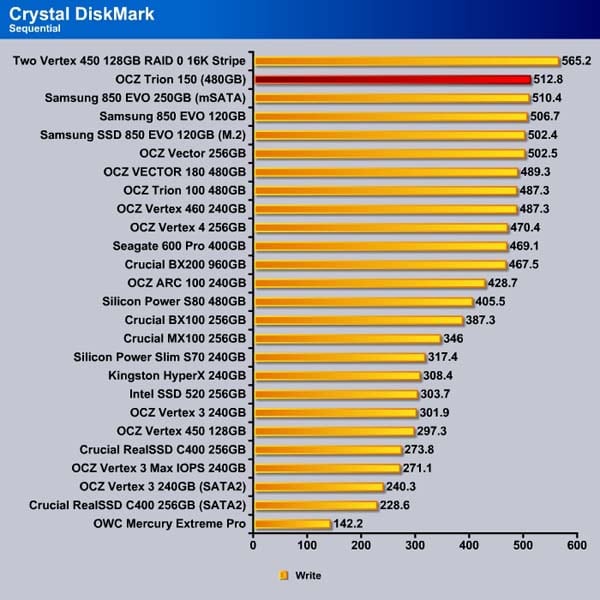
As was seen using AS SSD, the Trion 150 delivers excellent sequential read and write speed with this benchmark.