Testing Methodology
The OS we use is Windows 8 Pro 64bit with all patches and updates applied. We also use the latest drivers available for the motherboard and any devices attached to the computer. We do not disable background tasks or tweak the OS or system in any way. We turn off drive indexing and daily defragging. We also turn off Prefetch and Superfetch. This is not an attempt to produce bigger benchmark numbers. Drive indexing and defragging can interfere with testing and produce confusing numbers. If a test were to be run while a drive was being indexed or defragged, and then the same test was later run when these processes were off, the two results would be contradictory and erroneous. As we cannot control when defragging and indexing occur precisely enough to guarantee that they won’t interfere with testing, we opt to disable the features entirely.
Prefetch tries to predict what users will load the next time they boot the machine by caching the relevant files and storing them for later use. We want to learn how the program runs without any of the files being cached, and we disable it so that each test run we do not have to clear pre-fetch to get accurate numbers. Lastly we disable Superfetch. Superfetch loads often-used programs into the memory. It is one of the reasons that Windows Vista occupies so much memory. Vista fills the memory in an attempt to predict what users will load. Having one test run with files cached, and another test run with the files un-cached would result in inaccurate numbers. Again, since we can’t control its timings so precisely, it we turn it off. Because these four features can potentially interfere with benchmarking, and and are out of our control, we disable them. We do not disable anything else.
We ran each test a total of 3 times, and reported the average score from all three scores. Benchmark screenshots are of the median result. Anomalous results were discounted and the benchmarks were rerun.
Please note that due to new driver releases with performance improvements, we rebenched every card shown in the results section. The results here will be different than previous reviews due to the performance increases in drivers.
Test Rig
| Test Rig | |
| Case | Level 10 GT |
| CPUs | Intel i7 4770K @ 4.7GHz |
| Motherboards | ASUS Maximus VI Formula |
| Ram | Patriot Viper 32GB (4x8GB) 2133Mhz 11-11-11Quad-Channel Kit |
| CPU Cooler | Custom Liquid Cooling |
| Hard Drives | 8x Western Digital RE4 2TB 7200RPM 3Gb/s Hard Drives (Raid 5) |
| SSD | 3x Kingston HyperX 240GB SATA III 6Gb/s SSD |
| Optical | ASUS DVD-Burner |
| GPU |
Nvidia GeForce GTX 760 2GB Video Card Nvidia GeForce GTX 770 2GB Video Card Nvidia GeForce GTX 780 3GB Video Card Nvidia GeForce GTX 780 Ti 3GB Video Card Nvidia GeForce GTX TITAN 6GB Video Card Nvidia GeForce GTX 690 4GB Video Card AMD Radeon R9-290X 4GB Video Card AMD Radeon R9-280X 3GB Video Card AMD Radeon R9-270X 2GB Video Card |
| GeForce Drivers |
331.70 (GTX 690, TITAN,780 Ti, 780, 770, 760) Catalyst 13.11 Beta 8 (R9-290X, R9-280X, R9-270X |
| PSU | Thermaltake Toughpower XT 1475W Gold |
| Mouse | Tt eSPORTS Theron Gaming Mouse |
| Keyboard | Tt eSPORTS Meks G1 Illuminated |
Synthetic Benchmarks & Games
We will use the following applications to benchmark the performance of the MSI GTX 770 Gaming video card.
| Benchmarks |
|---|
| 3DMark 11 |
| 3Dmark 2013 |
| Sleeping Dogs |
| Tomb Raider |
| Metro 2033 |
| Unigine Heaven 4.0 |
| Batman Arkham City |
| Batman Arkham Origins |
| Dirt 3 Showdown |
| Metro Last Light |
| Sniper Elite V2 |
3DMark 11

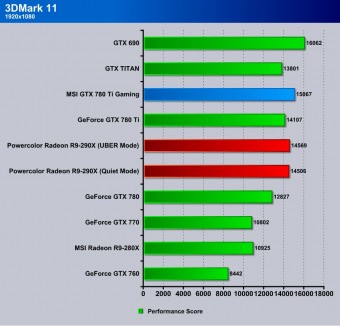
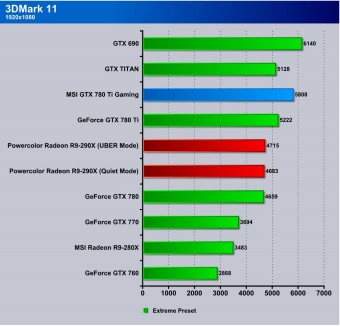
3DMark 11 shows some impressive numbers with teh Gaming edition Ti model pulling in between the 780 and the 690.
3DMark 2013
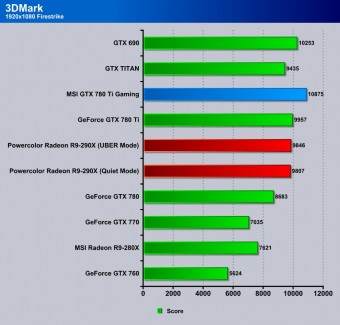
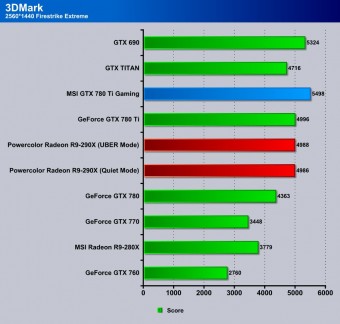
In 3DMark Firestrike and extreme the gaming Ti Edition pulls ahead of the whole pack but.
Unigine Heaven 4.0

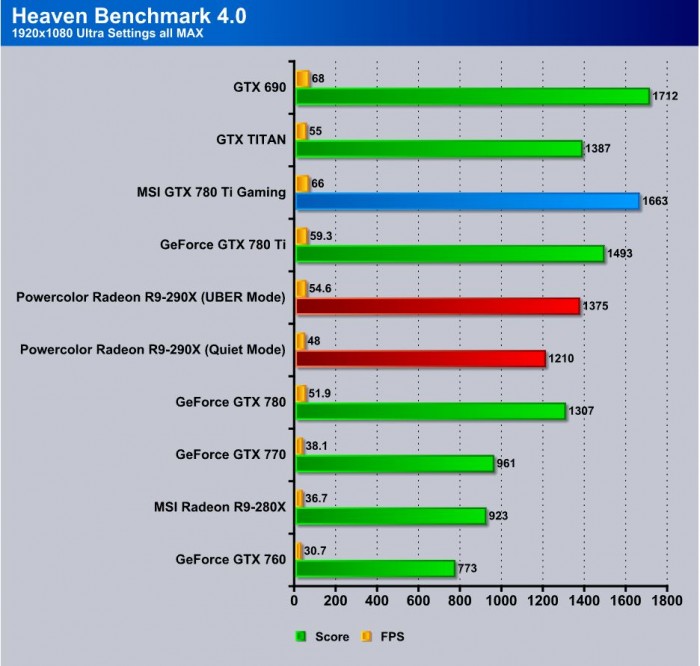
Unigine Heaven is a benchmark program based on Unigine Corp’s latest engine, Unigine. The engine features DirectX 11, Hardware tessellation, DirectCompute, and Shader Model 5.0. All of these new technologies combined with the ability to run each card through the same exact test means this benchmark should be in our arsenal for a long time.
Heaven shows the potential of the MSI model with a over 6FPS gain over the reference model.
Sleeping Dogs
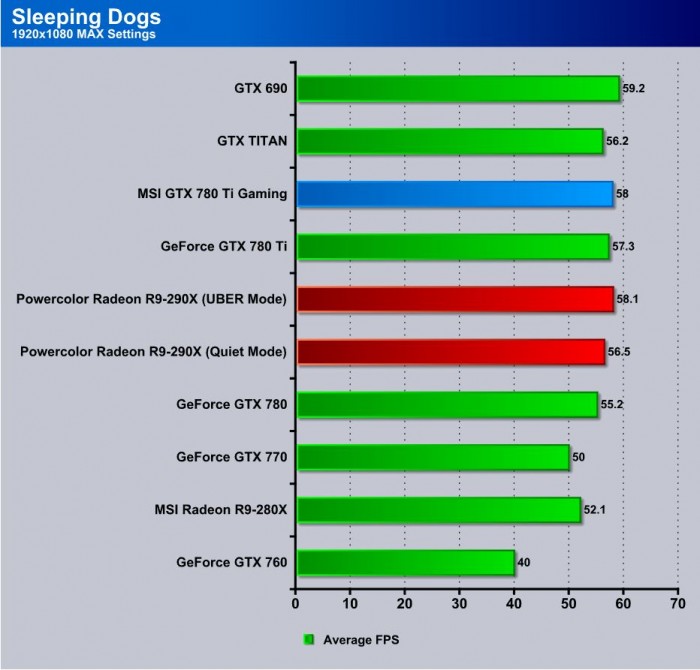
Sleeping Dogs being the Ti find itself a step behind the 690 but a step ahead of the reference 780 model.
Metro 2033

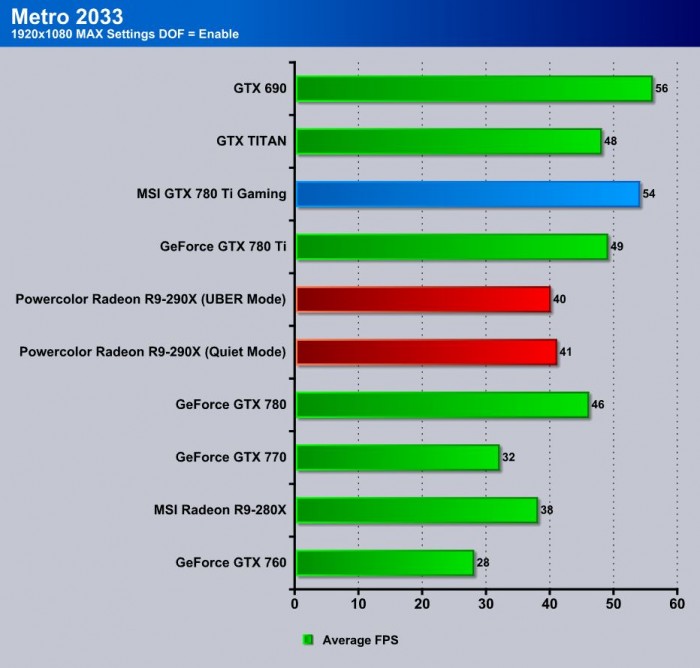
Even after many years, Metro 2033 is still one of the most demanding DX11 video games available to really push the limits of your system. Here the gaming model pulls a nice 5FPS lead over the reference while falling a couple FPS behind the previous gen dual GPU model.
Batman Arkham City

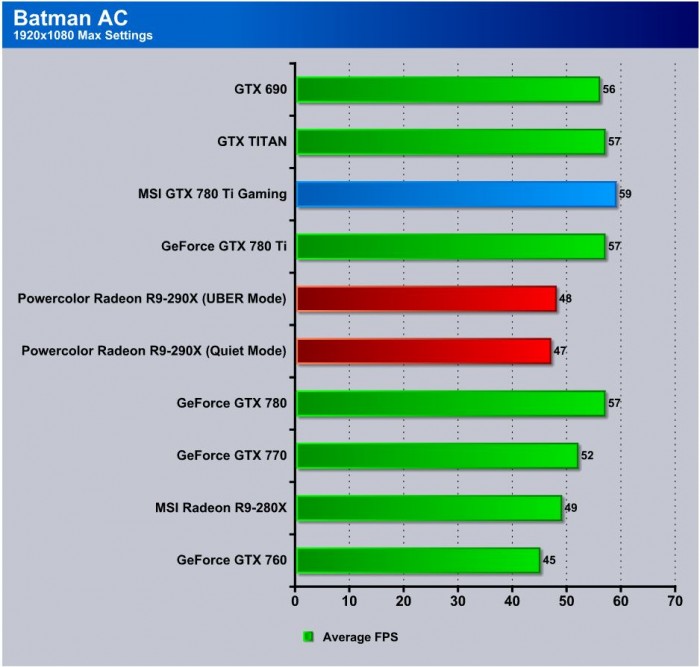
Batman Arkham City is a fun game and utilizes FXAA fully. It is nice to see the full screen anti-aliasing getting picked up by popular titles. Here bthe Gaming edition card once again takes a nice little jump ahead of the reference card and the rest of the pack in the process.
Batman Arkham Origins
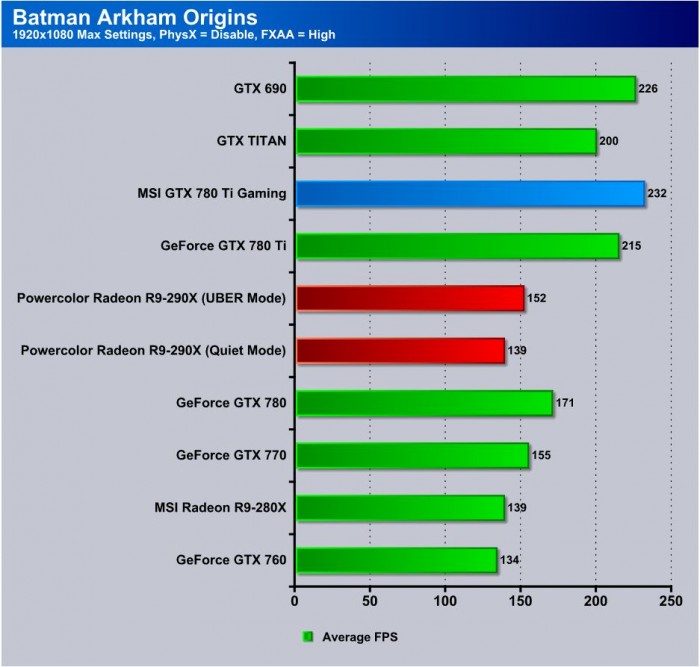
This is the newest installment to the Arkham series Batman games and in order to ensure an even playing field I disabled Nvidia Physx and Nvidia based AA sticking with a standard high AA variant to ensure as equal loading as possible. The Gaming edition card wipes the floor with the competition yet again!
Tomb Raider
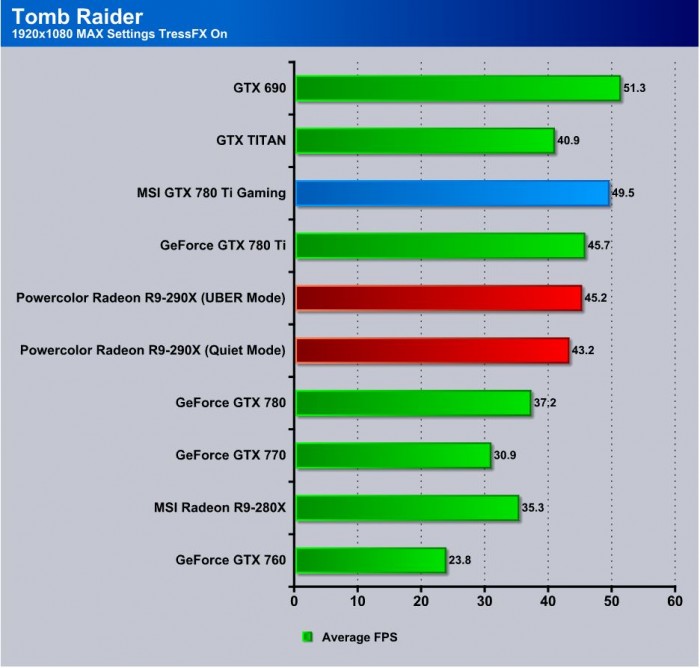
Tomb Raider once again is a heavily pushed title by AMD and with TressFX even after all of this time shows major issues like the hair looking like it was experiencing electro shock therapy to it just looking odd. The Gaming model Ti once again slots in right behind the 690 card and well ahead of the reference 780 at almost 5FPS gained.
Metro Last Light
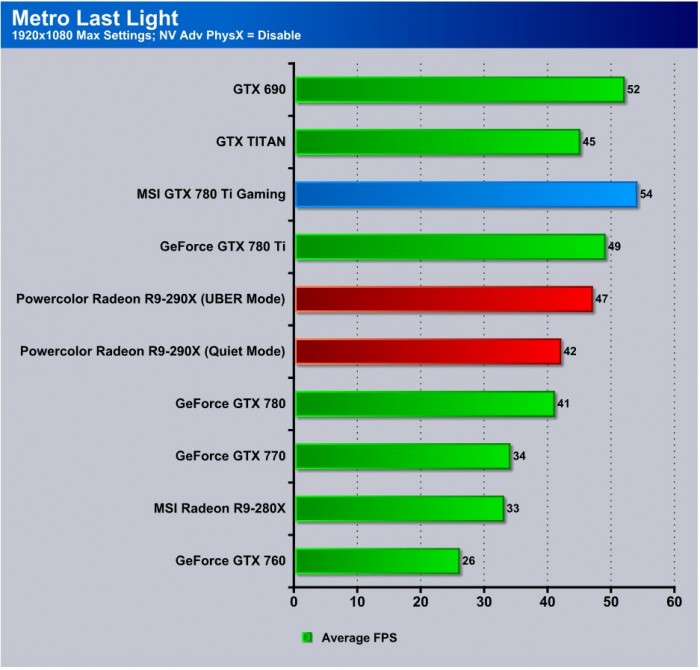
Here we have Metro Last Light which is a brand new game added to our testing platform as it just came out. If you thought Metro 2033 was stressful you have seen nothing yet. The particles and lighting, as well as the PhysX effects all add up to an amazing looking game that can put a stun even the most powerful system in its tracks. Once again we disabled the Nvidia technology PhysX to ensure even results and playing field. the Gaming edition Ti here shows a good result being 2FPS above the 690 and 5FPS average above the reference 780.
Sniper Elite V2
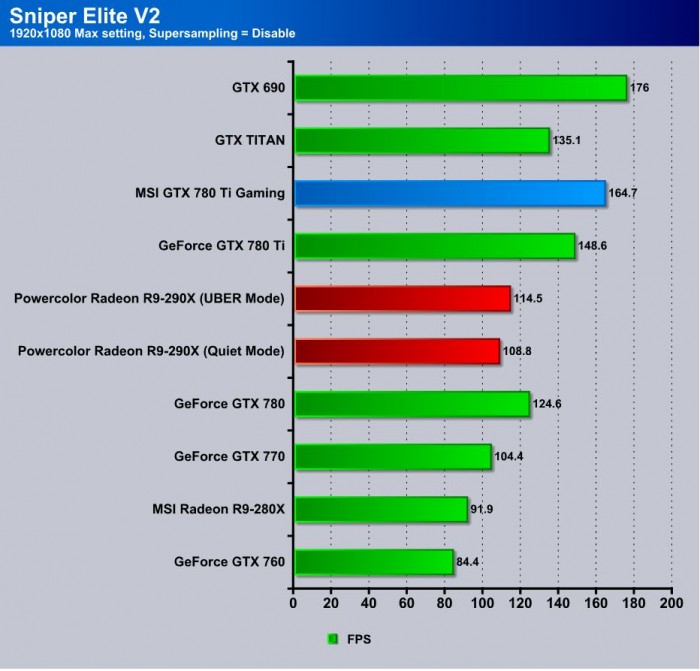
Sniper Elite V2 is a fun game which, when first released, was quite stressful but still playable on most higher end cards. By now, most cards have surpassed it, and the Gaming edition TI is no different pulling almost 165FPS average which is almost 16FPS over the reference model and a bit short of the 690 here.
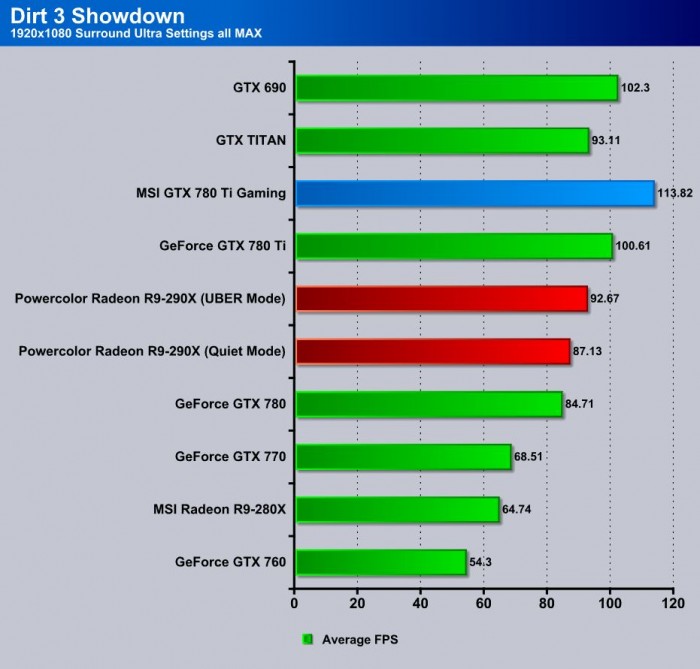
Dirt 3 Showdown

Dirt 3 Showdown is a visually beautiful game with excellent lighting and overall motion blurring creating a real visual spectacle of a game. The Gaming edition Ti pulls out all of the stops here and surpasses the 690 by over 11 FPS and the reference 780 Ti by over 13 FPS.
Review Overview
Performance - 9.5
Value - 9.5
Quality - 9
Features - 8.5
Innovation - 8.5
9
MSI employs a reference design with some minor tweaks which shapes up to be one very powerful performer at a nice value for the enthusiasts gamer in all of us.
 Bjorn3D.com Bjorn3d.com – Satisfying Your Daily Tech Cravings Since 1996

