Testing & Methodology
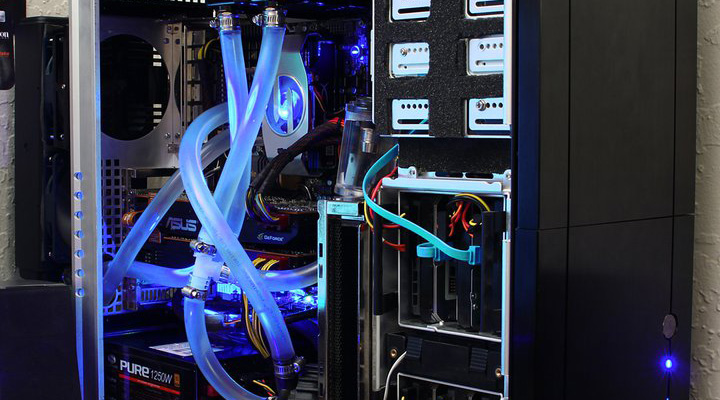
We’ve expanded our testing suite considerably since the X79 chipset release, and will continue to use the same methods for most of the motherboards and CPU’s we test. In the interests of thoroughness and accurate results, we run each test at least three times, and some tests more than that. We average the total of all the tests from each benchmark then report the average here.
The OS we use is Windows 7 Pro 64bit with all patches and updates applied. We also use the latest drivers available for the motherboard and any devices attached to the computer. We do not disable background tasks or tweak the OS or system in any way. We turn off drive indexing and daily defragging. We also turn off Prefetch and Superfetch. This is not an attempt to produce bigger benchmark numbers. Drive indexing and defragging can interfere with testing and produce confusing numbers. If a test were to be run while a drive was being indexed or defragged, and then the same test was later run when these processes were off, the two results would be contradictory and erroneous. As we cannot control when defragging and indexing occur precisely enough to guarantee that they won’t interfere with testing, we opt to disable the features entirely.
Prefetch tries to predict what users will load the next time they boot the machine by caching the relevant files and storing them for later use. We want to learn how the program runs without any of the files being cached, and we disable it so that each test run we do not have to clear pre-fetch to get accurate numbers. Lastly we disable Superfetch. Superfetch loads often-used programs into the memory. It is one of the reasons that Windows occupies so much memory. Vista fills the memory in an attempt to predict what users will load. Having one test run with files cached, and another test run with the files un-cached would result in inaccurate numbers. Again, since we can’t control its timings so precisely, it we turn it off. Because these four features can potentially interfere with benchmarking, and and are out of our control, we disable them. We do not disable anything else.
One thing to note is that we are revamping our testing method in order to better represent motherboard performance and offering to you guys the consumer. Also we want to make it an easier read for you without miles of endless charts. Please feel free to provide feedback on what you think as many benchmarks will be shuffled or removed completely.
Test Rig
| Test Rig | |
| Case | Thermaltake Level 10 GT |
| CPU | Intel Core i7-4770K |
| Motherboard | ASUS Z87-PRO |
| Ram | Gskill TridentX 2666MHz |
| CPU Cooler | Swiftech H20-220 Edge |
| Hard Drive | Western DIGItal Velociraptor 300GB |
| SSD | Intel 510 series SATA III 120GB |
| Optical | ASUS BD-ROM |
| GPU | ASUS GTX680 Top |
| Additional Cards | N/A |
| PSU | Thermaltake Toughpower XT 1275W Platinum |
| Mouse | Tt eSPORTS Black gaming mouse |
| Keyboard | Tt eSPORTS Meka G1 mechanical gaming keyboard |
Test Suite
We will use the following applications to test the performance of the Motherboard
| Benchmarks |
|---|
| SuperPi Mod 1.5 |
| Wprime 1.55 |
| PCMark 7 |
| 3DMark 11 |
| Cinebench R11.5 |
| X264HD |
| Truecrypt 7.1 |
| Unigine Heaven 4.0 |
| Metro 2033 |
| Batman Arkham City |
| Sniper Elite V2 |
Overclocking

The Z87 Platform is a totally different animal in terms of overclocking here. The Haswell Processor (4770K in this case) can run very hot when clocking which means you gotta have some good cooling if your pushing the limits. Luckily for us, we have access to everything up to LN2 to test with but in reality as most users reading this will never venture that far past liquid cooling we try to keep it rather pedestrian in comparison with a custom 240mm radiator liquid cooling setup. It has worked very well with SB, SB-E, IVB and so on, but we must say Haswell definitely put it to the test.
Raising the multiplier is your quickest way to overclock the CPU which with some small voltage tweaks we were able to get to my testing speed of 4.6GHz and with not a huge amount of voltage but it should be noted that even at 4.6 which we consider to be a modestly high overclock for 24/7 usage it definitely runs much hotter than Ivy Bridge (3770K) and mind you that is to no fault of the board but more so to the design of the CPU itself in which you get the extra thermal dump.
The auto overclocking for the ASUS board even in the mainstream was very well tuned as it achieved stable clocks very quickly and easily, but we all know that were not here for the simple clocks so quickly I jumped into the advance to give it a run.
Similar to what I found on the Z87-A is that the BIOS works very similar minus some of the subzero tweaks to teh higher end series and achieving the 4.6GHz that I test at was virtually effortless. Within a minute or so I have 4.6GHz easily stable then a few minutes finding minimal voltage to run and it was off to the races although I bet there is alot more in the chip I dont want to push it too far as 4.6GHz is already well past the area of diminishing returns for any real world usage.
Important note: Overclocking can cause component failure. Please exercise caution when attempting any level of overclock on system components.
Temperatures

The temperatures were recorded with RealTemp while running wPrime 1024 right before the end of the 5th run. The results were recorded carefully. After the results were recorded, we waited for 30 minutes before taking Idle temperature measurements. The results were as follows:
| CPU Temperatures | Temperature (Idle/Load) |
| ASUS Z87-PRO OC (4.6GHz) | 33C/70C |
| ASUS Z87-PRO | 31C/62C |
| Chipset Temperatures | Temperature (Idle/Load) |
| ASUS Z87-PRO OC (4.6GHz) | 31C/40C |
| ASUS Z87-PRO | 29C/33C |
The reason temps may look a little lower than seen elsewhere online is that We are using a custom liquid cooling loop compliments of Swiftech which helps us reach an area of much higher headroom for overclocking and performance testing.
Power Consumption

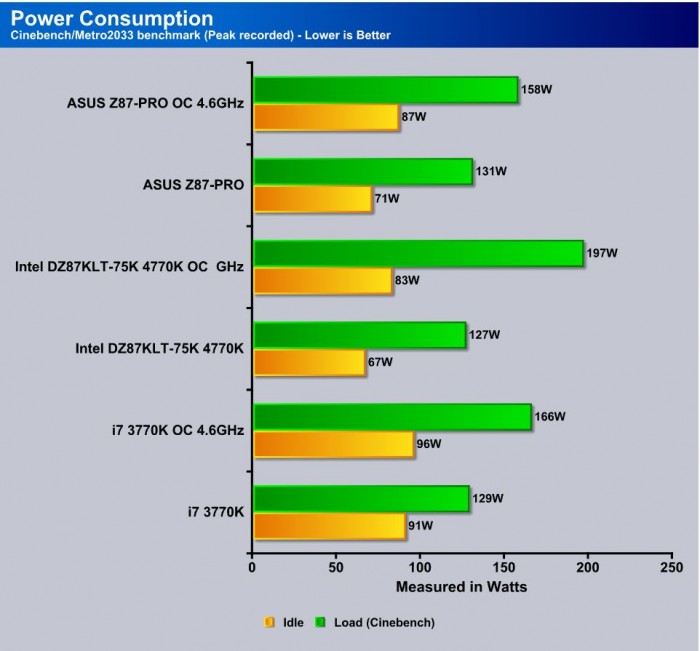
The power consumption was tested while running Wprime 1024 for a few minutes at stock settings. The results were recorded carefully with a Kill-A-Watt power consumption measuring tool at the wall. After the results were recorded, we waited for yet another few minutes minutes before taking Idle power consumption measurements.
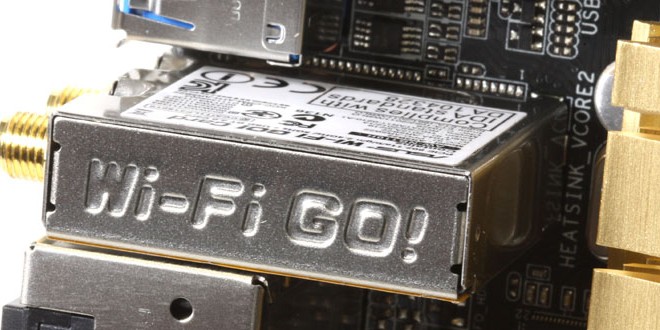
The power consumption is measured without a GPU installed but the iGPU loaded to see what the best representation of peak power consumption you can expect. Do notice that this board pulls a small amount more than the reference Intel at stock but that can easily be attributed to the extra controllers onboard such as the WiFI and others.
Performance Benchmarks
PCmark 7

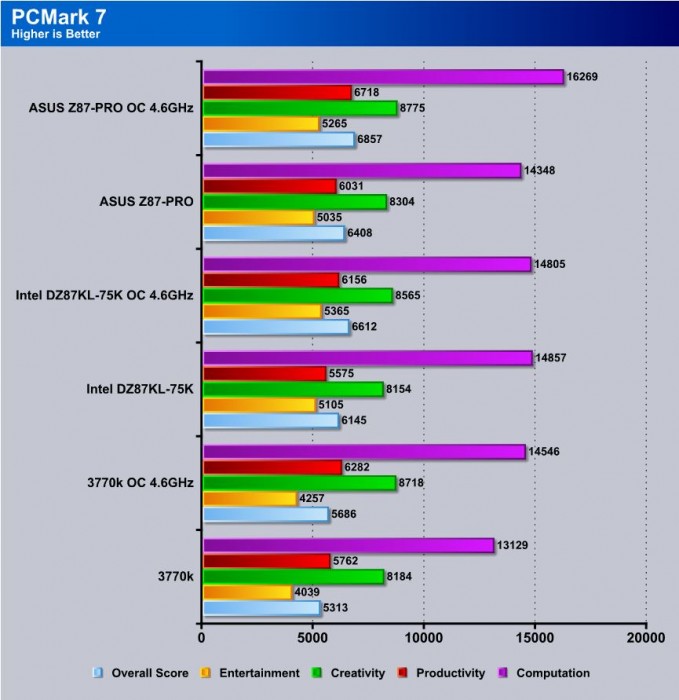
In PCMark we are seeing a trend across the ASUS boards as their efficiency tracks very well and pulls a very nice score easily besting the previous gen and even the Intel reference.
3DMark 11

Discrete GPU
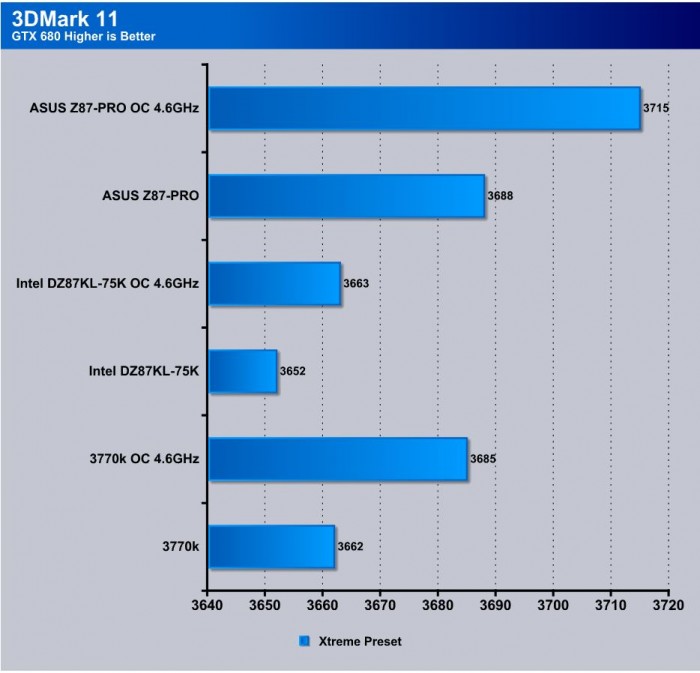
Here you can see that the Z87-PRO puts a overall hurt on the previous gen along with even current Intel as well as it simply does extremely well under the gaming simulated load of 3DMark.
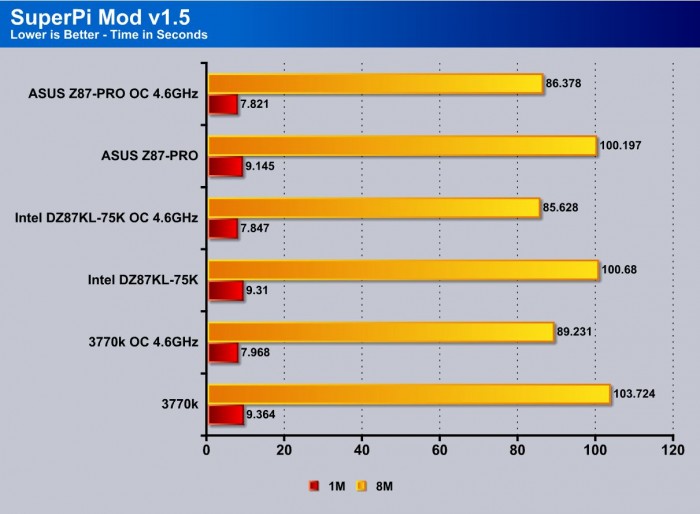
SuperPi
The Maximus board seems to do decently here but is a bit behind the Intel board but once again being the fact that we have been getting BIOS updates regularly all the way up to the launch and then even after a bit we will reserve our opinion on the single threaded performance until I feel that everything including MRC updates are under control. These updates included updated code from Intel so its possible that it could change the state of the game completely in a single update.
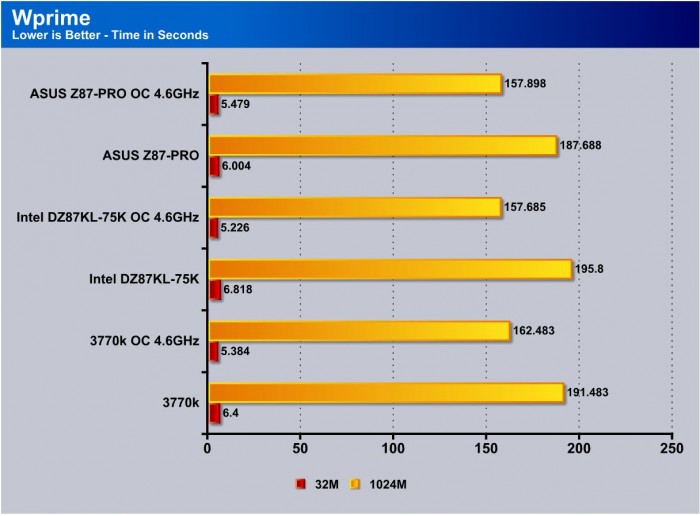
Wprime
WPrime is similar to Superpi, but is multi core aware and you can set the core count. We used 8 cores to take advantage of the 4770K’s HyperThreading ability. Here the ASUS board once again impresses with a very powerful run ripping off some seriously good numbers. These numbers come close to the top end OC based boards.
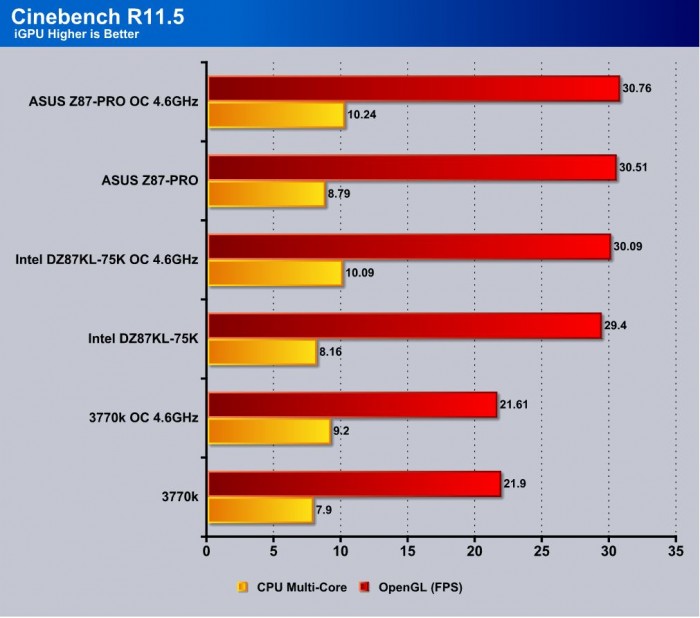
Cinebench R11.5

“CINEBENCH is a real-world test suite that assesses your computer’s performance capabilities. MAXON CINEBENCH is based on MAXON’s award-winning animation software, CINEMA 4D, which is used extensively by studios and production houses worldwide for 3D content creation. MAXON software has been used in blockbuster movies such as Spider-Man, Star Wars, The Chronicles of Narnia and many more. MAXON CINEBENCH runs several tests on your computer to measure the performance of the main processor and the graphics card under real world circumstances. The benchmark application makes use of up to 16 CPUs or CPU cores and is available for Windows (32-bit and 64-Bit) and Macintosh (PPC and Intel-based). The resulting values among different operating systems are 100% comparable and therefore very useful with regard to purchasing decision-making. It can also be used as a marketing tool for hardware vendors or simply to compare hardware among colleagues or friends.”
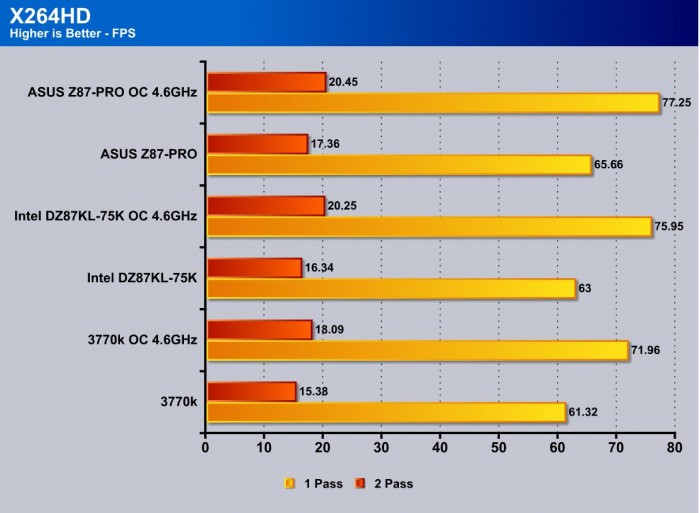
X264HD

Transcoding has become more popular now and the latest Sandy Bridge processor added support for AVX instruction for faster video transcoding. With that you can see that going from Ivy Bridge to Haswell can net you some very good gains, especially a 2FPS gain on 2 Pass. This tells us that overall optimizations to the new platform are present and working very well.
Truecrypt 7.1

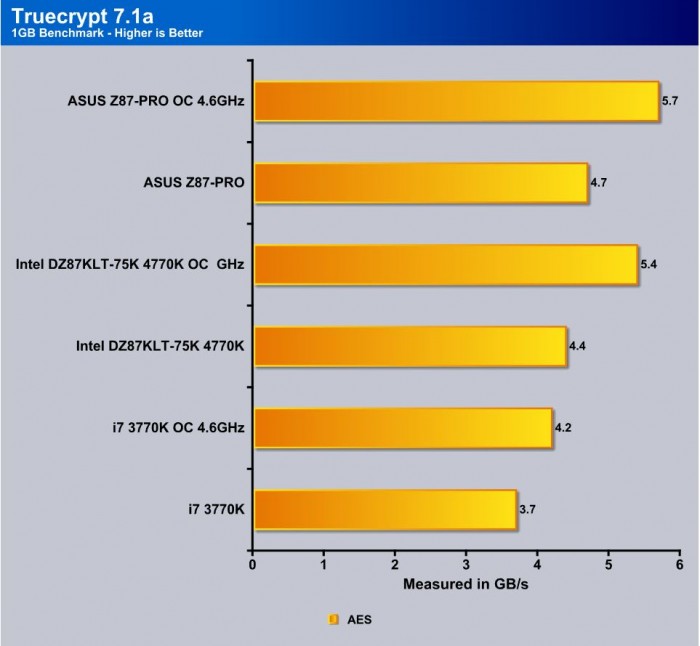
TrueCrypt is a real world application that gives a good indication of the true performance of our latest processor. Here the new Core i7 4770K puts some definite room between itself and the outgoing 3770K with over a 22% performance increase, which means in the same time you can get a lot more work done.
Unigine Heaven 4.0

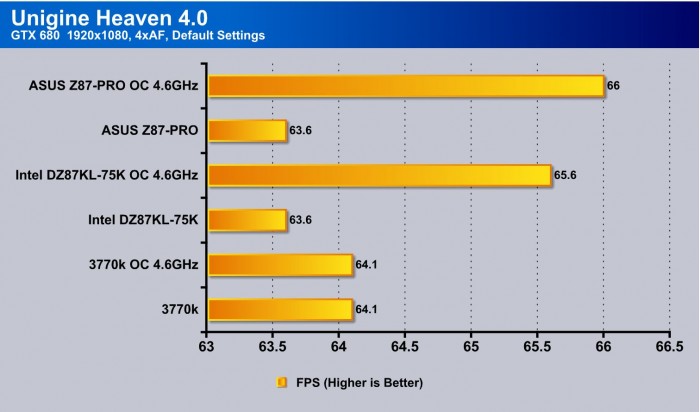
Unigine Heaven is a benchmark program based on Unigine Corp’s latest engine, Unigine. The engine features DirectX 11, Hardware tessellation, DirectCompute, and Shader Model 5.0. All of these new technologies combined with the ability to run each card through the same exact test means this benchmark should be in our arsenal for a long time.
Discrete GPU
Unigine Heaven on a discrete GTX 680 gains about a single FPS, probably just due to the expanded performance with the overclock. For the most part, however, recent platforms are so efficient that there simply is no bottleneck for current gen card models.
Metro 2033

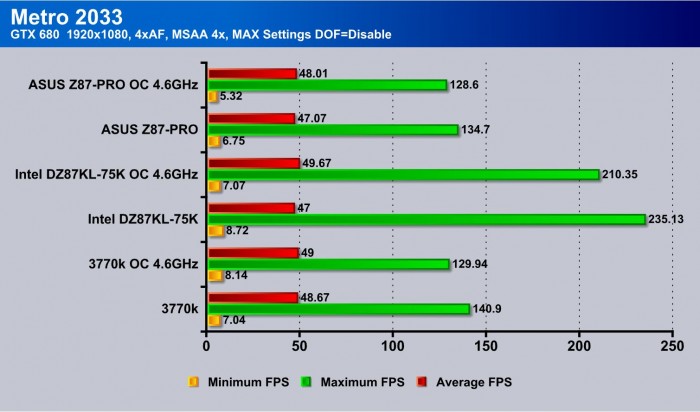
Once again, Metro 2033 shows that discrete GPU performance is relatively unaffected, simply due to the fact that there is already so much unused bandwidth available.
Batman Arkham City
Discrete GPU
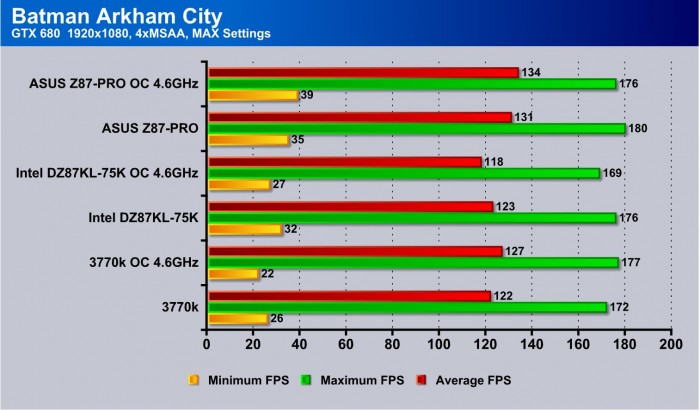
Discrete GPU results once again hover without huge movement as the bandwidth is unsaturated for PCIe 3.0.
Sniper Elite V2
Discrete GPU
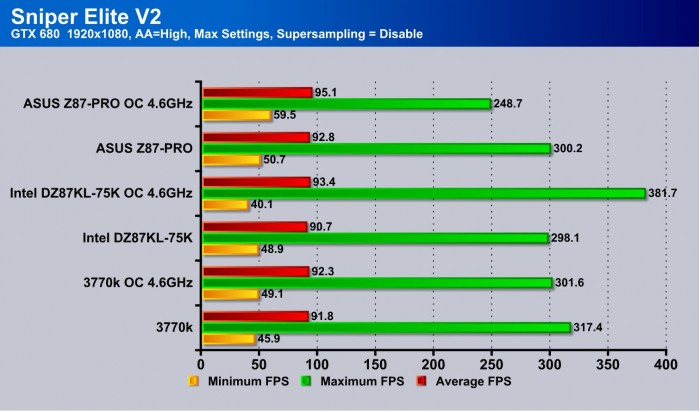
The overall trend here is the same as for the other discrete GPU results, though the addition of the Maximus board yields a bit higher minimum framerate due to the performance optimizations.
Review Overview
Performance - 9.5
Value - 9
Quality - 9.5
Features - 9
Innovation - 9
9.2
The ASUS Z87-PRO takes all of the performance of the higher end series and adds it to a more value package. For this it earns the Bjorn3D Golden Bear Award
 Bjorn3D.com Bjorn3d.com – Satisfying Your Daily Tech Cravings Since 1996
