Testing Methodology
The OS we use is Windows 7 Pro 64bit with all patches and updates applied. We also use the latest drivers available for the motherboard and any devices attached to the computer. We do not disable background tasks or tweak the OS or system in any way. We turn off drive indexing and daily defragging. We also turn off Prefetch and Superfetch. This is not an attempt to produce bigger benchmark numbers. Drive indexing and defragging can interfere with testing and produce confusing numbers. If a test were to be run while a drive was being indexed or defragged, and then the same test was later run when these processes were off, the two results would be contradictory and erroneous. As we cannot control when defragging and indexing occur precisely enough to guarantee that they won’t interfere with testing, we opt to disable the features entirely.
Prefetch tries to predict what users will load the next time they boot the machine by caching the relevant files and storing them for later use. We want to learn how the program runs without any of the files being cached, and we disable it so that each test run we do not have to clear pre-fetch to get accurate numbers. Lastly we disable Superfetch. Superfetch loads often-used programs into the memory. It is one of the reasons that Windows Vista occupies so much memory. Vista fills the memory in an attempt to predict what users will load. Having one test run with files cached, and another test run with the files un-cached would result in inaccurate numbers. Again, since we can’t control its timings so precisely, it we turn it off. Because these four features can potentially interfere with benchmarking, and and are out of our control, we disable them. We do not disable anything else.
We ran each test a total of 3 times, and reported the average score from all three scores. Benchmark screenshots are of the median result. Anomalous results were discounted and the benchmarks were rerun.
We ran the rig at idle for an hour, recorded the Temperature, then stressed all 6 cores for an hour and recorded the Temps. In between test runs we let the rig cool for an hour while turned off. We did that 3 times for each idle speed then immediately ran the stress test on all 6 cores for an hour. Scores reported are the average of the three runs for each test. Ambient temperatures were held at 72 degrees F.
We did disable throttling back past 3.33 GHz, we don’t want to read the idle at a reduced voltage at a speed below 3.33 GHz, we know the coolers will handle the reduced idle speed and voltage. We want to measure from the stock speed of 3.33 GHz, 3.6 GHz boost speed and a mild overclock of 4.0 GHz on the intel 980x Hexacore.
The custom water loop we used for comparison is a single 360mm Swiftech with a Swiftech mini res with Swiftech MCP655 adjustable run at full speed. The waterblock is the Swiftech 1366 block Apogee model. The fittings and hose are half inch, hose is nothing special but hardware store 1/2 inch pvc.
We tested against air cooling, but saw no need to document it here, as it is obviously a lopsided comparison.
Test Rig
| Test Rig | |
| Case | Corsair Obsidian 800 |
| CPUs | Intel Core i7 980x (Gulftown) @ 3.33GHz, 3.6 GHz, and 4.0 GHz |
| Motherboards | ASUS Rampage 3 Chipset Motherboard |
| Ram | Kingston HyperX 16GB 1600Mhz 9-9-11-27 Triple-Channel Kit |
| CPU Cooler | TT Water2.0 Pro & Performer |
| Hard Drives | 3x Western Digital 2 GB Sas (not used) |
| SSD | 2x Corsair P128 in Raid 0 |
| Optical | ASUS Quiet Track Blu-Ray |
| GPU | Nvidia GTX 560 TI |
| PSU | SilverStone SST-ST1500 1500 W PSU |
| Mouse | Razer Naga Molten |
| Keyboard | Razer Starcraft Edition |
Synthetic Benchmarks & Games
| Benchmarks |
|---|
| Prime 95 |
Results Water2.0 Performer & Pro

Prime 95 (3.33 GHz)

We are testing water against water here, as testing against air coolers would be an obviously unfair comparison.
Of course at Idle and Load the custom water loop pushing 1200 LPH we got the lowest temperatures. The Water2.0 Pro with it’s thicker 49mm Radiator beat out the 25mm Radiator on the Water2.0 Performer and both Water2.0 units beat out the older Bigwater units.
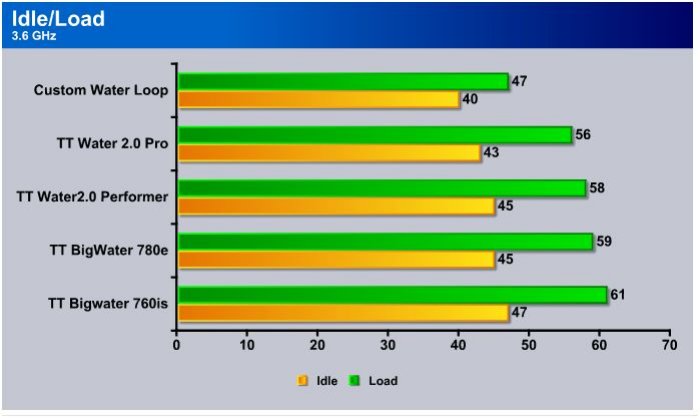
Prime 95 (3.6 GHz)

We manually set the CPU to 3.6 GHz top end and ran Prime 95 to stress all 6 cores, as expected the custom water loop with the 360mm radiator top top honors (and also top price and most labor intensive). The Water2.0 Pro was a couple of degrees cooler than the Water2.0 Performer. The older Bigwater units were close but still lagged slightly behind.
Prime 95 (4 GHz)

Pushed to 4.0 GHz a mild overclock on our Intel 980x Hex the custom water loop pulls easily out ahead of any prefab water cooler. The Water2.0 Pro ran 8°C degrees hotter on load than the custom water loop. The Pro and Performer tied on idle temperatures but the Pro having a larger water Vane area (internal) was 3°C cooler. The older Bigwater units lagged slightly behind as they have during the entire testing procedure.
Conclusion
Let’s face it: Thermaltake mixed aluminum and copper in the same water cooling kit, and mixing the two metals is considered a cardinal sin. A galvanic reaction will occur and metal will transfer from the radiator to the copper portion of the water block. In time, that will affect the performance of the kits.
Neither of the kits really brings anything new to the table, and has the same aluminum radiators Thermaltake has always used. Same rubber hoses so what we are seeing new is socket coverage. The on-block pump could be considered new but Swiftech has been doing that for a while now.
We like the ease of use, the extra headroom over the stock air cooler was rather nice. The kits aren’t designed for the enthusiast overclocker but stood up to a 4 GHz over clock on a 1.17 Billion Transistor Intel 980x Hex. The installation was easy and depending on your setup you may not even have to remove the motherboard.
Noise was practically non-existent and controllable through the 4 pin pwn fan connectors if your BIOS supports adjustable fans. We would prefer to see an in case or IO port physical controller but that would likely increase costs. In most cases aftermarket fan controllers are easily obtainable but would add cost to these kits.
What we like best about the kits is the ease with which Water cooling beginners can install and use them. We also like the price. At the time of this review the Performer runs $79.99 and the Pro Runs $99.99 with free shipping (NewEgg) there are applicable rebates but don’t count your rebates before they are hatched (excuse the NewEgg pun).
These single Radiator units aren’t designed for massive overclocking headroom, we didn’t overclock our CPU to crazy high settings and don’t recommend extreme overclocking with these units, as they aren’t designed for that purpose.
| OUR VERDICT: Water2.0 Performer | ||||||||||||||||||
|
||||||||||||||||||
| Summary: The Thermaltake Water2.0 Performer is priced right for water beginners and with much of the industry gearing to lighter weight water cooling is a good aftermarket for those new to water cooling. |
| OUR VERDICT: Water2.0 Pro | ||||||||||||||||||
|
||||||||||||||||||
| Summary: The Thermaltake Water2.0 Pro performs better than the older Bigwater kits, better than most bulky Air coolers, and better than the Water2.0 Performer at a $20 higher cost. We feel the $20 bump justified to prevent buyer’s remorse. This is a good platform to get started into water and significantly less than the 240mm Radiator kits. |
 Bjorn3D.com Bjorn3d.com – Satisfying Your Daily Tech Cravings Since 1996


