Testing & Methodology
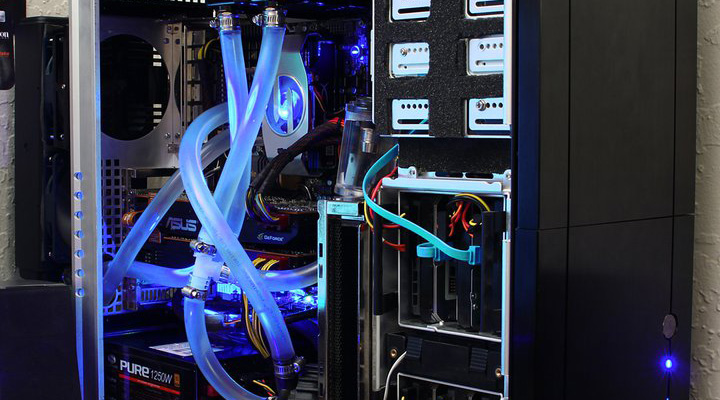
We’ve expanded our testing suite considerably since the X79 chipset release, and will continue to use the same methods for most of the motherboards and CPU’s we test. In the interests of thoroughness and accurate results, we run each test at least three times, and some tests more than that. We average the total of all the tests from each benchmark then report the average here.
The OS we use is Windows 7 Pro 64bit with all patches and updates applied. We also use the latest drivers available for the motherboard and any devices attached to the computer. We do not disable background tasks or tweak the OS or system in any way. We turn off drive indexing and daily defragging. We also turn off Prefetch and Superfetch. This is not an attempt to produce bigger benchmark numbers. Drive indexing and defragging can interfere with testing and produce confusing numbers. If a test were to be run while a drive was being indexed or defragged, and then the same test was later run when these processes were off, the two results would be contradictory and erroneous. As we cannot control when defragging and indexing occur precisely enough to guarantee that they won’t interfere with testing, we opt to disable the features entirely.
Prefetch tries to predict what users will load the next time they boot the machine by caching the relevant files and storing them for later use. We want to learn how the program runs without any of the files being cached, and we disable it so that each test run we do not have to clear Prefetch to get accurate numbers. Lastly we disable Superfetch. Superfetch loads often-used programs into the memory. It is one of the reasons that Windows occupies so much memory. Vista fills the memory in an attempt to predict what users will load. Having one test run with files cached, and another test run with the files un-cached would result in inaccurate numbers. Again, since we can’t control its timings so precisely, it we turn it off. Because these four features can potentially interfere with benchmarking, and and are out of our control, we disable them. We do not disable anything else.
We are revamping our testing method in order to better represent motherboard performance and offering to the consumer. Also we want to make it an easier read for you without miles of endless charts. We ask that you provide feedback in an effort to help us deliver better reviews for you.
Test Rig
| Test Rig | |
| Case | Thermaltake Level 10 GT |
| CPU | Intel Core i7-3770K/Intel Core i7-2600K |
| Motherboard | ASUS P8Z77-V Premium |
| Ram | (TBA) 16GbpsB Patriot Viper Xtreme 2400MHz + |
| CPU Cooler | Swiftech H20-220 Edge |
| Hard Drive | Western Digital Velociraptor 300GB |
| SSD | Intel 510 series SATA III 120GB |
| Optical | ASUS BD-ROM |
| GPU | ASUS GTX680 Top/GTX 580/Intel HD 4000 |
| Additional Cards |
N/A |
| PSU | Thermaltake Toughpower Grand 1200W |
| Mouse | Tt eSPORTS Black gaming mouse |
| Keyboard | Tt eSPORTS Meka G1 mechanical gaming keyboard |
Test Suite
We will use the following applications to test the performance of the Motherboard and installed components.
Synthetic Benchmarks & Games
| Benchmarks |
|---|
| PCMark 7 |
| 3DMark 11 |
| Cinebench R11.5 |
| Unigine Heaven 3.0 |
| SuperPi |
| Metro 2033 |
| SiSoft Sandra 2011b |
| X264HD |
Overclocking

The Z77 platform is brand new but when clocking is very similar to what we have seen with the Z68 models we have tested previously. We have said it time and time again but it bears repeating, the BCLK of the present platforms is very limited so you will be lucky to get 107 MHz with relative stability for 24/7 operation. This means that unlocked or K Sku’s are about the only real answer for a good clock and the exceptional performance potential being unlocked. The 22nm CPU’s do have one oddity we have observed and that is heat output when overclocked. This has limited air/water clocks to around 5GHz depending upon cooling solution.
We have run some of the ASUS board on Single stagephase change cooling and even though it was quite an older unit (Tuned for P4 with HT chips) the Ivy Bridge 3770K easily eclipsed 5GHz and handled approximately 5.4GHz fully stable. 5.5GHz and the required voltage for that clock overloaded the unit under extended stress so we know that better cooling (DICE, Cascade or LN2) would be required to really push the limits on these chips.
In order to best meet the middle ground of most users and their component capability we stuck with our 4.6GHz speed for the overclocked runs as this was easily obtainable on decent air cooling which means most users should be able to reproduce it without much issue.
Important note: Overclocking can cause component failure. Please exercise caution when attempting any level of overclock on system components.
Temperatures

The temperatures were recorded with RealTemp while running wPrime 1024 right before the end of the 5th run. The results were recorded carefully. After the results were recorded, we waited for 30 minutes before taking Idle temperature measurements. The results were as follows:
| CPU Temperatures | Temperature (Idle/Load) |
| ASUS P8Z77-V Premium OC (4.6GHz) | 30C/68C |
| ASUS P8Z77-V Premium | 25C/54C |
| Chipset Temperatures | Temperature (Idle/Load) |
| ASUS P8Z77-V Premium OC (4.6GHz) | 41C/47C |
| ASUS P8Z77-V Premium | 32C/42C |
The reason temps may look a little lower than seen elsewhere online is that We are using a custom liquid cooling loop compliments of Swiftech which helps us reach an area of much higher headroom for overclocking and performance testing.
Power Consumption

The power consumption was tested while running Wprime 1024 for a few minutes at stock settings. The results were recorded carefully with a Kill-A-Watt power consumption measuring tool at the wall. After the results were recorded, we waited for yet another few minutes minutes before taking Idle power consumption measurements.
| Configuration | Power Consumption (Idle/Load) |
| ASUS P8Z77-V Premium (4.6GHz) | 214W/436W |
| ASUS P8Z77-V Premium | 145W/338W |
The power consumption is not with GPU usage. This is with CPU/system loading but nothing graphically intensive in order to provide the most accurate results by not ramping up the GPU, which will pull significantly more power.
NOTE: A system using just the integrated GPU alone will likely pull much less power but a board like this is not likely to be used with an integrated GPU alone or at least most users will have a discreet GPU installed.
CPU/Performance Benchmarks
SiSoft sandra 2011

“SiSoftware Sandra (the System Analyzer, Diagnostic and Reporting Assistant) is an information & diagnostic utility. It should provide most of the information (including undocumented) you need to know about your hardware, software and other devices whether hardware or software. It works along the lines of other Windows utilities, however it tries to go beyond them and show you more of what’s really going on. Giving the user the ability to draw comparisons at both a high and low-level. You can get information about the CPU, chipset, video adapter, ports, printers, sound card, memory, network, Windows internals, AGP, PCI, PCI-X, PCI-E (PCI Express), database, USB, USB2, 1394/Firewire, etc.”
Click Image To Enlarge
SiSoft Sandra is a good system efficiency and performance benchmark as it deals with just raw numbers. A Core i7-2600K was used to show the improvement users will see from the previous generation. Many may say that a fair comparison would be the 2700K but in reality, for 1155 most users adopted the 2600K or the 2500K as the 2700K didnt come until late in the Sandy Bridge life cycle. Therefore anyone looking to jump into Ivy Bridge will likely be moving from 2600K to the 3770K as shown here. The jump from 2600K to 3770K is not large and not really a surprise as this die shrink is a small step forward.
SuperPi
SuperPi is a single threaded benchmark which measures efficiency and is heavily influenced by architectural changes as much as it is by clockspeeds.
SuperPi is a great efficiency benchmark and one we always use just because its simple and it shows improvements when they exist. the slightly higher clock speed of the 3770K in single threaded apps likely gives a jump here but overall efficiency is still a step forward and quite good for the platform.
X264HD
The X264 benchmark is all about encoding and how well your CPU can do it. wWe have seen the 3770K and how it performs and there’s no surprise here as performance is spot on with what I would expect with minor efficiency differences from board to board but overall the difference is marginal and within the margin for error.
Real world/Gaming Benchmarks
3DMARK 11

3DMark 11 is the newest in Futuremark’s suite of benchmarking utilities. Its a fully capable DirectX11 benchmark which also stresses and analyzes the system performance as a whole to simulate a heavy rendering environment such as a high end game or other app the end user may run. This benchmark was run with Performance settings 5 times and all runs were averaged for the result below.
In 3DMark 11, we opted for the Physics score as this test is CPU based and relies on no graphics, so we just see the CPUs ability to render the preset Physics test. As we see the die shrink scales ahead by a decent amount especially when overclocked and this shows for gamers coming from the common 2600K this would be a rather decent upgrade.
Here we look at how the system scores with a ASUS GTX680 installed in the system. now remember that the 2600K offers PCI-E 2.0 whereas the 3770K is PCI-E 3.0 enabled and therefore we do see a small jump in graphics performance when we run the Xtreme preset. But the real star of the show here is the LucidLogix MVP which really is the MVP of our testing with a huge gain by bolstering the GPU with the iGPU to increase performance.
Unigine Heaven 3.0

Unigine Heaven is a benchmark program based on Unigine Corp’s latest engine, Unigine. The engine features DirectX 11, Hardware tessellation, DirectCompute, and Shader Model 5.0. All of these new technologies combined with the ability to run each card through the same exact test means this benchmark should be in our arsenal for a long time.
Here with heaven at 1080P once again we see a small bump going from PCI-E 2.0 to 3.0 but the big jump comes from the MVP technology.
Metro 2033

Metro 2033 is just pure hell on a GPU as with the GTX580 we found minimum framerates slowing to a complete crawl, though with the new GTX 680 that situation has been vastly improved. MVP once again gives a nice boost to the performance which could make the difference between smooth and choppy for the gamer who has a GPU just at the edge of playable and suddenly getting access to the MVP feature.
PCMark 7

PCMark 7 is a simple but long running synthetic system benchmark, and overall it gives a good overall view of how your system can run multiple everyday tasks. The 3770K flat out beats the 2600K and when overclocked it just pounds it into the ground so definitely a worth upgrade for anyone building a scratch system.
 Bjorn3D.com Bjorn3d.com – Satisfying Your Daily Tech Cravings Since 1996






Except you cant use all features of it at the same time. I’m using all sata ports and the performance is horrendous. Windows takes pauses every 10-15s and gaming is not possible due to microstuttering and the 10-15s pauses.
Maybe it’s your setup? I’m not using all the sata ports and not sure why I would. I have replaced the msata onboard with a 128 gig that has the os on it and boot to it. I have a 2 TB hard drive with 2 OCZ Vertex 128G SSD drives for caching and my setup is working great.
If there is onboard audio card…I will love P8Z77-V Prem more.