Testing Methodology
The operating system used was Windows 7 64bit with all current updates and patches, including all peripherals or devices used in the test rig. The default installation of the operating system is not tweaked or altered in any way with the exception of turning off drive indexing, daily defragmentation, prefetch and superfetch. Since there is no way to control when these services occur they are disabled so as not to potentially interfere with benchmarking.
| Gigabyte GTX 670 OC Test Rig | ||
|
CPU |
Intel Sandy Bridge i5 2500k @ 4.60Ghz | |
| CPU Cooler | Thermalright Venomous X (1 x 120mm PWM fan) | |
|
Motherboard |
Gigabyte GA-Z68XP-UD5 | |
|
Memory |
Corsair Dominator XMP (8 gigs dual channel) | |
|
GPU’s |
Nvidia GTX 680 OCNvidia GTX 680Gigabyte GTX 670 OCNvidia GTX 580 | AMD HD7970AMD HD7950AMD HD7870AMD HD6970 |
|
Monitor |
Dell U2410 IPS (1920 x 1200) | |
| SSD’sHard Drives | Crucial M4 (64GB) / Kingston 200 V+ (120GB)(x2) WD VelociRaptor 600GB 10000 RPM | |
|
Power |
CoolerMaster Silent Pro Gold 800 | |
| Case | CoolerMaster HAF 932 (3 x 200mm & 3 x 120mm fans) | |
All the software was tested at maximum settings (unless specified otherwise). The benchmarks were run three times each and averaged with the most common resolutions of 1680×1050 and 1920×1080 used. All benchmark screenshots are of the median result (any anomalous results were thrown out and the benchmarks were run again).
|
Synthetic Benchmarks & Games |
| 3DMark 11 (1.0.3.0) |
| 3DMark Vantage (1.1.0) |
| Unigine Heaven DX11 3.0 |
| Crysis 2 |
| Just Cause 2 |
| Lost Planet 2 |
| Metro 2033 |
Please note that due to new driver releases with performance improvements, we rebenched every card shown in the results section. The results here will be different than previous reviews due to the performance increases in drivers.
3DMark 11

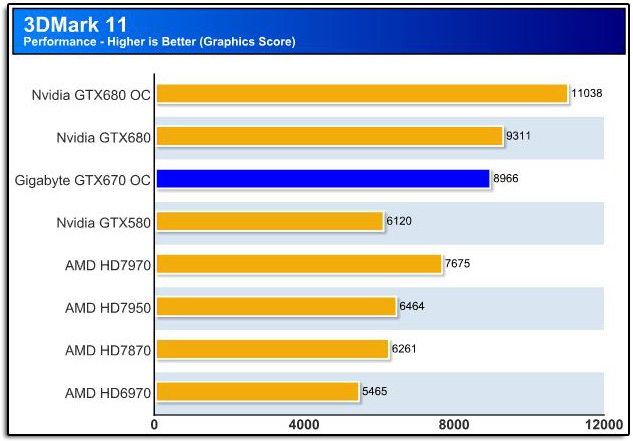
GIGABYTE’s GPU leaps into the foray with much gusto, just trailing its slightly beefier sibling by only 4% in the graphics score. Even with a disabled SMX core, the factory overclocked boost speed almost makes up for the lost ground. Please note that only graphics scores are being compared here to avoid any unaccountable variables.
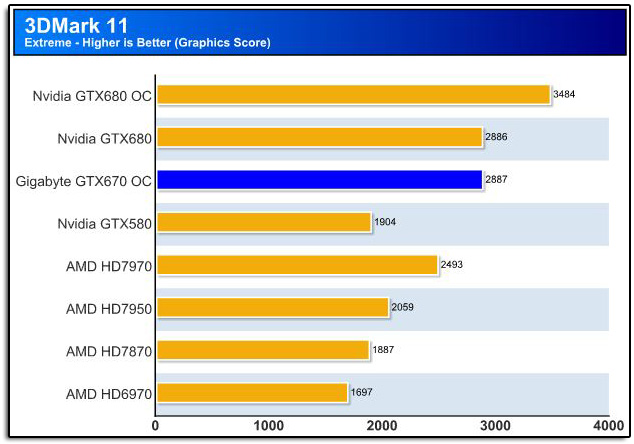
At extreme levels GIGABYTE’s factory overclock shows muscle, even beating the GTX 680 by one point. This almost appeared like an anomaly, but further testing confirmed this figure. We are going to explore this very benchmark again later in the overclocking section and see what this card is secretly capable of.
3DMark Vantage

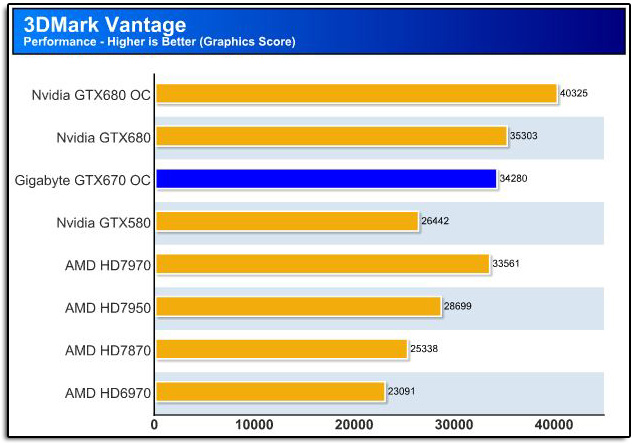

In 3DMark Vantage, GIGABYTE holds its ground over AMD’s HD7970 by only 2% in performance and 5% in Extreme; just shadowing the GTX680 by a global 3.5%. The GTX580, based on the last generation Fermi architecture is simply left in the dust here.
Unigine Heaven DX11 3.0


Based on Unigine Corp’s third generation Unigine, the Heaven benchmark features Shader Model 5.0, Direct Compute, Hardware Tessellation, and of course all the other core features of DirectX11. What is really great about this benchmark is the incredible consistency and accuracy it provides. In all tests run for the GIGABYTE card, the scores were exactly the same down to the tenth decimal place (no averaging needed). The GTX 670 OC performed admirably; only a mere 3% behind the GTX 680 with the reference GTX 680 OC still in the lead with a firm 16%. When getting down to just slivers in performance, more extreme measures need to be made via stress testing the cards; that’s where real-time game testing comes in.
Crysis 2

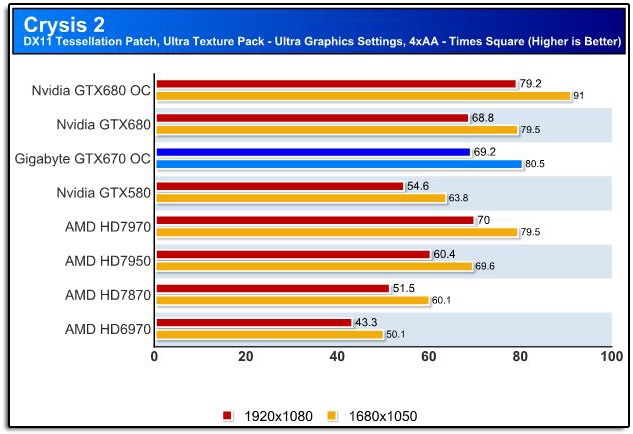
When Crysis 2 was originally released it was a DirectX10 game; however, Crytek released a mammoth DirectX11 patch which enabled not only tessellation but a fleet of other DirectX11 features. Additionally, an Ultra Texture become available which is even higher quality then the original “High Quality” textures that came with the game. The texture pack requires a minimum of 768 MB of VRAM, Crytek recommends 1 GB, and under the most demanding situations up to 1.5 gigs of video ram may be utilized. As previous witnessed in 3DMark 11, the GTX670 OC is just out pacing the GTX680 by one frame. This a good value. Please note that the AMD HD7970 is still matching the 670OC and 680 in the performance arena for this benchmark.
Just Cause 2

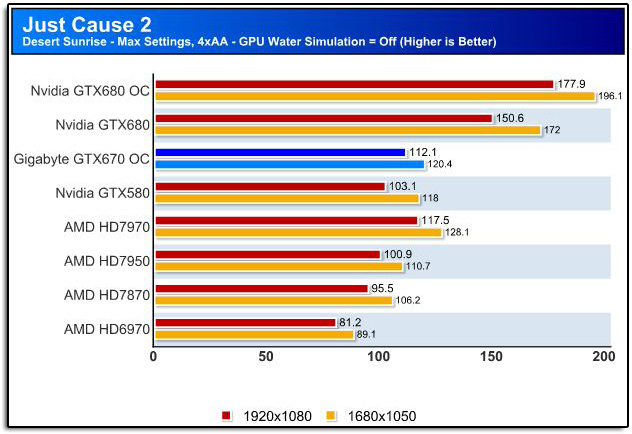
The Avalanche 2.0 Engine uses DirectX10 to create its’ jaw-dropping environments with judicious use of sun lighting, textures, and special effects. The benchmarks were run with GPU Water Simulation disabled so results would be consistent between the AMD and Nvidia cards (GPU Water Simulation is an Nvidia GPU feature only). The lack of one SMX core is apparent here with the GTX 670 OC falling behind the GTX 680 by 26% at 1920×1080 and 30% at 1680×1050. AMD’s HD7970 is still a small margin ahead by a global 5.5% with the GTX 580 trailing by the same global 5.5%.
Lost Planet 2

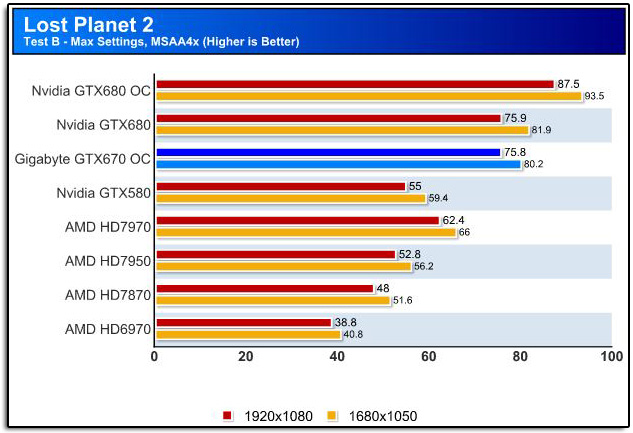
In the Lost Planet 2 benchmark, results mirror Crysis 2 between the GIGABYTE card and NVIDIA’s GTX 680 reference card. The GTX 680 OC still holds the crown by a global 14% across both resolutions. AMD’s HD7970 is trailing GIGABYTE’s card by 18% and Nvidia’s past generation GTX 580 is even further behind at 26%.
Metro 2033

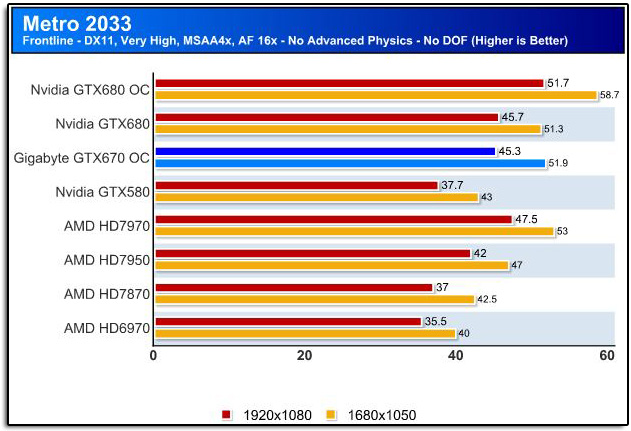
Simply put, this is a torture-test for video cards. Released in April of 2010, Metro 2033 is one of the most demanding DirectX11 games available that can hit the cap on any video card. For consistency between NVIDIA and AMD cards, Advanced Physics and Depth of Field features were disabled. Like in previous results GIGABYTE’s GTX 670 OC rose to the occasion and matched the GTX 680 once again. Top performance was held by the GTX 680 OC with a modest lead of 12% with the HD7970 just breaking ahead with 4%.
 Bjorn3D.com Bjorn3d.com – Satisfying Your Daily Tech Cravings Since 1996






I don’t notice the fan being to loud with in an inclosed case til around 65%, but the cooler is so good mine rarely ever gets to 50%. Hottest my card gets i 70-75c and that is with +60mhz OC so 1260mhz with boost and ram is overclocked from 6ghz to 7.2ghz.