Testing Methodology
The OS we use is Windows 8 Pro 64bit with all patches and updates applied. We also use the latest drivers available for the motherboard and any devices attached to the computer. We do not disable background tasks or tweak the OS or system in any way. We turn off drive indexing and daily defragging. We also turn off Prefetch and Superfetch. This is not an attempt to produce bigger benchmark numbers. Drive indexing and defragging can interfere with testing and produce confusing numbers. If a test were to be run while a drive was being indexed or defragged, and then the same test was later run when these processes were off, the two results would be contradictory and erroneous. As we cannot control when defragging and indexing occur precisely enough to guarantee that they won’t interfere with testing, we opt to disable the features entirely.
Prefetch tries to predict what users will load the next time they boot the machine by caching the relevant files and storing them for later use. We want to learn how the program runs without any of the files being cached, and we disable it so that each test run we do not have to clear pre-fetch to get accurate numbers. Lastly we disable Superfetch. Superfetch loads often-used programs into the memory. It is one of the reasons that Windows Vista occupies so much memory. Vista fills the memory in an attempt to predict what users will load. Having one test run with files cached, and another test run with the files un-cached would result in inaccurate numbers. Again, since we can’t control its timings so precisely, it we turn it off. Because these four features can potentially interfere with benchmarking, and and are out of our control, we disable them. We do not disable anything else.
We ran each test a total of 3 times, and reported the average score from all three scores. Benchmark screenshots are of the median result. Anomalous results were discounted and the benchmarks were rerun.
Please note that due to new driver releases with performance improvements, we rebenched every card shown in the results section. The results here will be different than previous reviews due to the performance increases in drivers.
Test Rig
| Test Rig | |
| Case | Test Bench |
| CPUs | Intel XEON E5-2687W |
| Motherboards | ASUS Rampage IV Extreme |
| Ram | Kingston HyperX Beast 64GB (8x8GB) 2133Mhz 11-12-11 Quad-Channel Kit |
| CPU Cooler | Custom Liquid Cooling |
| Hard Drives | 8x Western Digital RE4 2TB 7200RPM 3Gb/s Hard Drives (Raid 5) |
| SSD | 3x Kingston HyperX 240GB SATA III 6Gb/s SSD |
| Optical | ASUS DVD-Burner |
| GPU | ASUS GeForce GTX 670 DirectCU II OC Mini 2GB Video CardNvidia GeForce GTX 770 2GB Video CardNvidia GeForce GTX 780 3GB Video CardNvidia GeForce GTX 680 2GB Video CardNvidia GeForce GTX TITAN 6GB Video CardNvidia GeForce GTX 690 4GB Video Card |
| GeForce Drivers | 320.14 (GTX670, 680, 690 and TITAN) 320.18 (GTX 780, 770)320.49 (GTX 760) |
| PSU | Thermaltake Toughpower XT 1475W Gold |
| Mouse | Tt eSPORTS Theron Gaming Mouse |
| Keyboard | Tt eSPORTS Meks G1 Illuminated |
Synthetic Benchmarks & Games
We will use the following applications to benchmark the performance of the ASUS GTX 670 DirectCU II OC Mini video card.
| Benchmarks |
|---|
| 3DMark 11 |
| 3Dmark 2013 |
| Crysis 3 |
| Far Cry 3 |
| Metro 2033 |
| Unigine Heaven 4.0 |
| Batman Arkham City |
| Dirt 3 Showdown |
| Metro Last Light |
| Sniper Elite V2 |
3DMark 11

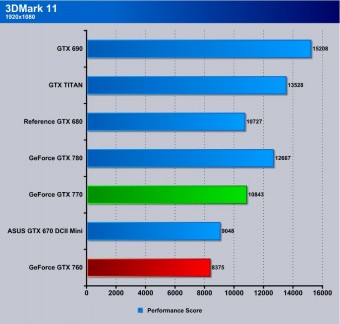
Here you can see in 3DMark 11 the ASUS GTX 670 Mini pulls in right behind the 770 and ahead of the current Gen 760 which is a pretty good result and a bit better than a reference 670 we tested quite some time ago.
3DMark 2013
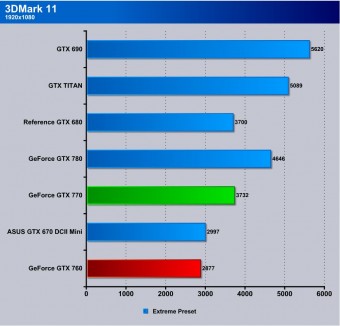
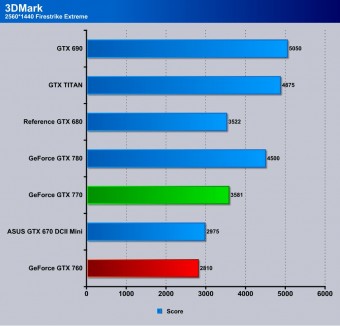
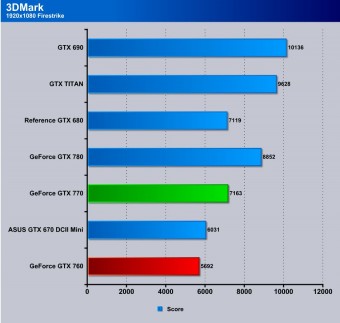
In 3DMark Firestrike and Extreme, the ASUS 670 DirectCU Mini pulls similar here right above the 760 and below the 770 but still a bit higher than a reference 670. This speaks well for the gaming ability of this small card.
Unigine Heaven 4.0

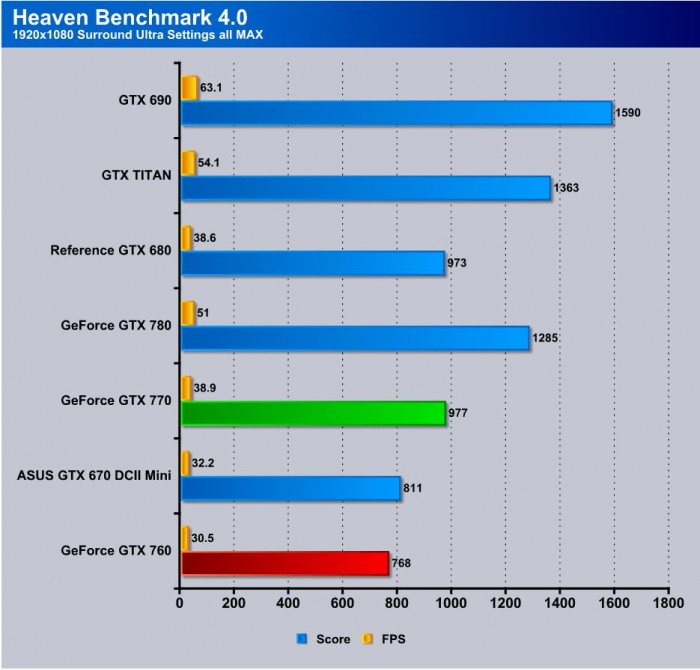
Unigine Heaven is a benchmark program based on Unigine Corp’s latest engine, Unigine. The engine features DirectX 11, Hardware tessellation, DirectCompute, and Shader Model 5.0. All of these new technologies combined with the ability to run each card through the same exact test means this benchmark should be in our arsenal for a long time.
Heaven shows a little about 2FPS over a 760 here and about 6 below a 770 so its about standard for a lightly overclocked 670.
Far Cry 3
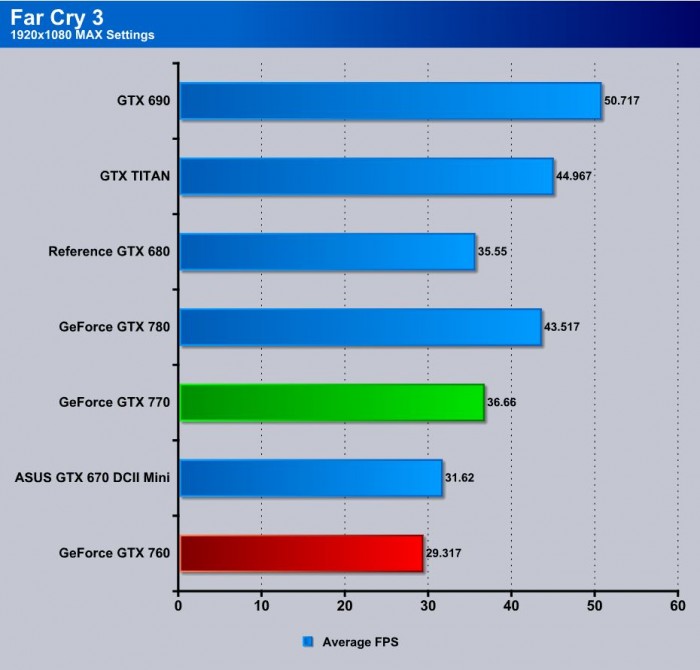
Moving over to Far Cry 3, we used a pre determined path and re-ran each card to monitor average FPS across the complete run. Each run was completed multiple times to ensure continuity and accuracy. Here the ASUS 670 pulls once again about 2FPS over the 760 and about 75 below the 770.
Metro 2033

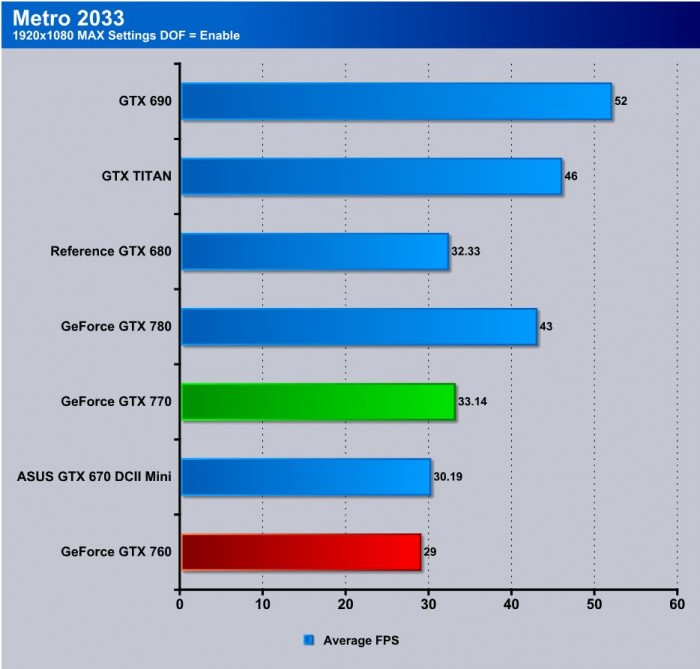
Even after many years, Metro 2033 is still one of the most demanding DX11 video games available to really push the limits of your system. Here the ASUS 670 shows the real abuse of Metro as it scrapes by with a single FPS over the newer 760 but it is still better than the reference 670 and very good performance honestly for teh stress metro puts on the graphics card.
Batman Arkham City

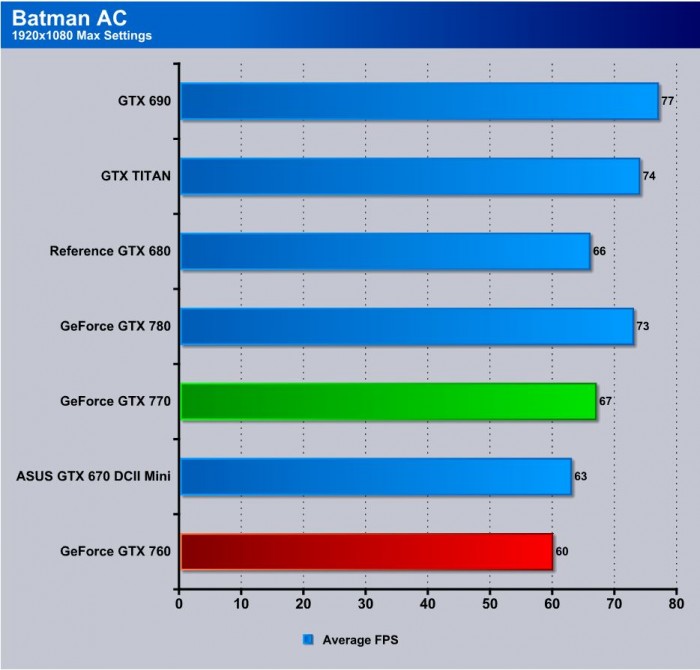
Batman Arkham City is a fun game and utilizes FXAA fully. It is nice to see the full screen anti-aliasing getting picked up by popular titles. When it comes to performance, The ASUS 670 Mini pulls in between the 760 and 770 here and a nice little jump over what we’ve seen from reference clocked 670’s in the past.
Crysis 3
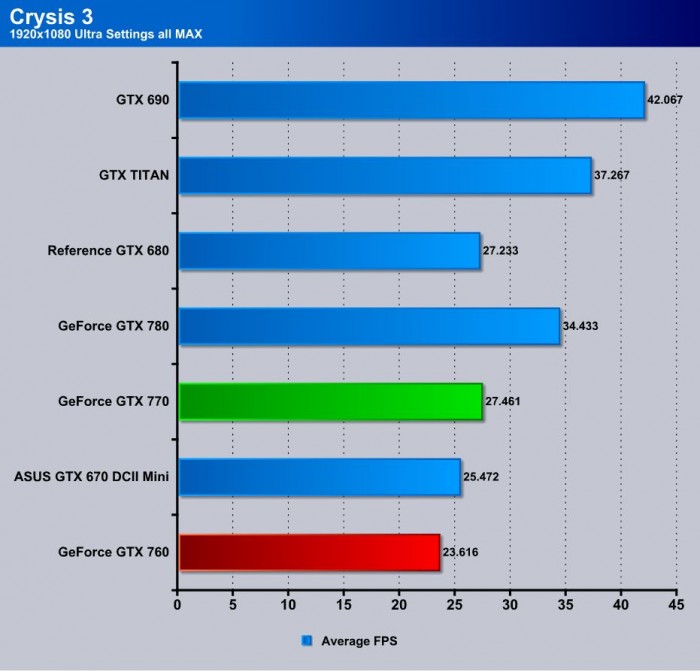
Crysis 3 is much like the original Crysis in that playing it at max settings is painful for even the highest end hardware. Once again the ASUS 670 Mini pulls in right in between the 760 and 770.
Metro Last Light
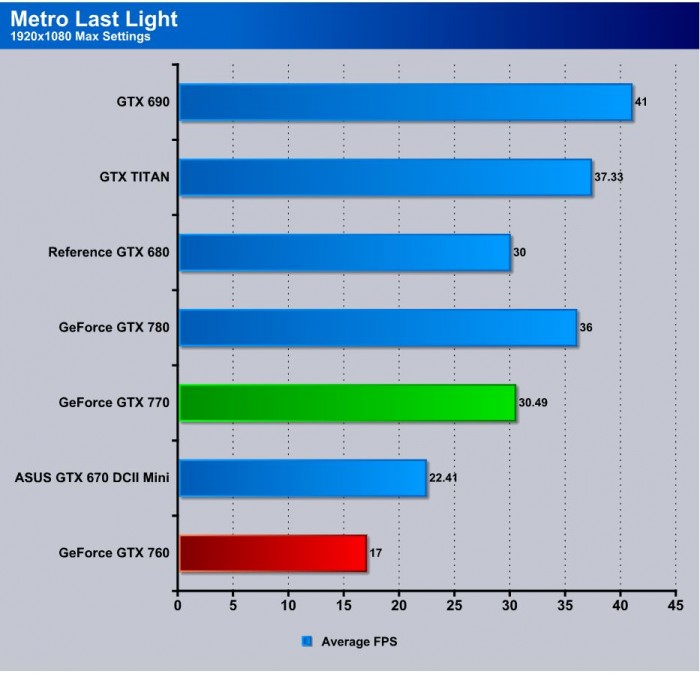
Here we have Metro Last Light which is a brand new game added to our testing platform as it just came out. If you thought Metro 2033 was stressful, you have seen nothing yet. The particles and lighting, as well as the PhysX effects all add up to an amazing looking game that can put a stun even the most powerful system in its tracks. Here the ASUS 670 Mini pulls quite good performance over the newer 760 as it pulls 5 FPS lead. This is huge in the fact that Last Light is even more stressful than Metro 2033 and to see such a large difference shows that this card is packing some major punch.
Sniper Elite V2
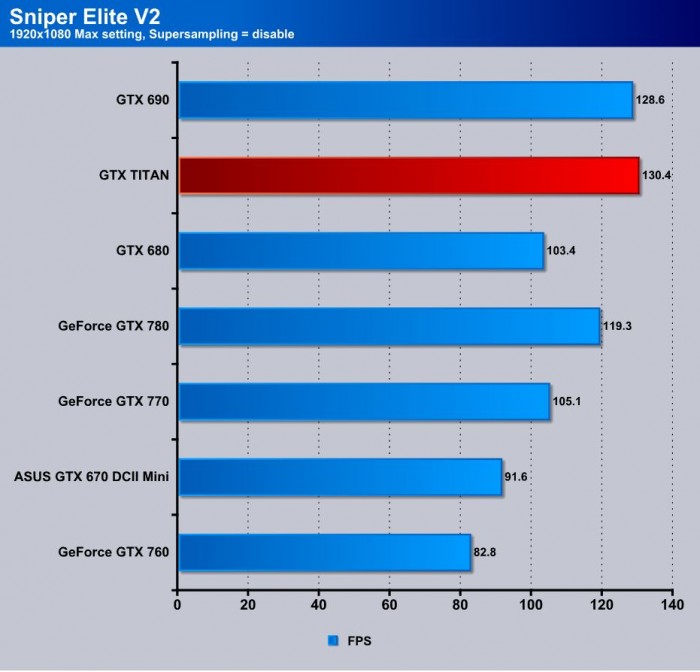
Sniper Elite V2 is a fun game which, when first released, was quite stressful but still playable on most higher end cards. By now, most cards have surpassed it, and most of the cards now easily break the 60FPS super smooth average. The ASUS 670 mini pulls over 90 which means no matter what it simply will be playing smoothly.
Dirt 3 Showdown

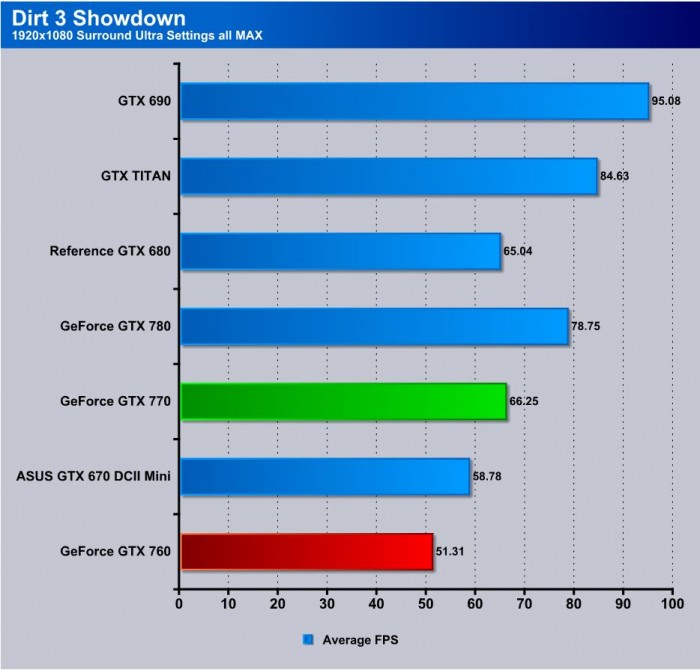
Dirt 3 Showdown is a visually beautiful game with excellent lighting and overall motion blurring creating a real visual spectacle of a game. The ASUS 670 Mini pulls just under 60FPS average so figure gameplay will be nice and smooth with no or minimal stutter.
Overclocking

The new Kepler Architecture with GPU boost has been a bit of a bear when it comes to pushing the clocks. This is due to the throttling mechanisms put in place and the fact that it dynamically clocks. Unlike 500 series where we could set a static clock and it just applied the card, Kepler clocks according to many variables, which means that much more care must be shown when applying overclock settings and even monitoring it during the run.
Things such as the thermal target can play a big role in stonewalling your performance during an overclock session, as everything has to be adjusted accordingly to ensure expected performance levels are met.
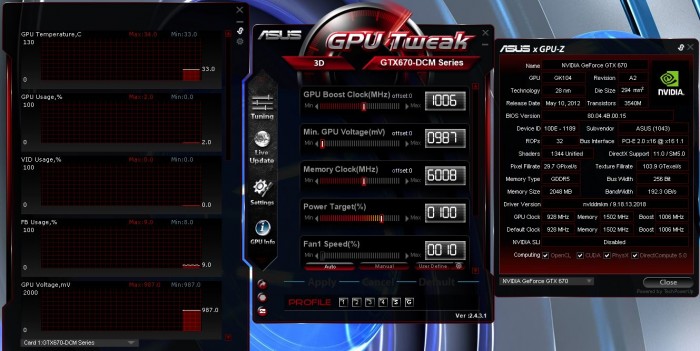
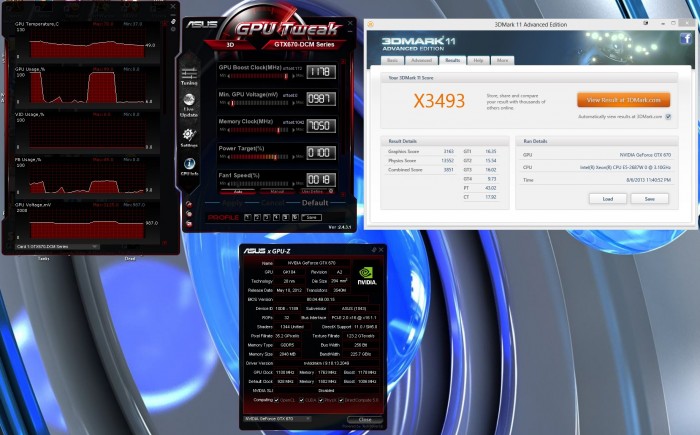
The ASUS GTX 670 DirectCU Mini cranked right up when requested and we were ble to pull it from a base clock of 928MHz to 1100MHz which translated to an effective boost clock of over 1250MHz on the GPU. This is an increase of over 16 percent on the base clock of the GPU and not bad whatsoever when you consider this was attained while reaching a maximum loaded temperature of only 70C peaks.
Memory ran quite well moving from the 6GHz mark up and beyond 7GHz to a final stable speed of 7052MHz on the memory which really opened up the pipeline for some great GPU performance as you can see by the 3DMark 11 score shown above.
TEMPERATURES

To measure the temperature of the video card, we used ASUS GPU Tweak (Validated with EVGA Precision X) and ran Heaven Benchmark in a loop to find the Load temperatures for the video cards. The highest temperature was recorded. After looping for 10 minutes, Heaven was turned off and we let the computer sit at the desktop for another 10 minutes before we measured the idle temperatures.
| GPU Temperatures | Temperature (Idle/Load) |
| Nvidia GTX 690 | 32C/81C |
| Nvidia GTX TITAN | 31C/67C |
| Nvidia GTX 680 | 31C/72C |
| Nvidia GTX 780 | 30C/65C |
| Nvidia GTX 770 | 34C/79C |
| ASUS GTX 670 DCII Mini | 33C/70C |
The DirectCU Mini cooling solution while being a radial design did handle temps quite well with its integrated vapor chamber. The fact that we found the limit of the GPU while barely seeing peaks of 70C tells me that in a standard gaming rig or even a cramped mini ITX or mATX build this card will really be up to the task of knocking out some awesome gameplay.
POWER CONSUMPTION

To get our power consumption numbers, we plugged in our Kill A Watt power measurement device and took the Idle reading at the desktop during our temperature readings. We left it at the desktop for about 15 minutes and took the idle reading. Then we ran Heaven Benchmark for a few minutes minutes and recorded the highest power usage.
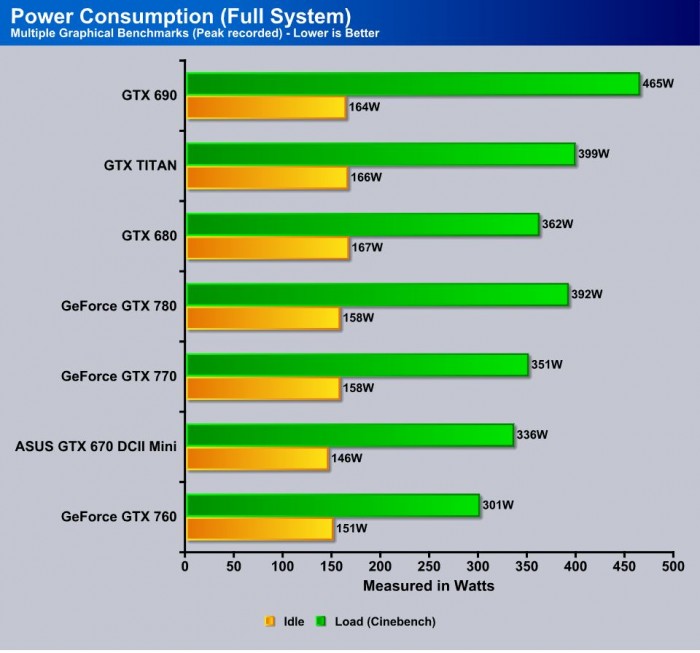
Here we observed that the ASUS GTX 670 DirectCU Mini pulled very low power at idle even lower than the reference 760. Under load it pulled a bit more but was below the 770 model. Overall this means when browsing and light load the power consumption of your rig would be lower for even a lower power bill.
Review Overview
Performance - 9.5
Value - 9
Quality - 9.5
Features - 9
Innovation - 9
9.2
The ASUS 670 Mini card has filled a need that apparently not many thought of. The innovation and pure performance earns it the Bjorn3D Golden Bear Award
 Bjorn3D.com Bjorn3d.com – Satisfying Your Daily Tech Cravings Since 1996
