The Silicon Xpower DDR3 Dual Channel RAM has an eye-catching design, and is a great tool for those who do extensive video, photo, or music manipulation.
Introduction
Today we are reviewing Silicon Power’s high speed dual channel XPower DDR3 2000 (PC3-16000) RAM, compatible with Intel Core i3, i5, and i7 platforms, and has a CAS of 9. It is part of their overclocking lineup, designed for enthusiasts. Other models in their lineup include DDR3 1600 (CAS 8) and DDR3 1800/2133 (CAS 9). Our review sample comes with 2 sticks, each 2GB.
Silicon Power Computer and Communications Inc. was established in 2003 and are headquartered in Taiwan. They have locations in Japan, Netherlands, Balkans, and China and have plans to set up in Germany and the U.S.A. Silicon Power are a leading manufacturer of memory cards, flash drives, card readers, solid state drives, and DRAM modules.
Silicon Power offers a very good product liability insurance – any Silicon Power product that causes physical injury or loss of property they will take full responsibility. This, in addition to the life time warranty offered on their products shows their commitment of quality to their global customers.
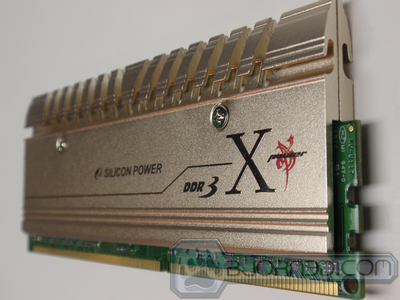
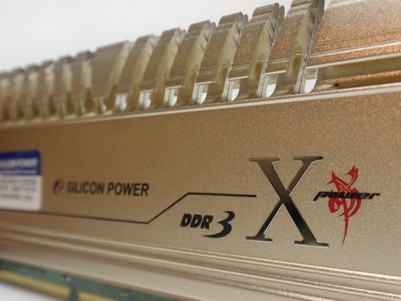
The XPower DDR3 2000 RAM achieves its speed by overclocking, and is equipped with an “arrow head” heat sink to help with heat dissipation as shown in the schematic below.
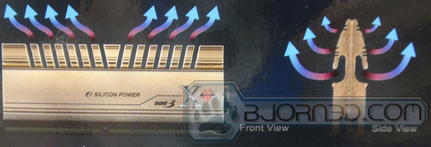
This aluminum heat sink design is supposed to dissipate about 21% more heat than standard DDR3 modules (Silicon Power reports 38˚C versus 48˚C under load). We will be testing this claim later in the review.
The heat sinks make the modules nearly 2″ high, which could cause problems with some large CPU heatsinks.


Taking a closer look
The two modules are nicely placed in a plastic insert, which is itself placed in a cardboard box with a transparent window on the front, so buyers can see the sticks. The back of the box shows additional information about the memory.


The RAM is snugly packaged in the standard plastic, but does not come with any sort of guide or user manual. This is alarming, as even the most basic of products comes with some sort of documentation from the manufacturer.
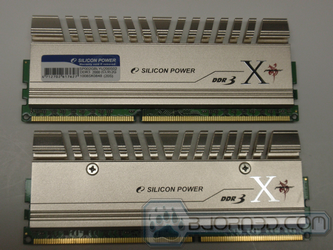

The heat sink actually is made of two plates that are held in place by two screws.
The following photograph shows a close up of the fins, whose arrow-head design serves to increase surface area and aid heat loss.

Features and specifications
| Features and Specifications Silicon Power DDR3 2000 Dual Channel RAM |
|---|
| 240-pin, unbuffered dual in-line memory module (UDIMM) |
| Fast data transfer rates: PC3-16000 |
| 2GB (256 Meg x 64) |
| Nominal and dynamic on-die termination (ODT) for data, strobe, and mask signals |
| Dual rank |
| VDD = VDDQ = +1.65V |
| VDDSPD = +3.0V to +3.6V |
| Reset pin for improved system stability |
| Fixed burst chop (BC) of 4 and burst length (BL) of 8 via the mode register set (MRS |
| Adjustable data-output drive strength |
| Serial presence-detect (SPD) EEPROM |
| Gold edge contacts |
| Pb-free |
| Fly-by topology |
| Terminated control, command, and address bus |
We will explain some of the features below:
The Xpower series uses an 8-layered PCB and fly-by topology design for more efficient commands, addresses, control signals, and clock signals. The fly-by topology is standard for DDR3 RAM, as it operates at a higher speed than DDR2 RAM. This module signal path can be tuned to match each DRAM (DDR2 uses T branch topology) and helps with signal integrity which becomes more problematic as speed increases. The Fly-by timing technology allows the system to be calibrated each time the computer starts.
The modules are unbuffered (as opposed to registered). Unbuffered RAM uses a single “fly-by” path whilst registered modules use a T-split path to send the signal to the DRAM which increases complexity.
The main benefit of DDR3 comes from the higher bandwidth made possible by DDR3’s 8-burst-deep pre-fetch buffer in contrast to DDR2’s 4-burst-deep or DDR2’s 2-burst-deep prefetch buffer.
An inclusion of a reset pin is not custom made to Silicon Power’s DDR3 Xpower modules, but is standard for DDR3.
The RAM operates at 1.65v to increase stability at higher speeds with two XMP Profiles stored on its EEPROM (a type of non-volatile memory to store timings etc). The profiles are DDR3 1800 with timings 9-9-9-24 and DDR3 2000 with timings 9-9-9-27.
MEMORY TIMINGS EXPLAINED
Memory timings can be very confusing, so we are explaining them here before continuing on. Let’s start off with the numbers we usually see on a memory DIMM’s sticker: the timings. Memory timings are what ultimately decide how far a memory DIMM will overclock and perform. The lower number(s) the timings are, the better performance the memory modules will get. A 9-9-9-24 rated timing kit is a common timing on affordable DDR3 memory kits. Anything below those common timings will result in a higher price tag due to faster performance. So what do those numbers really mean? First, we need to explain what numbers relate and correspond to.
There are four main timings that heavily effect memory performance:
CAS Latency (tCL), RAS to CAS Delay (tRCD), Row Precharge Time (tRP), and RAS Active Time (tRAS).
For this explanation, we will use the Silicon Power XPower DDR3 2000 memory module’s, 9-9-9-27 timings.
CAS Latency Time (tCL) 9-9-9-27
CAS stands for Column Address Strobe. Latency is the amount of time taken to respond. The lower the CAS Latency value, the faster the memory controller and modules communicate. The memory controller communicates with individual modules on the DIMM’s requesting data in cycles.
RAS to CAS Delay Time (tRCD) 9-9-9-27
RAS stands for Row Address Strobe and CAS stands for Column Address Strobe. The RAS to CAS Delay value is the amount of time in cycles it takes to perform a task requested by the memory controller.
Row Precharge Time (tRP) 9-9-9-27
The Row Precharge value is the amount of time in cycles needed for the Row Address Strobe (RAS) to collect before another row can be utilized. This acts almost like a queue in a sense.
RAS Active Time (tRAS) 9-9-9-27
RAS stands for Row Address Strobe. RAS Active Time is the amount of time (in cycles) between a row being occupied by Row Precharge (tRP) and unoccupied.
All timings are measured in nanoseconds (ns). The lower the value for each timing, the faster the memory modules can work together and report back whatever was requested from the memory controller/processor.
testing and methodology
In the interests of thoroughness and accurate results, we ran each test at least three times, and some tests more than that. We average the total of all the tests from each benchmark then report the average here.
The OS used was Windows 7 Home Premium 64bit with all patches and updates applied. We also use the latest drivers available for the motherboard and any devices attached to the computer. We do not disable background tasks or tweak the OS or system in any way. We turn off drive indexing and daily defragging. We also turn off Prefetch and Superfetch. This is not an attempt to produce bigger benchmark numbers. Drive indexing and defragging can interfere with testing and produce confusing numbers. If a test were to be run while a drive was being indexed or defragged, and then the same test was later run when these processes were off, the two results would be contradictory and erroneous. As we cannot control when defragging and indexing occur precisely enough to guarantee that they won’t interfere with testing, we opt to disable the features entirely.
The following hardware was used in the testing:
| Hardware | |
|---|---|
| Case |
Coolermaster HAF 912 |
| CPU |
Intel Core i7 950 @ 4.0 GHz D0 stepping |
| Motherboard |
ASRock Extreme 6 X58 |
| RAM |
Mushkin Silverline DDR3 1600 MHz (7-10-10-24) Triple Channel Mushkin Silverline DDR3 1600 MHz (7-10-10-24) Dual Channel Silicon Power Xpower DDR3 1600 (9-9-9-24) Silicon Power Xpower DDR3 1820 (9-9-9-24) Silicon Power Xpower DDR3 2000 (9-12-10-27) Silicon Power Xpower DDR3 2088 (9-12-10-27) |
| Hard Drive |
OCZ Vertex 120 GB for OS and applications |
| Optical Drive |
LG Blue Ray ROM/ DVD burner |
| GPU | 2 x Galaxy GTX 470 GC at 651 MHz in SLI |
| Case Fans |
2 x Coolermaster Megaflow 200mm 1 x Coolermaster 140mm 1 x Coolermaster 120mm |
| Power Supply | OCZ Z series Gold 850W |
The following benchmarks were used to measure the performance of the Silicon Xpower DDR3 2000 RAM:
| Benchmarks |
|---|
|
AIDA64 |
|
SiSoft Sandra 2010 |
|
Super PI |
|
WinRar V3.93 |
|
3D Mark Vantage |
|
PCMark Vantage |
| Excel 2010 |
| Unigine Heaven Benchmark V2.1 |
| Left4dead 2 |
In September 2010 the Hungarian branch of Everest split and formed a new company called FinalWire. Their goal was to further develop the Everest software that was such a huge success in the computer enthusiast community.
The user interface is the same as Everest and, still has the same benchmarking and monitoring capabilities but with 64 bit support, which allows it to work with up to 32 processing cores simultaneously and has support for solid state drives.
We looked at memory read, write, copy and latency in this test. Let us see how the RAM faired.
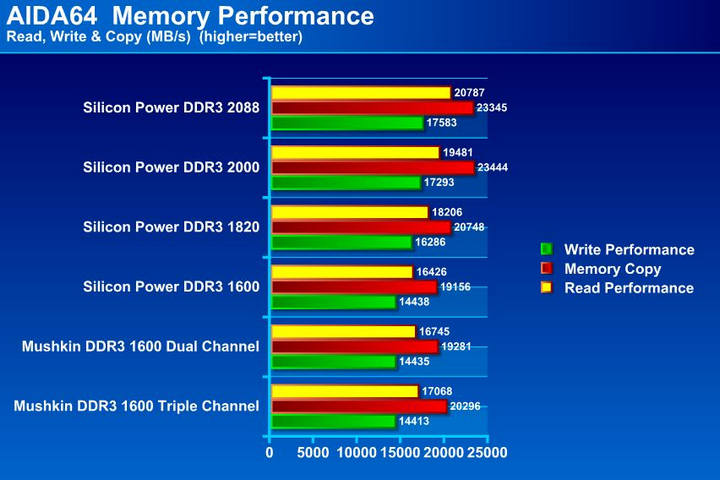
Triple channel performance was generally ahead of the same RAM in a dual channel configuration, so it would have been interesting to test Silicon Power’s DDR3 2000 triple channel modules alongside their dual channel counterparts. At 1600 MHz the Silicon Power RAM performed on par with the Mushkin RAM at the same speed as one would expect, there was only a slightly better copy and write performance possibly attributed to the lower CAS of the Mushkin RAM.
As the speed of the Silicon Power modules was increased, we observed a nice performance boost. Increasing the clock speed from 1600 MHz to 2000 MHz (25%) showed a 20% higher score. Overclocking to 2088 MHz (a 4.4% increase) resulted in a 3% higher score.
The next chart shows how the memory latency compared:
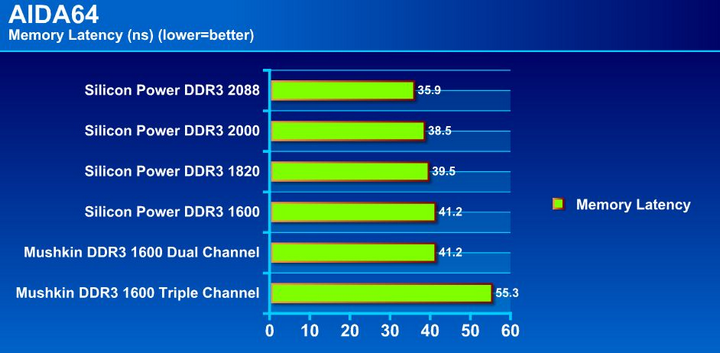
It was very interesting to see that the triple channel Mushkin RAM had a much higher latency than when it was run in dual channel mode. The Silicon Power RAM at 1600 MHz had a CAS of 9, as compared to 7 on the Mushkin RAM. The RAM CAS value had no effect on latency, however when the modules were overclocked there was a marked improvement.
Sisoft sandra 2010
“SiSoftware Sandra (the System Analyser, Diagnostic and Reporting Assistant) is an information & diagnostic utility. It should provide most of the information (including undocumented) you need to know about your hardware, software and other devices whether hardware or software. It works along the lines of other Windows utilities, however it tries to go beyond them and show you more of what’s really going on. Giving the user the ability to draw comparisons at both a high and low-level. You can get information about the CPU, chipset, video adapter, ports, printers, sound card, memory, network, Windows internals, AGP, PCI, PCI-X, PCIe (PCI Express), database, USB, USB2, 1394/Firewire, etc. Their memory benchmark measures sustained memory bandwidth, not burst or peak. Sandra uses dynamic data in its memory benchmarking (40-60% of physical system RAM)”
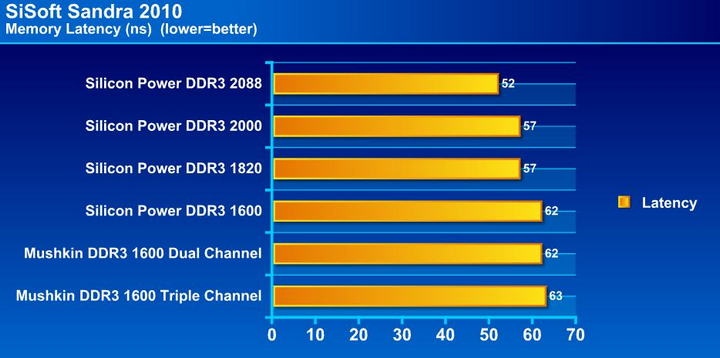
The difference in latency between triple channel and dual channel was not so pronounced here, and the main factor was clock speed – the faster the RAM, the lower the latency. Going from 1600 MHz to 2088 MHz netted a 16% decrease in latency.
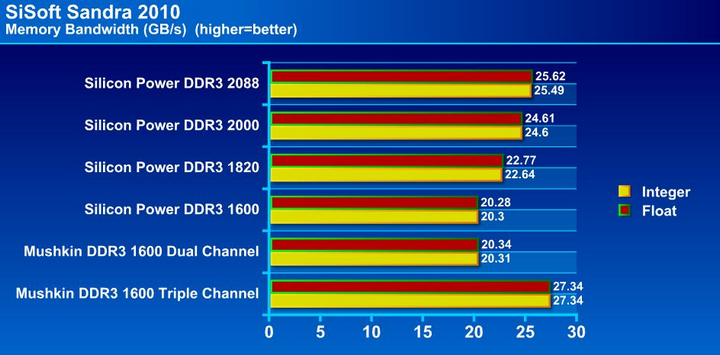
Naturally, operating in triple channel mode resulted in a high gain of bandwidth, and this is why Intel’s upcoming socket 2011 (replacing socket 1366 in Q3 2011) is quad channel, and will help ensure there is no memory bottleneck for the new processors.
Based on benchmark results, we had to wonder to wonder if we were even close to saturating three channels.
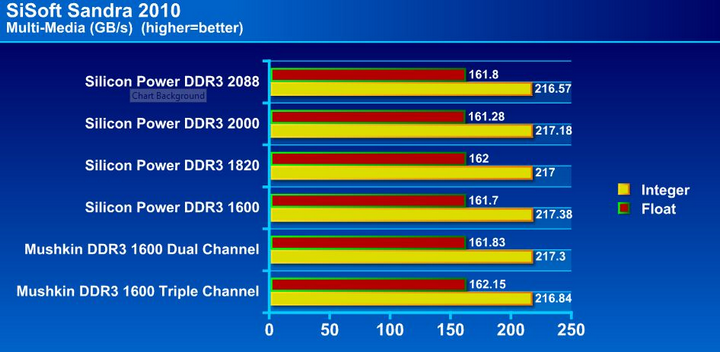
This benchmark generates a picture (640 x 480) of the well known Mandelbrot fractal, using 255 iterations for each data pixel, in 32 colors. It is a real-life benchmark rather than a synthetic benchmark, designed to show the improvements MMX/Enhanced, 3DNow!/Enhanced, SSE(2) bring to such an algorithm. This benchmark is multi-threaded for up to 64 CPUs. The results are in Mandelbrot Iterations per Second x 1000, thus an index of 1000 means that 1 iteration has been completed in 1 second.
Neither RAM clock speed or channel configuration has an affect on this benchmark.
Super PI
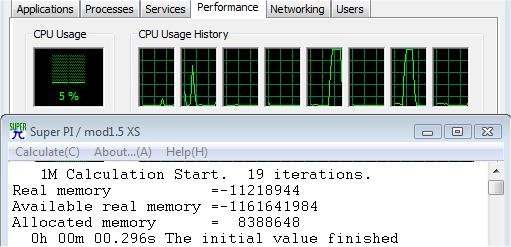
“Super PI is the “Gold standard” for many when it comes to judging system performance. We ran the 4 Meg calculation, again running each test three times and reporting the average of the results.”
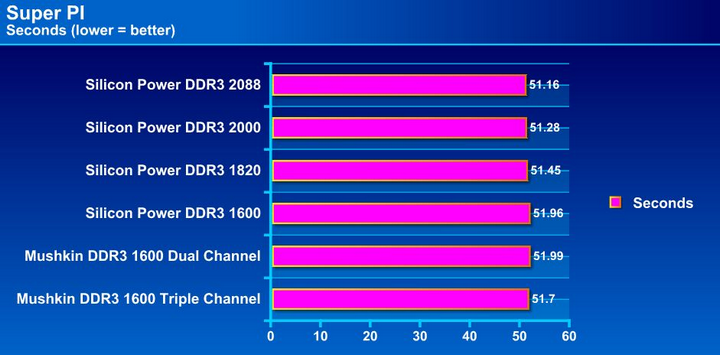
RAM speed has no effect on the PI calculation – it is more CPU dependent. All the memory kits performed within 1 second of each other.
Winwar v3.93
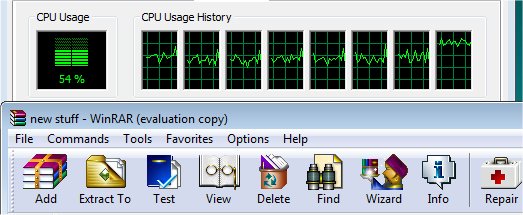
This module in WinRar generates random data, which contains specially introduced redundancy, increasing the load to both the processor and memory. Data is then passed through RAR compression and decompression algorithms, and the output of the decompression algorithm is compared to the source data. If any differences are found, WinRar then reports “Errors found – Yes” in the command window. WinRar displays a size of processed data and compression speed, current and resulting, in kilobytes per second.
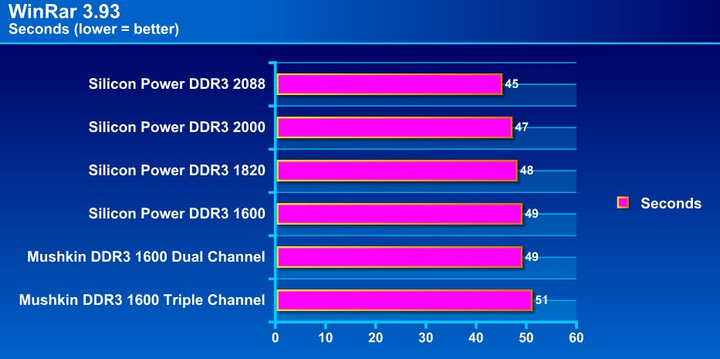
For users who perform large file compressions / decompressions, going for a fast dual channel set up will pay huge dividends. Users should also consider choosing a Socket 1156 over a Socket 1366, since the former uses dual channel RAM. Running RAM at 2000 MHz results in a 4% improvement compared to RAM at 1600 MHz. Overclocking to 2088 MHz yielded another 4%.

For complete information on 3DMark Vantage Please follow this Link:
www.futuremark.com/benchmarks/3dmarkvantage/features/
The newest video benchmark from the gang at Futuremark. This utility is still a synthetic benchmark, but one that more closely reflects real world gaming performance. While it is not a perfect replacement for actual game benchmarks it is useful to see if the speed of the RAM is sufficient to feed two GTX 470‘s in SLI.
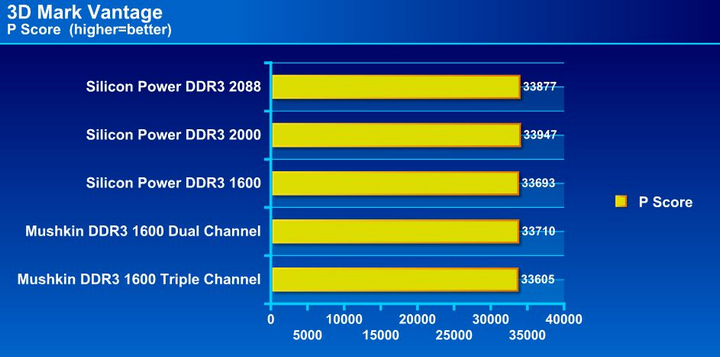
Looking at the results above, it is clear that RAM speed, channel configuration and timings have no effect on gaming performance. As long as there is sufficient memory bandwidth to feed the system, (current socket 1156 and 1366 set ups are sufficient for this), there should be no issues during gaming.

A PCMark score is a measure of a computer’s performance across a variety of common tasks such as viewing and editing photos, video, music and other media, gaming, communications, productivity and security. It is a good way to find out which (if any) hardware is bottlenecking a system.
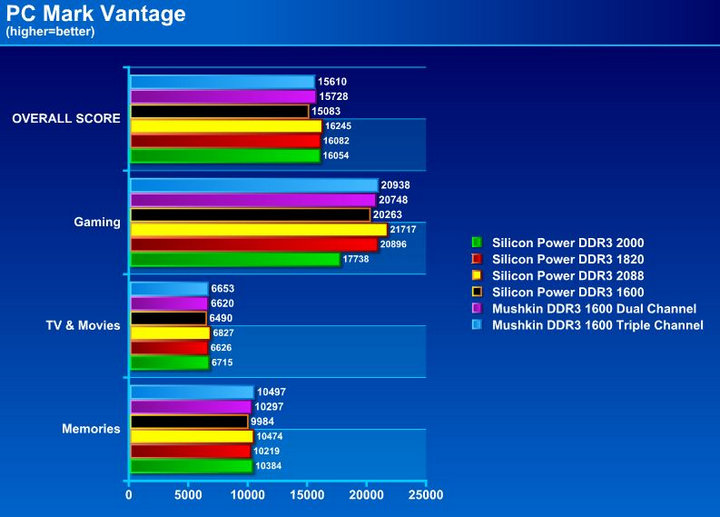
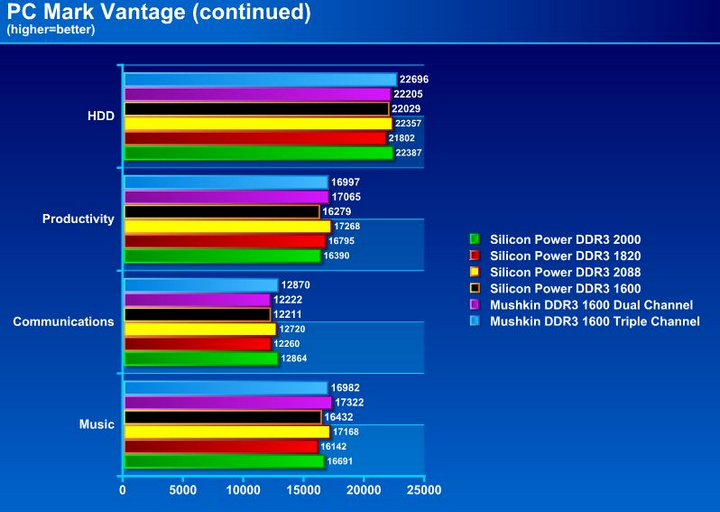
Increasing the speed of the RAM saw a general increase across the board. Increasing the clock speed from 1600 MHz to 2088 MHz (a 30.5% increase), we saw an overall improvement of 7.7% in performance. Video, photo and music manipulation all benefit from having faster RAM.
Microsoft Excel 2010
Microsoft Excel is the widely known and most used spreadsheet application for the manipulation and calculation for number crunching. With Excel you can analyze and share information on small scale or the largest scale you can imagine. We’ve seen spreadsheets in every day use that contain literally tens of thousands of numbers and hundreds of equations. Here we run two benchmarks – The Monte Carlo Black-Scholes Option Pricing Test and The Big Number Crunch Test.
Monte Carlo Black-Scholes Option Pricing
The Black-Scholes model is used to calculate a theoretical call and put price using the five key determinants of an option’s price: stock price, strike price, volatility, time to expiration, and short-term (risk free) interest rate. The workload is execution of approximately 300,000 iterations of Monte Carlo simulation using the Black-Scholes basic option pricing formula in Microsoft Excel 2010. In addition, the workload uses Excel lookup functions to compare the put price from the model with the historical market price for 50,000 rows to understand the convergence. The input file is a 70.1 MB spreadsheet.
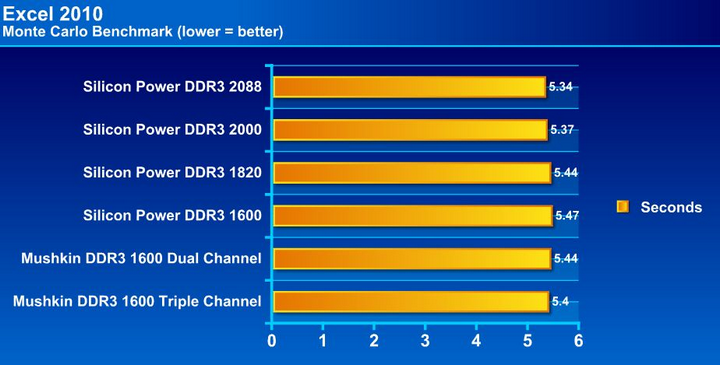
Increasing the speed of the RAM helped slightly, but did not create any noticeable performance gains.
The Big Number Crunch
The workload is execution of approximately 28,000 sets of calculations using the most commonly used calculations and functions in Microsoft Excel. These include common arithmetic operations like addition, subtraction, division, rounding and square root. It also includes common statistical analysis functions such as Max, Min, Median and Average. The input file is a 6.2 MB spreadsheet.
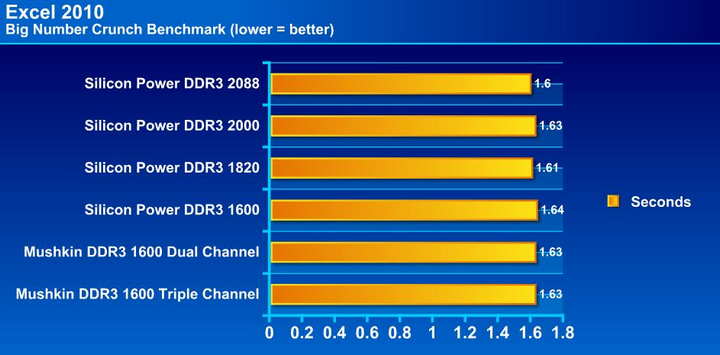
We see the same situation here: the faster the RAM, the faster the calculations are performed – but only marginally. For users who deal extensively with Excel, investing in higher speed RAM would not be a cost effective investment.
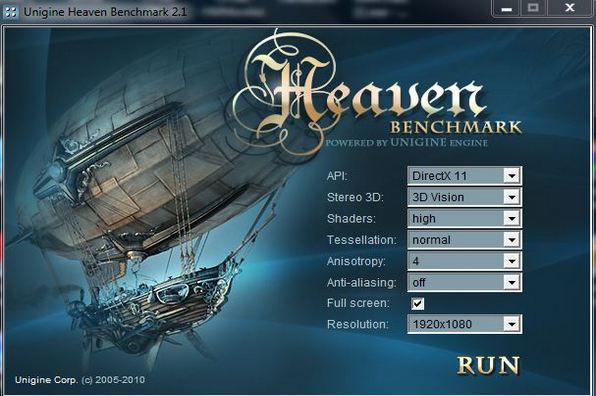
Unigine heaven 


Unigine Heaven is a benchmark program based on Unigine Corp’s latest engine, Unigine. The engine features DirectX 11, Hardware tessellation, DirectCompute, and Shader Model 5.0. All of these new technologies combined with the ability to run each card through the same exact test means this benchmark should be in our arsenal for a long time.
The settings used are below, the only change between runs being the enabling / disabling of the 3D vision setting (and doing the same in the Nvidea control panel).
The test set up was using 2 x GTX 470’s in SLI providing enough graphics horsepower to satisfy most enthusiasts. Such a set up requires a lot of data to keep the pipeline filled but as we have seen in the synthetic benchmarks increasing the RAM speed had little effect on gaming performance. To stress the cards further we enabled stereoscopic 3D to compare against regular 2D mode.
We decided to test two games/benchmarks from different ends of the graphical spectrum – Unigine Heaven with DX 11 and tessellation enabled to provide the extreme end of the testing and Left4Dead 2, based on the aging Source Engine, to represent a title that would be less dependent on the graphics card.
Since an enthusiast would play games at a high resolution all tests were done at 1920 x 1080
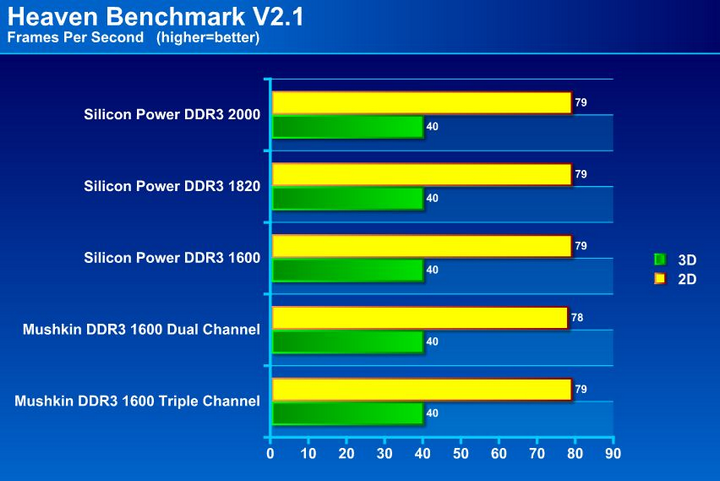
Memory speed, timings or channel configuration had no effect on the frames per second achieved. The results were almost the same across the board.
Left4dead 2

For Left4Dead 2, all graphics settings were set at the maximum.
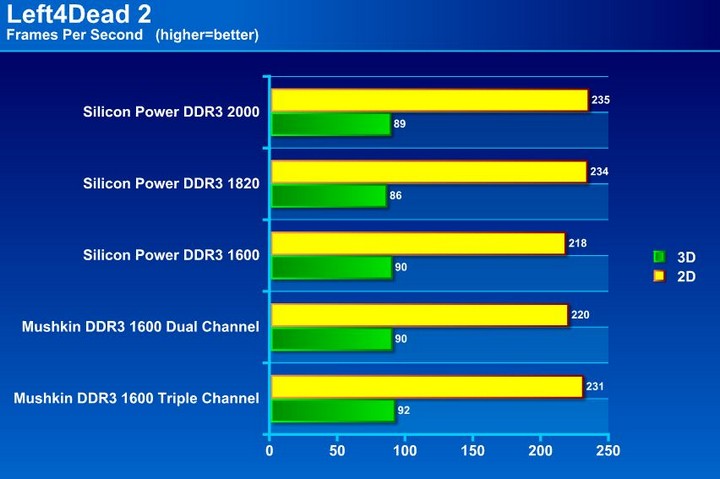
The RAM had little effect, if any, on gaming performance. We could argue that since Left4Dead 2 is less GPU dependent, it was impacted when run at dual channel settings (1600MHz), and benefited at triple channel settings, however the performance difference was unnoticeable in gameplay.
Switching to 3D or a more GPU dependent game confirmed that the graphics horsepower was the major determining in performance.
Temperatures

As mentioned earlier in the review, Silicon Power claims that the aluminum heat sinks dissipate heat far more readily than standard heat sinks, which would translate to 21% lower temperatures.
In order to measure the temperatures of the RAM, an infrared thermometer was used. The thermometer uses a laser beam to easily measure the heat emitted. We measured from the location for each test, and had a measurement ratio of 5:1, which means that a 1″ area could be measured from as far as 5″ away. For this test, we measured as close as possible to the RAM modules, certainly less than 5″ away. The thermometer scans the temperature and records the highest that it detects.
The modules were stressed using PCMark Vantage and TV/Movies benchmark for 20 minutes and the temperature, in celsius, was recorded.

Trusty infrared thermometer
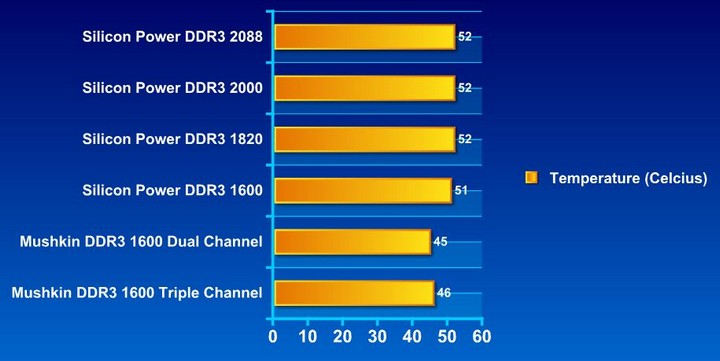
At first glance, one would conclude that the Silicon Power modules were actually running hotter than the Mushkin modules. It is important to remember, though, that the temperature recorded only shows the amount of heat being emitted from the heatsinks, and not necessarily the actual temperature of the chips below.
If we look at both sets of RAM clocked at 1600 MHz, both at 1.65v, the Silicon Power RAM shows a 6 degree C higher temperature.
It could mean one of two things:
a) The RAM chips are running cooler on the Mushkin RAM
b) The Silicon Power heatsinks are emitting more heat because of their larger surface area.
We are inclined to think that the latter is the cause of the discrepancy, as we doubt that the two sets of chips would differ so greatly.
The only true way to detect the actual temperatures of the chips would be to remove the heatsinks, which was not possible for this review.
One thing to note is that when the Silicon Power RAM is overclocked to 2088 MHz, the temperature only goes up one degree.
conclusion
Silicon Power’s overclocking XPower series performs as advertised, although getting to a stable performance at the default speed was not straight forward. The XMP profiles did not work for us, and In an ideal world, the XMP profiles should work the first time, and if they don’t, then the manufacturer should provide some guideline in the box as to what voltages the IOH and VTT need to be set to.
Once the Silicon RAM achieves a stable setting though, it performs very well in synthetic benchmarks, heavy compression environments, and photo/music/video manipulation work while staying relatively cool.
Reviewer’s Opinion:
In general, this is a well performing kit, for those who really need that extra punch in the memory area. If you don’t fit the demographic above, then this RAM does not bring anything extra to the table. If you are a gamer your money would be better spent on a better graphics card. This is not a black mark against the product itself, as the same would hold true for all brands of RAM.
Editor’s Opinon:
I was disappointed at the lack of documentation this kit provides, especially considering the difficulty our labs had in getting this kit to a stable setting at 2000MHz. Potential buyers, especially ones unfamiliar with tinkering with RAM settings, should definitely keep this in mind when considering whether to buy this kit. I would hope that a company as large as Silicon Power would include better documentation in the future. I am not too sure how the arrowhead heatsink performs in terms of drawing heat away from the chips underneath, but I am intrigued by the design.
| OUR VERDICT: Silicon Power XPower DDR3 2000 | ||||||||||||||||||
|
||||||||||||||||||
| Summary: The Silicon Power XPower DDR3 2000 RAM is well made, and offers solid performance. Though not ground breaking, for those that need high speed RAM, the lifetime warranty makes this product a good choice. |