The PNY GTX-470 features great performance at a more affordable price than the GTX-480 and carries a Lifetime Warranty.
Introduction
With top end GPU’s running in the $500 price range, stepped down models that offer great performance are popular. The PNY GTX-470 retails for around $350 and features a Limited Lifetime Warranty yet offers most of the performance of the GTX-480 so for price conscious enthusiasts might be a better choice.
With generations of GPU’s flying by picking up one GTX-470 now and another after the next generation launches is an attractive option. One GTX-470 is almost overkill but for those demanding top performance at a less than top price GTX-470 SLI is probably the best option we’ve seen.
With 1.28 GB of memory and a Fermi GF100 core the PNY GTX-470 is a gaming weapon waiting to happen. The DirectX 11 capabilities and heavy AA/AF design make the PNY GTX-470 perfect for today’s gaming needs.
Features & Specifications
| GPU | GTX-480 |
PNY GTX-470 |
GTX-285 | 5850 | 5870 | GTX-295 | 5970 |
|---|---|---|---|---|---|---|---|
| Shader units | 480 | 448 | 240 | 1440 | 1600 | 2x 240 | 2x 1600 |
| ROPs | 48 | 40 | 32 | 32 | 32 | 2x 28 | 2x 32 |
| GPU | GF100 | GF100 | GT200b | Cypress | Cypress | 2x GT200b | 2x Cypress |
| Transistors | 3200M | 3200M | 1400M | 2154M | 2154M | 2x 1400M | 2x 2154M |
| Memory Size | 1536 MB | 1280 MB | 1024 MB | 1024 MB | 1024 MB | 2x 896 MB | 2x 1024 MB |
| Memory Bus Width | 384 bit | 320 bit | 512 bit | 256 bit | 256 bit | 2x 448 bit | 2x 256 bit |
| Core Clock | 700 MHz | 607 MHz | 648 MHz | 725 MHz | 850 MHz | 576 MHz | 725 MHz |
| Memory Clock | 924 MHz | 837 MHz | 1242 MHz | 1000 MHz | 1200 MHz | 999 MHz | 1000 MHz |
| Price | $499 | $349 | $340 | $299 | $399 | $500 | $599 |
Product Specifications
- Core Clock: 607 MHz
- Processor Cores: 448
- Processor Clock: 1215 MHz
- Texture Fill Rate: 34.0 Billion/sec.
- Memory Amount: 1280MB GDDR5
- Memory Data Rate, effective: 3348 MHz
- Memory Interface: 320-bit
- Memory Bandwidth: 133.9 GB/sec.
- On-board Outputs: DVI-I, DVI-I, and Mini HDMI
- Additional Outputs Supported: VGA
- Bus Type: PCI Express® 2.0
Key Features
- Microsoft DirectX 11 support
- NVIDIA® CUDA™ technology with CUDA C/C++, DirectCompute 5.0 and OpenCL support
- NVIDIA® PhysX® technology
- NVIDIA® SLI®-Ready
- NVIDIA® 3D Vision™ Surround Ready*
- NVIDIA® PureVideo® HD technology**
- PCI Express 2.0 support
- Two dual-link DVI-I connectors
- One mini-HDMI 1.3a connector
- Dual-link HDCP-Capable***
- OpenGL 3.2 support
Minimum System Requirements
- PCI Express or PCI Express 2.0-compliant motherboard with one dual-width x16 graphics slot
- Two 6-pin PCI Express supplementary power connectors
- Minimum 550W or greater system power supply (with a minimum 12V current rating of 38A)****
- Intel Pentium 4, AMD Athlon XP class processor or higher
- 200MB of available hard disk space
- 2GB system memory (4GB recommended)
- Microsoft Windows XP, Vista, or Windows 7 Operating System (32-bit or 64-bit)
- DVD-ROM drive
Included in the box
- NVIDIA GeForce GTX 470 graphics card
- Quick Installation Guide
- Installation DVD, which includes:
- Detailed installation guide
- NVIDIA® Graphics Drivers
- NVIDIA® GeForce® Demos
- PhysX™ System Software
- – vReveal™ Trial Software One DVI-to-VGA adapter
- One Mini HDMI-to-HDMI adapter
- One 6-pin PCIe to Molex power adapter
Features & Benefits
Microsoft® DirectX® 11 Support
DirectX 11 GPU with Shader Model 5.0 support designed for ultra high performance in the new API’s key graphics feature, GPU-accelerated tessellation.
NVIDIA PhysX® Technology
Full support for NVIDIA PhysX technology, enabling a totally new class of physical gaming interaction for a more dynamic and realistic experience with GeForce.
NVIDIA® 3D Vision™ Ready
GeForce GPU support for NVIDIA 3D Vision, bringing a fully immersive stereoscopic 3D experience to the PC. A combination of high-tech wireless glasses and advanced software, 3D Vision transforms hundreds of PC games into full stereoscopic 3D. In addition, you can watch 3D movies and 3D digital photographs in eye popping, crystal-clear quality.
NVIDIA® 3D Vision™ Surround Ready (1)
Expand your games across three displays in full stereoscopic 3D for the ultimate “inside the game” experience with the power of NVIDIA 3D Vision and SLI technologies. NVIDIA® Surround™ also supports triple screen gaming with non-stereo displays.
NVIDIA CUDA™ Technology (2)
CUDA technology unlocks the power of the GPU’s processor cores to accelerate the most demanding tasks such as video transcoding, physics simulation, ray tracing, and more, delivering incredible performance improvements over traditional CPUs.
3-way NVIDIA SLI® Technology (3)
Industry leading 3-way NVIDIA SLI technology offers amazing performance scaling by implementing 3-way AFR (Alternate Frame Rendering) for the world’s premier gaming solution under Windows 7 with solid, state-of-the-art drivers.
32x Anti-aliasing Technology
Lightning fast, high-quality anti-aliasing at up to 32x sample rates obliterates jagged edges.
Microsoft Windows 7 Support
Windows 7 is the next generation operating system that will mark a dramatic improvement in the way the OS takes advantage of the graphics processing unit (GPU) to provide a more compelling user experience. By taking advantage of the GPU for both graphics and computing, Windows 7 will not only make today’s PCs more visual and more interactive but also ensure that they have the speed and responsiveness customers want.
DirectCompute Support
Full support for DirectCompute, Microsoft’s GPU computing API.
OpenCL Support
Full support for OpenCL GPU computing API.
OpenGL® 3.2 Optimization and Support
Designed for the new PCI Express 2.0 bus architecture offering the highest data transfer speeds for the most bandwidth-hungry games and 3D applications, while maintaining backwards compatibility with existing PCI Express motherboards for the broadest support.
PCI Express 2.0 Support
DirectX 11 GPU with Shader Model 5.0 support designed for ultra high performance in the new API’s key graphics feature, GPU-accelerated tessellation.
NVIDIA® GeForce® Unified Driver Architecture (UDA)
Delivers a proven record of compatibility, reliability, and stability with the widest range of games and applications. NVIDIA® GeForce® drivers provide the best out-of-box experience for every user and deliver continuous performance and feature updates over the life of NVIDIA GeForce® GPUs.
Dual-link DVI Support
Able to drive industry’s largest and highest resolution flat-panel displays up to 2560×1600 and with support for High-bandwidth Digital Content Protection (HDCP).
HDMI 1.3a Support
Fully integrated support for HDMI 1.3a including xvYCC, Deep color and 7.1 digital surround sound.
NVIDIA® PureVideo® HD Technology (4)
The combination of high-definition video decode acceleration and post-processing that delivers unprecedented picture clarity, smooth video, accurate color, and precise image scaling for movies and video.
Hardware Decode Acceleration
Provides ultra-smooth playback of H.264, VC-1, WMV, DivX, MPEG-2 and MPEG-4 HD and SD movies without the need for a dual or quad-core CPU.
Dual-stream Hardware Acceleration
Supports picture-in-picture content for the ultimate interactive Blu-ray and HD DVD movie experience.
Dynamic Contrast Enhancement & Color Stretch
Provides post-processing and optimization of High Definition movies on a scene by scene basis for spectacular picture clarity.
Dual-link HDCP Capable (5)
Designed to meet the output protection management (HDCP) and security specifications of the Blu-ray Disc format, allowing the playback of encrypted movie content on PCs when connected to HDCP-compliant displays.
Enhanced Error Resilience
Correct errors or losses in broadcast content to ensure crisp, high quality playback.
Advanced Spatial-Temporal De-Interlacing
Sharpens HD and standard definition interlaced content on progressive displays, delivering a crisp, clear picture that rivals high-end home-theater systems.
Inverse Telecine (3:2 & 2:2 Pulldown Correction)
Recovers original film images from films-converted-to-video (DVDs, 1080i HD content), providing more accurate movie playback and superior picture quality.
Bad Edit Correction
When videos are edited, the edits can disrupt the normal 3:2 or 2:2 pulldown cadence. PureVideo uses advanced processing techniques to detect poor edits, recover the original content, and display perfect picture detail frame after frame for smooth, natural looking video.
Noise Reduction
Improves movie image quality by removing unwanted artifacts.
Edge Enhancement
Sharpens movie images by providing higher contrast around lines and objects.
1 – NVIDIA 3D Vision Surround requires NVIDIA release 256 driver, two or more graphics cards in NVIDIA SLI configuration, 3D Vision glasses and three matching 3D Vision-Ready displays. See www.nvidia.com/surround for more information.
2 – Requires application support for CUDA technology.
©2010 NVIDIA Corporation. NVIDIA, the NVIDIA logo, PhysX, CUDA, SLI, 3D Vision, 3D Vision Surround, and GeForce are trademarks and/or registered trademarks of NVIDIA Corporation in the United States and other countries. All other trademarks are the property of their respective owners. All rights reserved.
Straight from Nvidia’s Mouth
This next section is Nvidia’s eloquent explanation on Fermi and its design. We could reword it and toss in a few comments and claim it as our own but frankly that would be a disservice to the fine folks over at Nvidia that came up with it. Let’s give credit where credit is due and if we have any comments to toss in this section, they will be in bold type.
NVIDIA’s Next Generation CUDA Compute and Graphics Architecture, Code-Named “Fermi”
The Fermi architecture is the most significant leap forward in GPU architecture since the original G80. G80 was our initial vision of what a unified graphics and computing parallel processor should look like. GT200 extended the performance and functionality of G80. With Fermi, we have taken all we have learned from the two prior processors and all the applications that were written for them, and employed a completely new approach to design to create the world’s first computational GPU. When we started laying the groundwork for Fermi, we gathered extensive user feedback on GPU computing since the introduction of G80 and GT200, and focused on the following key areas for improvement:
Improve Double Precision Performance—while single precision floating point performance was on the order of ten times the performance of desktop CPUs, some GPU computing applications desired more double precision performance as well.
- ECC support ECC allows GPU computing users to safely deploy large numbers of GPUs in datacenter installations, and also ensure data-sensitive applications like medical imaging and financial options pricing are protected from memory errors.
- True Cache Hierarchy some parallel algorithms were unable to use the GPU’s shared memory, and users requested a true cache architecture to aid them.
- More Shared Memory many CUDA programmers requested more than 16 KB of SM shared memory to speed up their applications.
- Faster Context Switching users requested faster context switches between application programs and faster graphics and compute interoperation.
- Faster Atomic Operations users requested faster read-modify-write atomic operations for their parallel algorithms.
With these requests in mind, the Fermi team designed a processor that greatly increases raw compute horsepower, and through architectural innovations, also offers dramatically increased programmability and compute efficiency. The key architectural highlights of Fermi are:
- Third Generation Streaming Multiprocessor (SM)
- 32 CUDA cores per SM, 4x over GT200
- 8x the peak double precision floating point performance over GT200
- Dual Warp Scheduler simultaneously schedules and dispatches instructions from tw
- independent warps
- 64 KB of RAM with a configurable partitioning of shared memory and L1 cache
- Second Generation Parallel Thread Execution ISA
- Unified Address Space with Full C++ Support
- Optimized for OpenCL and DirectCompute
- Full IEEE 754-2008 32-bit and 64-bit precision
- Full 32-bit integer path with 64-bit extensions
- Memory access instructions t
- support transition t
- 64-bit addressing
- Improved Performance through Predication
- Improved Memory Subsystem
- NVIDIA Parallel DataCacheTM hierarchy with Configurable L1 and Unified L2 Caches
- First GPU with ECC memory support
- Greatly improved atomic memory operation performance
- NVIDIA GigaThreadTM Engine
- 10x faster application context switching
- Concurrent kernel execution
- Out of Order thread block execution
- Dual overlapped memory transfer engines
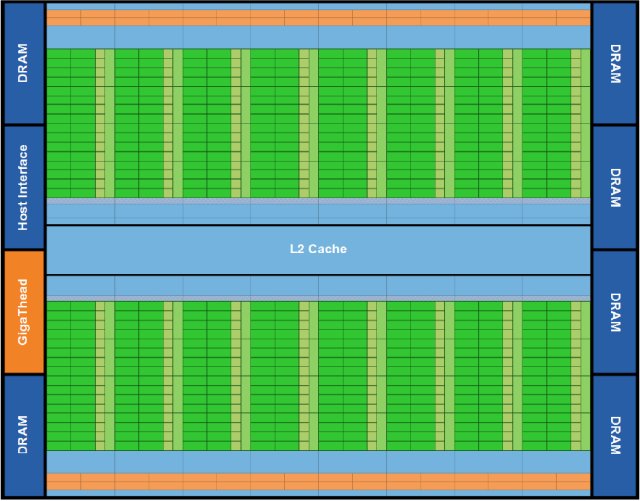
An Overview of the Fermi Architecture
The first Fermi based GPU, implemented with 3.0 billion transistors, features up to 512 (GTX-480 has 480 cores exposed but has a total of 512 cores so we may see an enthusiast line with all 512 cores exposed at a later date, but notice the “up to 512 CUDA cores Nvidia let slip in the document) CUDA cores. A CUDA core executes a floating point or integer instruction per clock for a thread. The 512 CUDA cores are organized in 16 SMs of 32 cores each. The GPU has six 64-bit memory partitions, for a 384-bit memory interface, supporting up to a total of 6 GB of GDDR5 DRAM memory. A host interface connects the GPU to the CPU via PCI-Express. The GigaThread global scheduler distributes thread blocks to SM thread schedulers.
Third Generation Streaming Multiprocessor
The third generation SM introduces several architectural innovations that make it not only the most powerful SM yet built, but also the most programmable and efficient.
512 High Performance CUDA cores Each SM features 32 CUDA processors—a fourfold increase over prior SM designs. Each CUDA processor has a fully pipelined integer arithmetic logic unit (ALU) and floating point unit (FPU). Prior GPUs used IEEE 754-1985 floating point arithmetic. The Fermi architecture implements the new IEEE 754-2008 floating-point standard, providing the fused multiply-add (FMA) instruction for both single and double precision arithmetic. FMA improves over a multiply-add (MAD) instruction by doing the multiplication and addition with a single final rounding step, with no loss of precision in the addition. FMA is more accurate than performing the operations separately. GT200 implemented double precision FMA.
In GT200, the integer ALU was limited to 24-bit precision for multiply operations; as a result, multi-instruction emulation sequences were required for integer arithmetic. In Fermi, the newly designed integer ALU supports full 32-bit precision for all instructions, consistent with standard programming language requirements. The integer ALU is also optimized to efficiently support 64-bit and extended precision operations. Various instructions are supported, including Boolean, shift, move, compare, convert, bit-field extract, bit-reverse insert, and population count.
16 Load/Store Units
Each SM has 16 load/store units, allowing source and destination addresses to be calculated for sixteen threads per clock. Supporting units load and store the data at each address to cache or DRAM.
Four Special Function Units
Special Function Units (SFUs) execute transcendental instructions such as sin, cosine, reciprocal, and square root. Each SFU executes one instruction per thread, per clock; a warp executes over eight clocks. The SFU pipeline is decoupled from the dispatch unit, allowing the dispatch unit to issue to other execution units while the SFU is occupied.
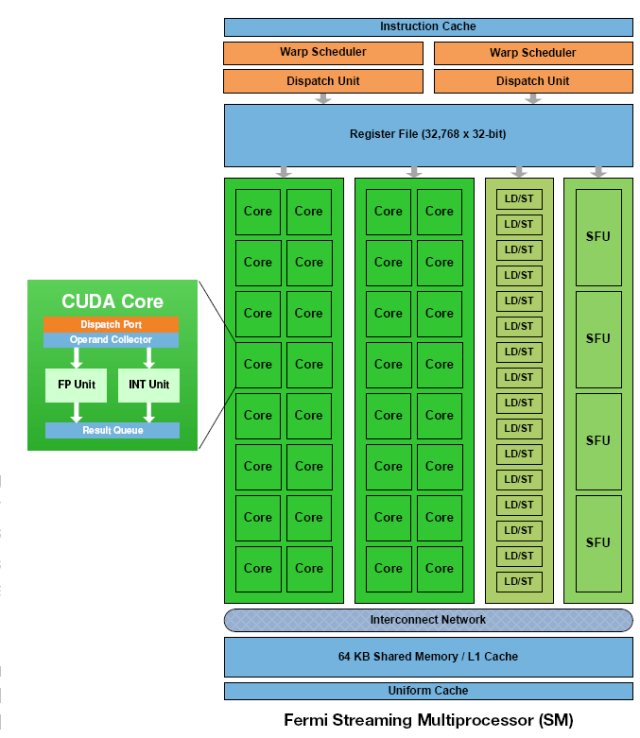
Fermi’s 16 SM are positioned around a common L2 cache. Each SM is a vertical rectangular strip that contain an orange portion (scheduler and dispatch), a green portion (execution units), and light blue portions (register file and L1 cache).
Pictures & Impressions
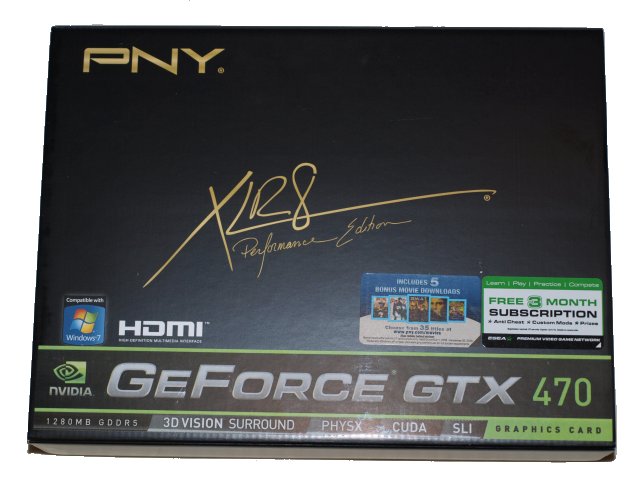
PNY uses a nice black box with plenty of information and specifications to help inform the consumer about it’s purchase.
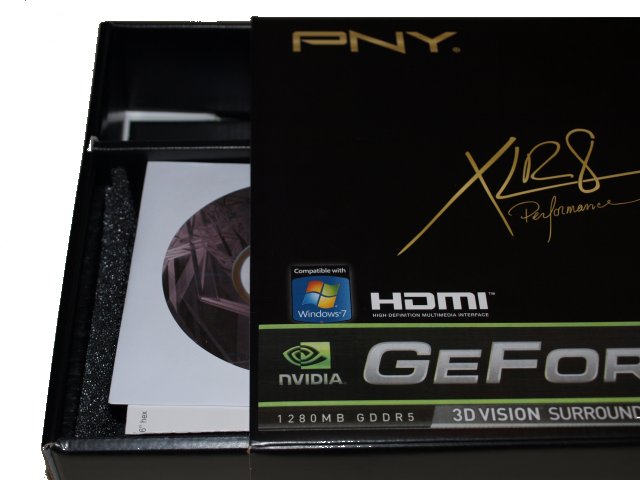
We don’t know about anyone else but considering a $350 – $500 GPU is a major investment for most of us so we’d much prefer to see a full interior box. This open interior box design leaves the GPU open to more movement which can damage it or the sticker on it.
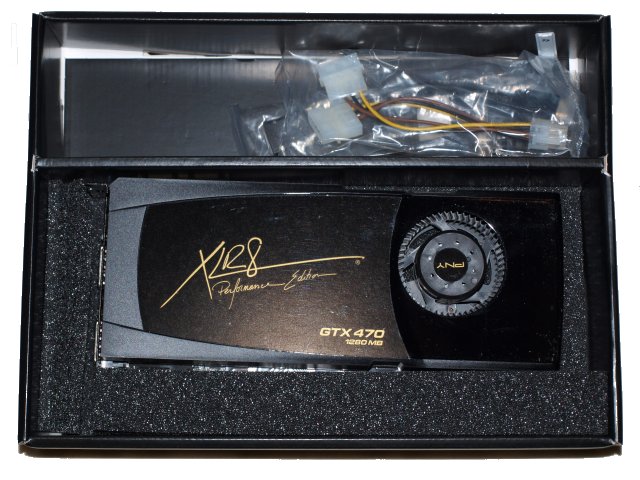
We were surprised by the lack of an Anti-Static bag and no foam on top the GPU to protect it. It seems like with the open interior box you would want an Anti-Static bag and top foam.
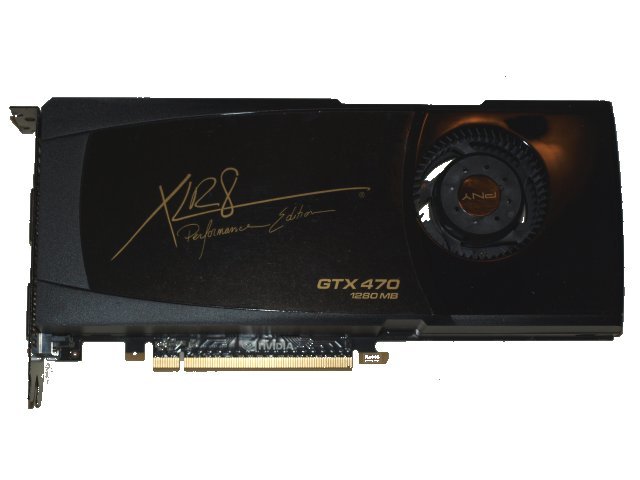
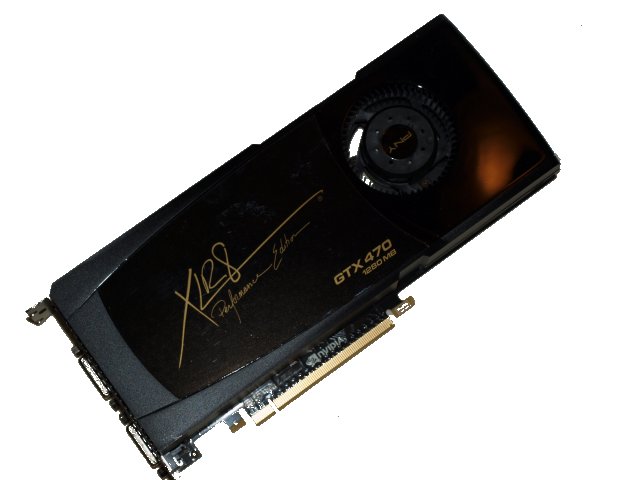
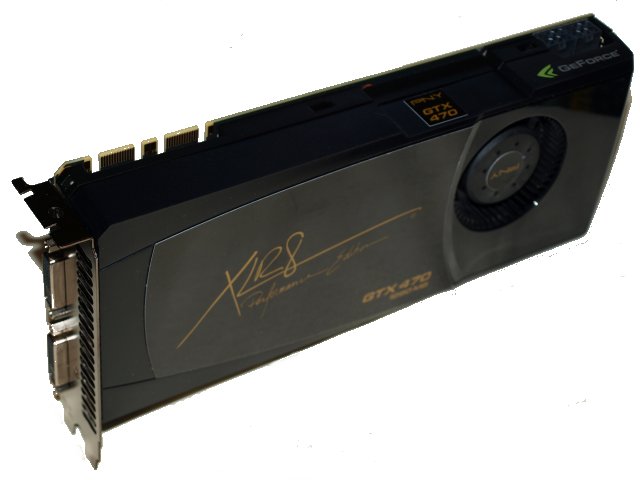
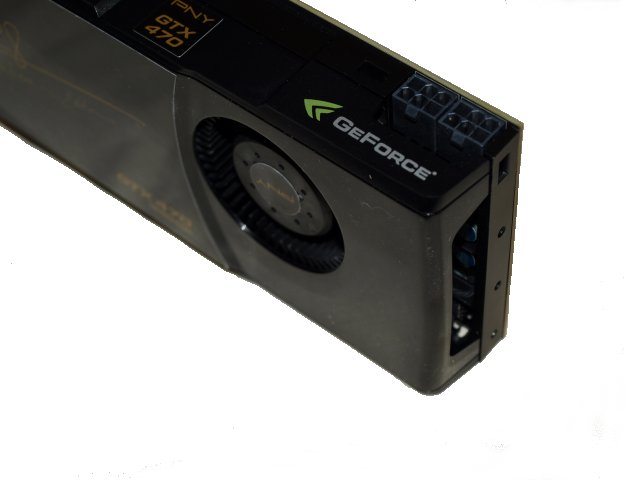
The fan side reveals nothing more than a tasteful sticker and the standard 16x PCI-E connector. You also get a look at the 50mm fan with vent openings on the back of the card.
Notice the slight scuff marks on the sticker, we suspect that was from the lack of top foam and no static bag.
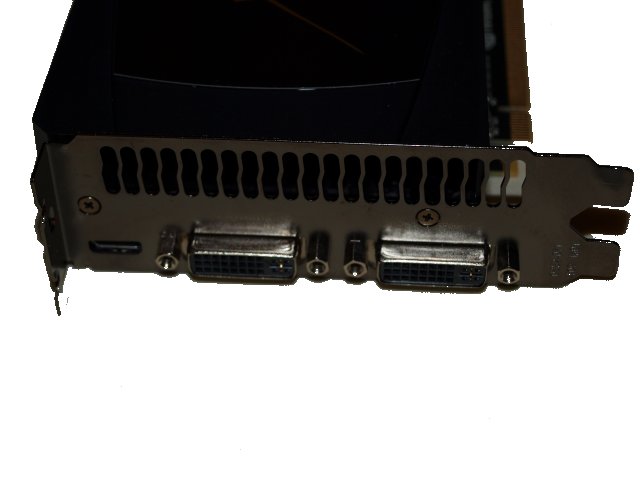
Standard dual slot expansion port with two DVI and one Mini HDMI connector.
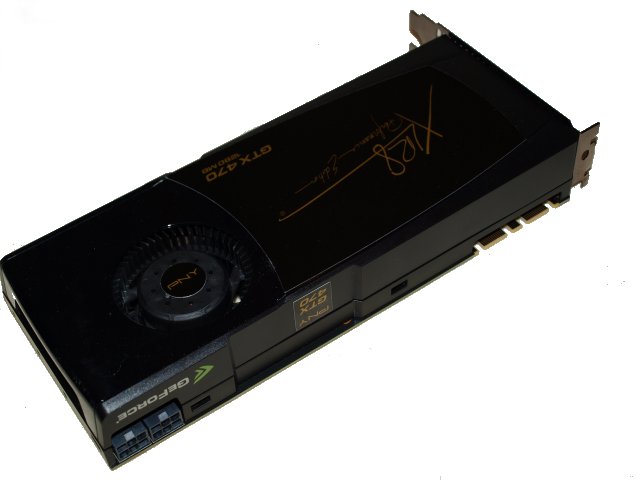
Like all top end single core Nvidia GPU;s this one is capable of triple SLI. The PNY GTX-470 uses two six pin PCI-E connectors and you get a better look at the 50mm squirrel cage fan. We still can’t understand the decision to use a 50mm fan on this large a GPU core. It would make more sense to use to use a 92mm fan that was more centered on the card.
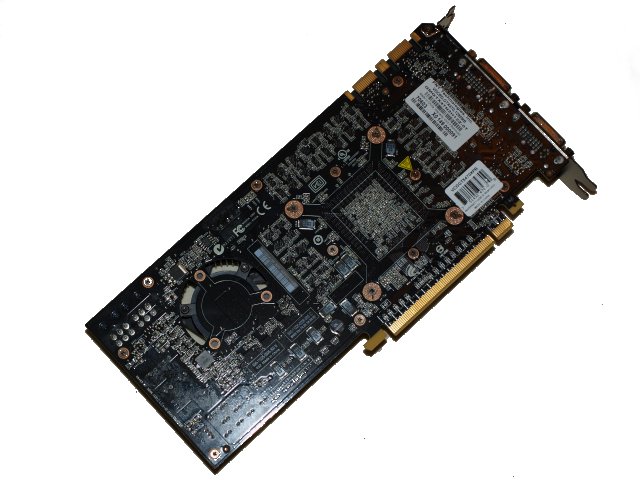
The back of the GPU is unremarkable and has a couple of stickers on it and vent holes for the fan to draw in some extra air.
Notice the small holes by the PCI-E power connectors and midway up the card, those are where the cowling clips onto the card and by depressing the tabs in the holes you can easily remove the cowling.
The end of the card has the air intake slot and it’s a good idea to have good front to back chassis airflow to help keep the temperatures down. Later we will be doing a preferred chassis for GF100 GPU’s and testing it on an open testing station and inside a recommended chassis to see differences in thermals.
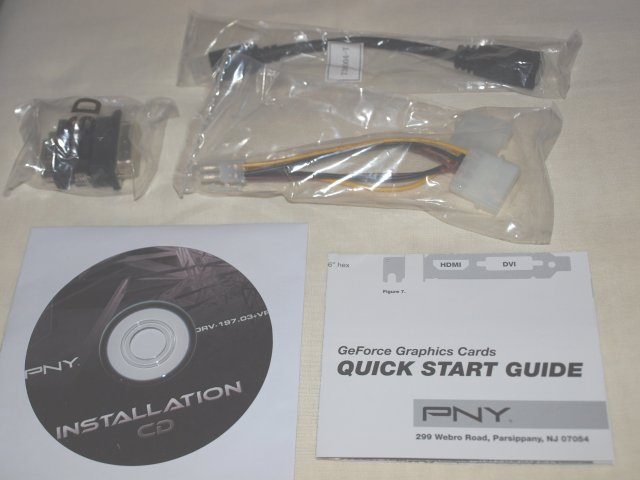
For the bundle you find a Driver CD, a quick start guide, a DVI to VGA adapter, a Molex to PCI-E power adapter, and a Mini HDMI to HDMI adapter.
You also get 5 free movie downloads and several Nvidia tech demos which makes the bundle a little sweeter. We still long for a game to be included with GPU’s but that hasn’t been happening for a while now.
Testing & Methodology
The GTX-470 is a new core design with a lot of innovative features so we are all over the map in testing. We benched the GTX-470 mercilessly for 4 days averaging 12 hours a day then started building charts and checking facts.
The first thing we did after updating the fresh load OS (From a HD clone that had no GPU drivers) was run thermal testing on the GTX-470. Often we end up benching for an hour or so and tend to other matters. Not in this case. We benched in 6 hour sessions without break. When we did have to move it was during a benchmark run. We tested thermals with normal games and Furmark. We want you to realize that Furmark isn’t really representative of normal operating temperatures.
We ran a wider variety of tests and each test was ran 3 times and the average reported here. A few tests were run many more than three times but we took the median 3 results and averages those. We’ll tell you why we ran some tests many more than 3 times a little later.
Test Rig
| Test Rig “Quadzilla” |
|
| Case Type | Top Deck Testing Station |
| CPU | Intel Core I7 965 Extreme (3.74 GHz 1.2975 Vcore) |
| Motherboard | Asus P6T6 |
| Ram | Corsair Dominator DDR3 1866 (9-9-9-24 1.65v) 6 GB Kit |
| CPU Cooler | Thermalright Ultra 120 RT (Dual 120mm Fans) |
| Hard Drives | Patriot 128 GB SSD |
| Optical | Sony DVD R/W |
| GPU Tested |
PNY GTX-470 |
| Case Fans | 120mm Fan cooling the mosfet CPU area |
| Docking Stations | Thermaltake VION |
| Testing PSU | Thermaltake Toughpower 1200 Watt |
| Legacy | Floppy |
| Mouse | Razer Lachesis |
| Keyboard | Razer Lycosa |
| Gaming Ear Buds |
Razer Moray |
| Speakers | Logitech Dolby 5.1 |
| Any Attempt Copy This System Configuration May Lead to Bankruptcy | |
Synthetic Benchmarks & Games
| Synthetic Benchmarks & Games | |
| 3DMark Vantage | |
| World In Conflict Benchmark | |
| Crysis v. 1.2 | |
| Dirt 2 | |
| FarCry 2 | |
| Stalker COP | |
| Crysis Warhead | |
| Unigine Heaven v.2.0 | |
| Intel DX11 SDK | |
| FurMark | |
| Mass Effect 2 | |
| Metro 2033 | |
You can see we are indeed all over the map, DX9, DX10, DX11, Tessellation, old, new and in between. We wanted as wide a representative sample as possible in the time available.
World in Conflict Demo

World in Conflict is a real-time tactical video game developed by the Swedish video game company Massive Entertainment, and published by Sierra Entertainment for Windows PC. The game was released in September of 2007. The game is set in 1989 during the social, political, and economic collapse of the Soviet Union. However, the title postulates an alternate history scenario where the Soviet Union pursued a course of war to remain in power. World in Conflict has superb graphics, is extremely GPU intensive, and has built-in benchmarks. Sounds like benchmark material to us!
Yes World in Conflict is a little, ok a lot, long in the tooth but that’s one reason why we fall back to it occasionally. Vendors don’t expect us to bench it and we get a candid look at how the new stuff performs on what used to be a GPU crippling game.
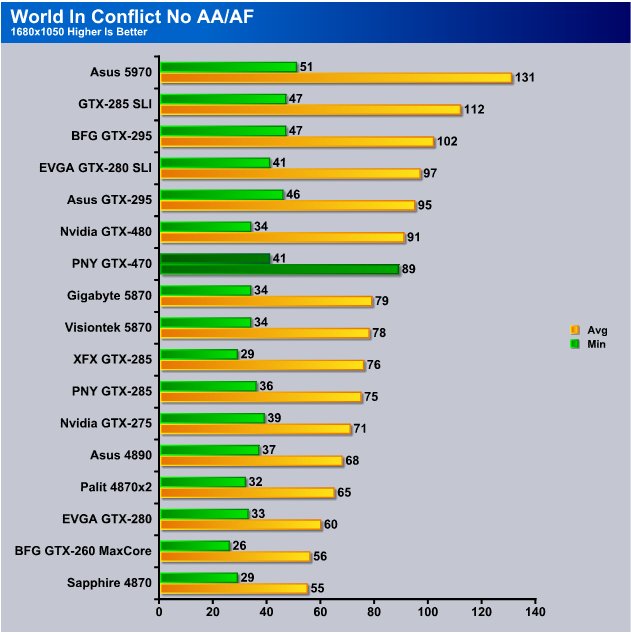
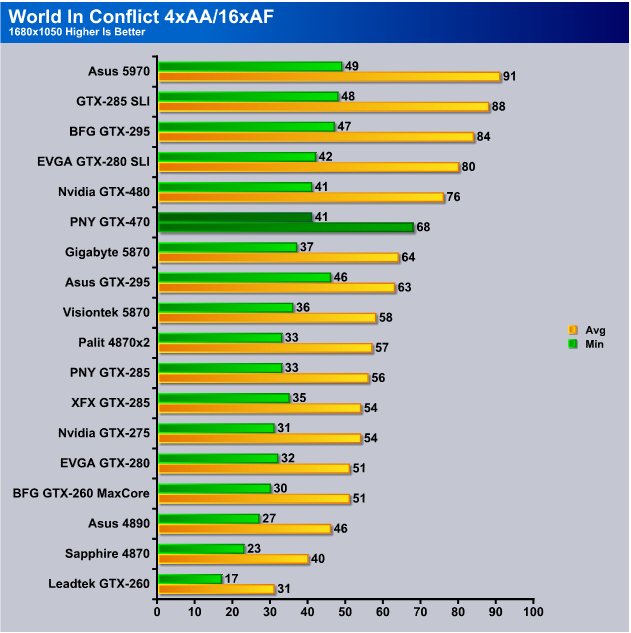
At 1680×1050 the PNY GTX-470 hit 41 FPS minimum and 89 FPS Average and for some odd reason managed to top the GTX-480 on minimum FPS.
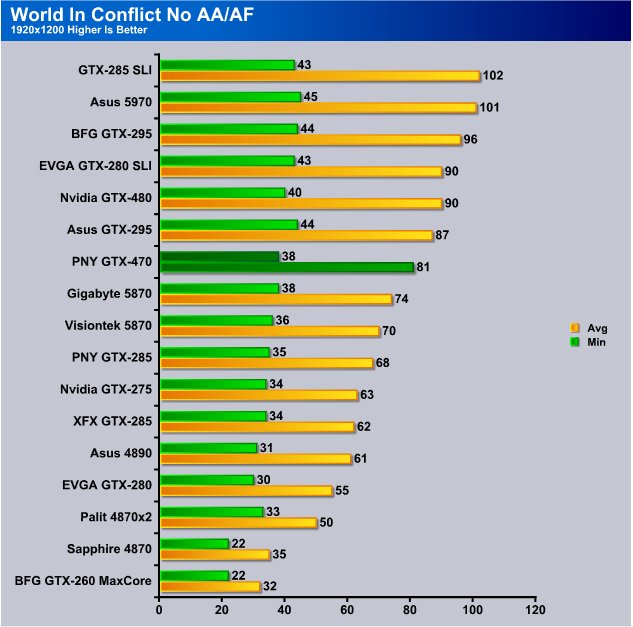
At 1920×1200 the PNY 470 came out right behind the mighty GTX-295 and just a hair ahead of the 5870’s. We expected the GTX-470 to compete with the 5870’s because of it’s price point. Both the 5870 and GTX-470 are at the same price point so you can expect similar performance. In all fairness though we gave both the ATI and Nvidia cards a PCI-E chipset voltage increase of 0.2v and it seemed like the PNY GTX-470 gained more performance from the bump than the ATI cards did.
Turning on AA/AF, which the GTX-4xx cards love we see the PNY GTX-470 at 41 FPS minimum and 68 FPS average and it’s beat by it’s bigger brother the GTX-480 and some dual chip/dual card configurations.
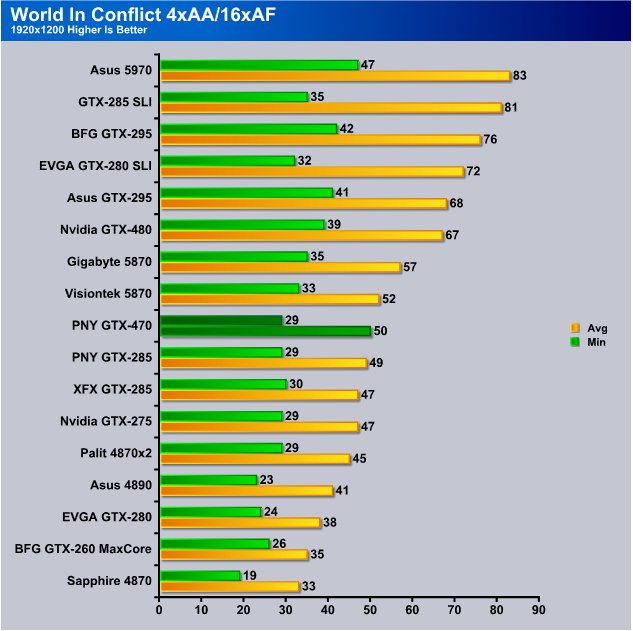
At 1920×1200 the PNY GTX-270 dipped to 29 FPS but we didn’t notice any visible degradation in the benchmark so it must have been momentary. The GTX-470 hit 50 FPS and the benchmark hovered there except for two very short drops to the 30 FPS range. At this resolution the 5870’s pulled out slightly ahead of the PNY GTX-470.
Crysis v. 1.21

Crysis is the most highly anticipated game to hit the market in the last several years. Crysis is based on the CryENGINE™ 2 developed by Crytek. The CryENGINE™ 2 offers real time editing, bump mapping, dynamic lights, network system, integrated physics system, shaders, shadows, and a dynamic music system, just to name a few of the state-of-the-art features that are incorporated into Crysis. As one might expect with this number of features, the game is extremely demanding of system resources, especially the GPU. We expect Crysis to be a primary gaming benchmark for many years to come.
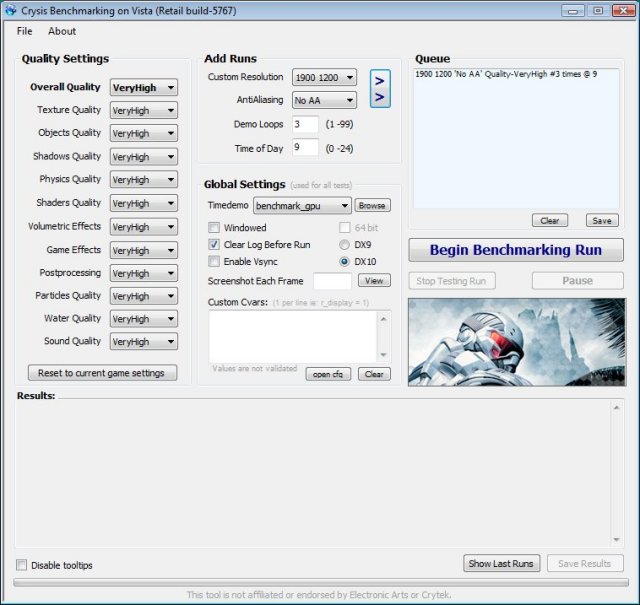
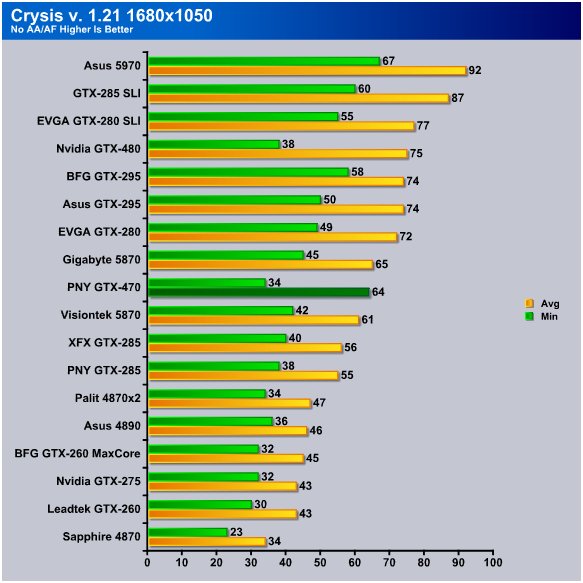
In Crysis we saw the PNY GTX-470 hitting 34 FPS min and 64 FPS avg at 1680×1050 but both the GTX-470 and 480 seemed to have minimum FPS problems with Crysis. We would suspect that to be a driver issue.
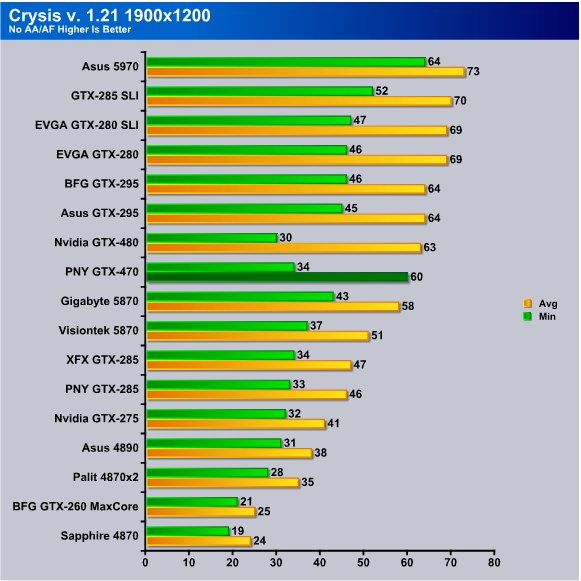
Here again at 1920×1200 we see both the GTX-470 and 480 with somewhat low minimum FPS for that class card but they are still at or above the crucial 30 FPS level. The PNY GTX-470 hits 60 FPS average with it’s more expensive big brother hitting 3 FPS faster.
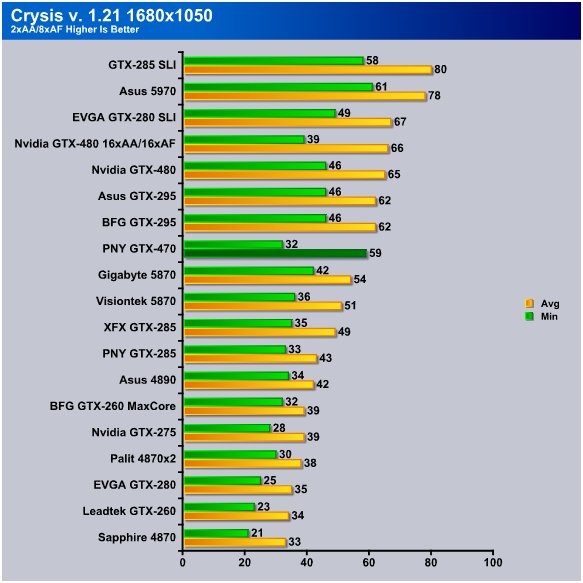
Turning on AA/AF in Crysis is where most GPU’s scream for mercy but the PNY GTX-470 is still getting 32 FPS min and 59 FPS average.
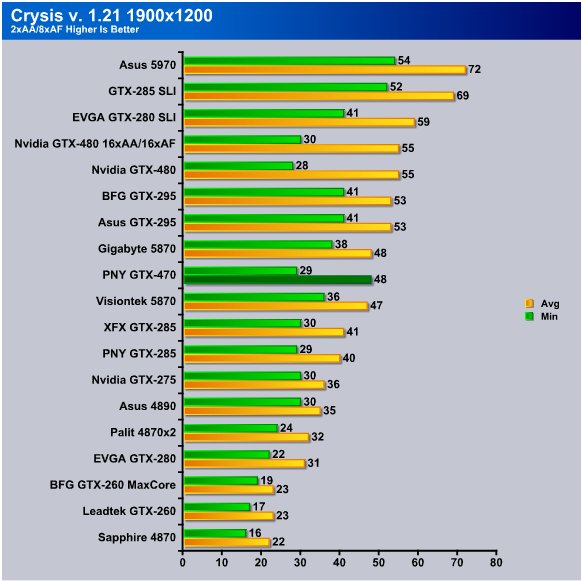
Highest resolution tested 1900×1200 the PNY GTX-470 dropped to 29 FPS minimum but again we didn’t see anything that looked jerky to the eye. One of the things we do with top end GPU’s is game Crysis at this level and see if the GPU will handle it. We didn’t have any problem at these settings with Crysis and the PNY GTX-470 and saw no micro-stutters or performance degradation. That’s saying a lot for any GPU.
CRYSIS WARHEAD

Crysis Warhead is the much anticipated sequel of Crysis, featuring an updated CryENGINE™ 2 with better optimization. It was one of the most anticipated titles of 2008.

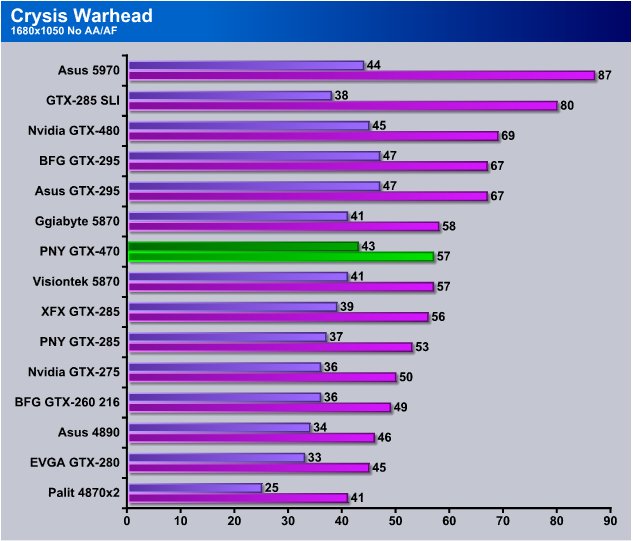
At 1680×1050 in Warhead the PNY GTX-470 is hitting 43 FPS min and 57 FPS Avg and is hanging tight with the 5870’s.
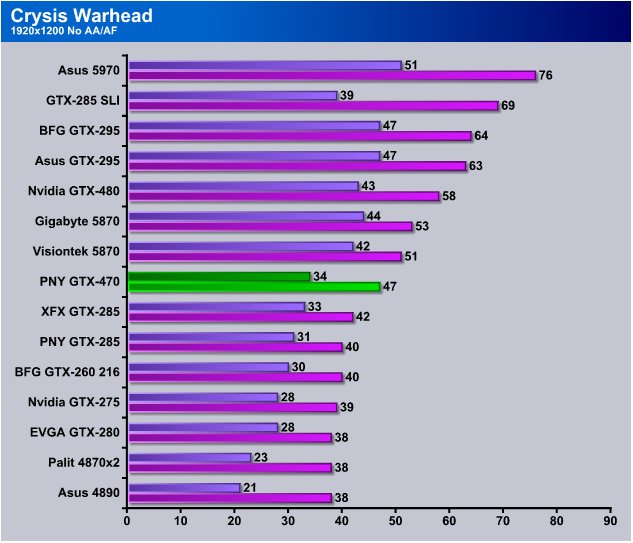
When we moved to 1920×1200 the HD5870’s jumped slightly ahead of the PNY GTX-470 and the GTX-470 is outperforming the GTX-285’s.
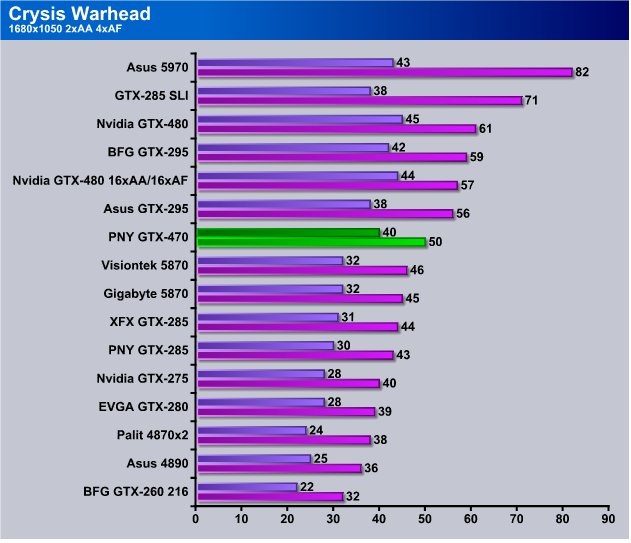
Jump back to 1680×1050 and turn on AA/AF and the PNy GTX-470 hits 40 FPS Min and 50 FPS Avg and is ahead of the HD5870’s again but the HD 5870’s might have an advantage in this game at higher resolutions.
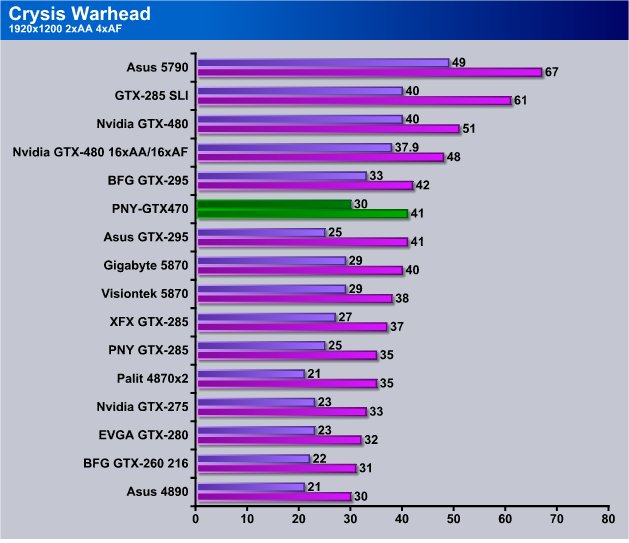
Well at 1920×1200 with AA/AF on the PNY GTX-470 manages to stay out ahead of the HD 5870 series and lands in the middle of the GTX-295’s. Not bad for a stepped down single core card when it competes with the previous generation of dual core GPU’s. Of course the GTX-470 has DirectX 11 which the previous generation can only dream of.
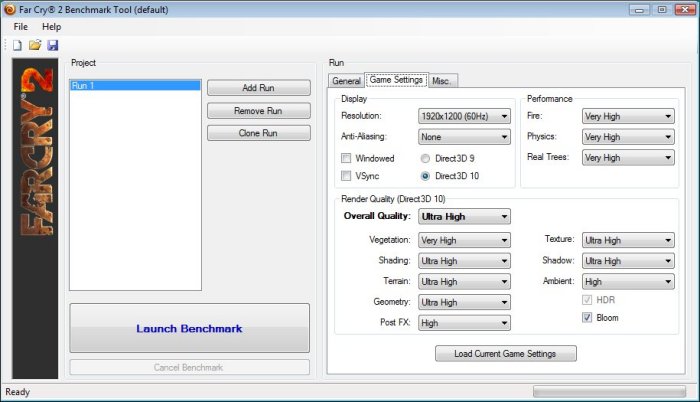
Far Cry 2

Far Cry 2, released in October 2008 by Ubisoft, was one of the most anticipated titles of the year. It’s an engaging state-of-the-art First Person Shooter set in an un-named African country. Caught between two rival factions, you’re sent to take out “The Jackal”. Far Cry2 ships with a full featured benchmark utility and it is one of the most well designed, well thought out game benchmarks we’ve ever seen. One big difference between this benchmark and others is that it leaves the game’s AI (Artificial Intelligence) running while the benchmark is being performed.
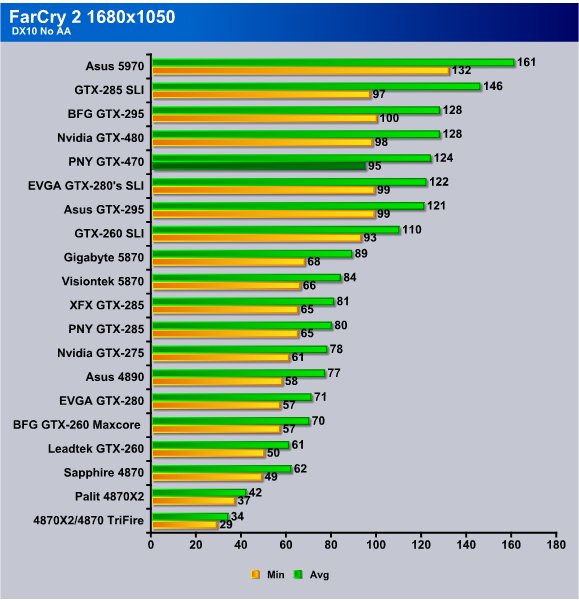
Far Cry 2 isn’t particularly demanding because it’s so well optimized but it scales well across GPU’s so it makes good comparison material. The PNY GTX-470 hits 95 FPS Min and 124 FPS average and is close on the heels of the GTX-480.
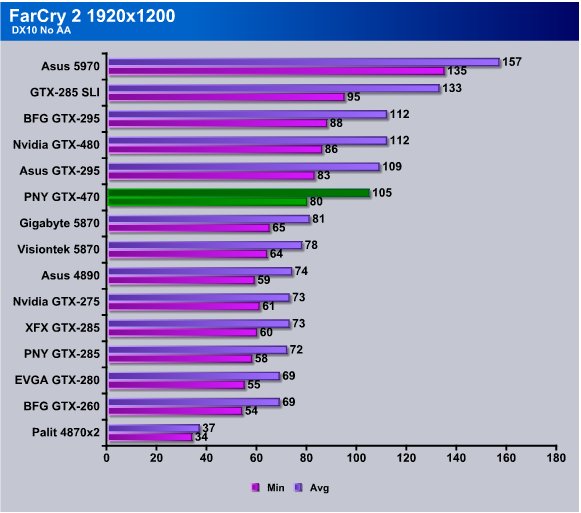
It’s quickly becoming obvious that if you are considering the Nvidia 4xx lineup that the question to ask is if the GTX-480 with slightly higher performance is worth the extra $150 it costs. With a little OCing the GTX-470 will likely match it’s performance but OCing the 4xx lineup might require cooling modification.
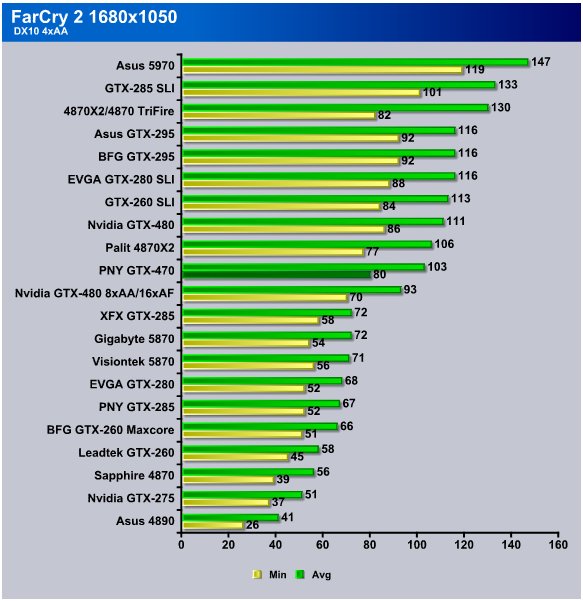
Kick on AA/AF at 1680×1050 and the PNY GTX-470 is eating Far Cry 2 for lunch. We got 80 FPS Min and 103 FPS avg.
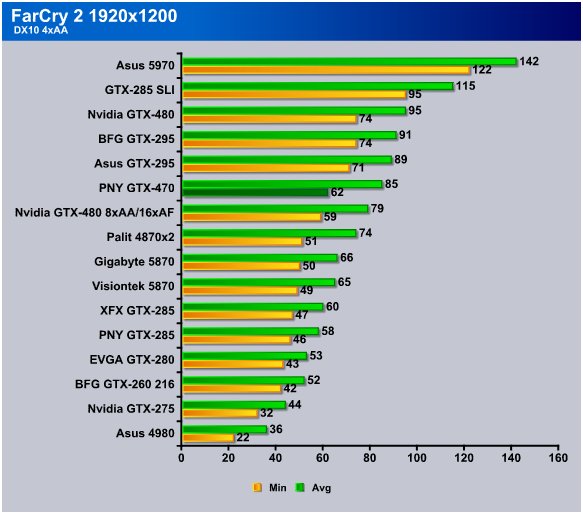
Highest resolution with AA/AF the PNY GTX-470 hits 62 FPS minimum and 85 FPS Avg so the PNY GTX-470 is overkill in this game.
Dirt 2

Colin McRae Dirt 2 is the squeal to the popular racing game Colin McRae Dirt. The game is a racing game, but with an off road twist. Instead of racing Bugattis and Porsches your going to be racing trophy trucks and rally cars. The newest addition adds DirectX 11 effects, and modified physics from the original game.
We only tested Dirt 2 with AA/AF and you’ll see why in a moment.
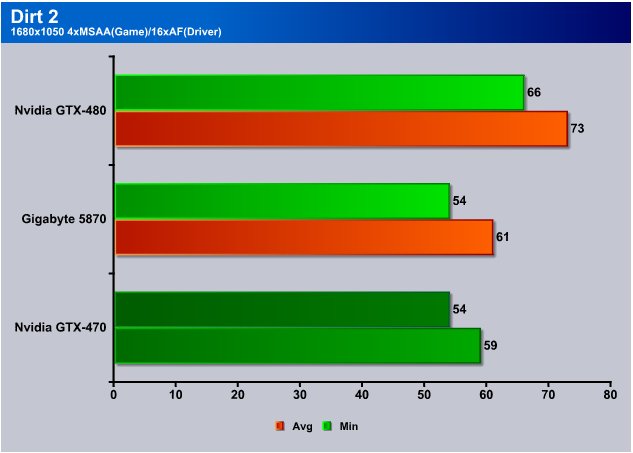
With the PNY GTX-470 hitting 54 FPS Min and 59 Avg we couldn’t see the point in expanding testing to non-AA/AF because all you are going to get is higher FPS and we are already at almost double the FPS required to run the game already. The Gigabyte HD 5870 managed to beat the PNY GTX-470 by 2 FPS average but they tied for minimum FPS.
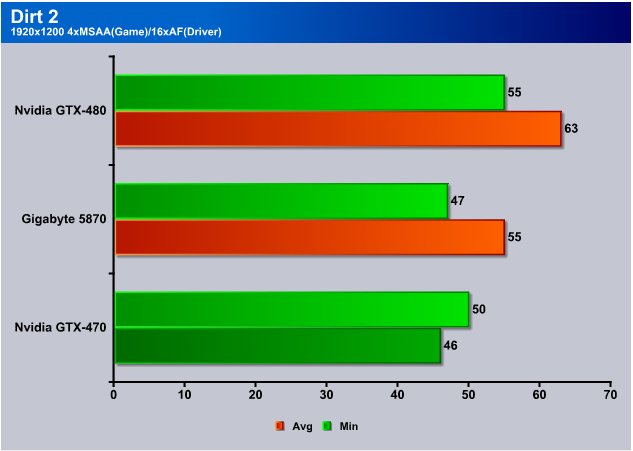
Even at the highest resolution tested the PNY GTX-470 was killing Dirt 2 and hit 46 FPS min and 50 FPS Avg and here again the HD 5870 managed a slight win over the GTX-470. The question here would seem to be is the current $400 price tag on the HD5870 worth that much more performance. Then the GTX-4xx lineup eats Tessellation and ray tracing for breakfast and has the advantage in every benchmark and game using those technologies so for us it’s not a hard call.
Unigine Heaven 2.0

Unigine Heaven is a benchmark program based on Unigine Corp’s latest engine, Unigine. The engine features DirectX 11, Hardware tessellation, DirectCompute, and Shader Model 5.0. All of these new technologies combined with the ability to run each card through the same exact test means this benchmark should be in our arsenal for a long time.
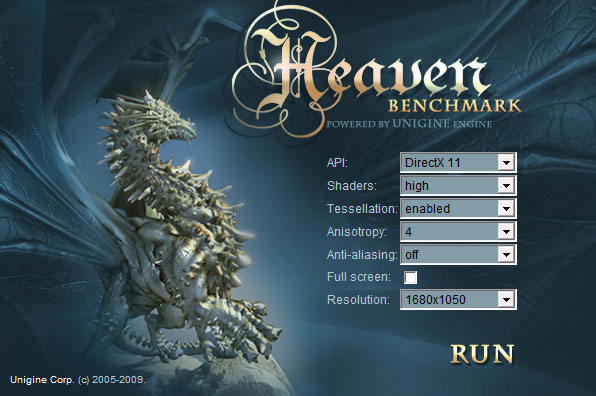
The settings we used in Unigine Heaven
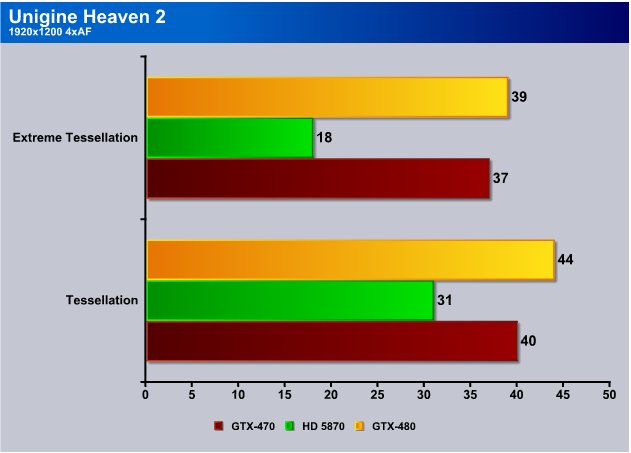
We tested Unigine Heave 2 with extreme tessellation and stock tessellation settings. Here’s where the GF100 lineup of GPU’s shows it’s real muscle. On the HD5870 we saw 18 FPS and choppy graphics. The PNY GTX-470 had 37FPS on extreme tessellation and was a mere 2 FPS behind the GTX-480.
Regular Tessellation the HD 5870 made 31 FPS which is a 13 FPS performance increase over Extreme tessellation. The GTX-470 handles both regular tessellation and extreme tessellation with ease and clocks in at 40 FPS which is only a 3 FPS performance increase over extreme tessellation. In this case we’d have to say crank up the tessellation because the benchmark was stunning with extreme tessellation.
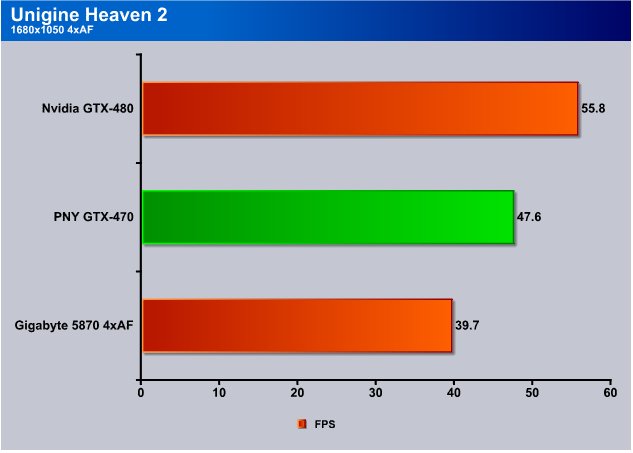
At 1680×1050 we went with regular tessellation and the GTX-470 hit 47.6 FPS while the HD5870 hit 39.7 FPS so we aren’t sure the HD5870 is worth the extra $50 you would pay for it when compared to the GTX-470.
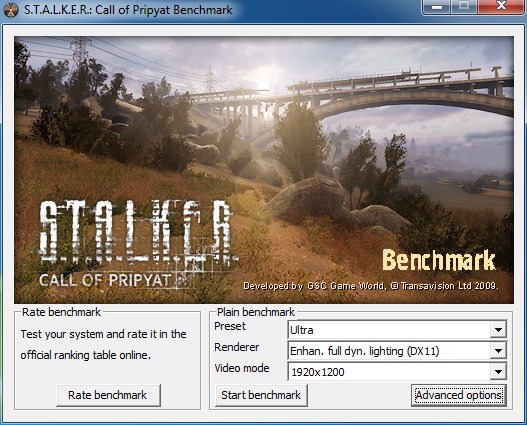
S.T.A.L.K.E.R.: Call of Pripyat

Call of Pripyat is the latest addition to the S.T.A.L.K.E.R. franchise. S.T.A.L.K.E.R. has long been considered the thinking man’s shooter, because it gives the player many different ways of completing the objectives. The game includes new advanced DirectX 11 effects as well as the continuation of the story from the previous games.
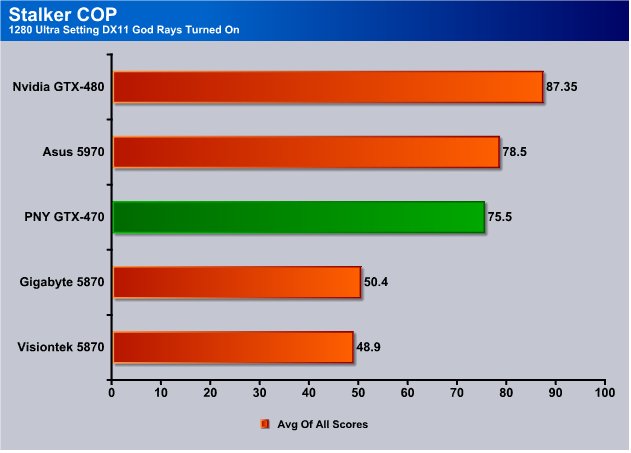
Here at 1280×1024 we see the PNY GTX-470 hitting 75.5 FPS and it’s about 25 FPS ahead of the HD 5870’s. This of course is with Sun-shafts turned on and that’s why you see such a large difference between the 470 and the HD 5870’s.
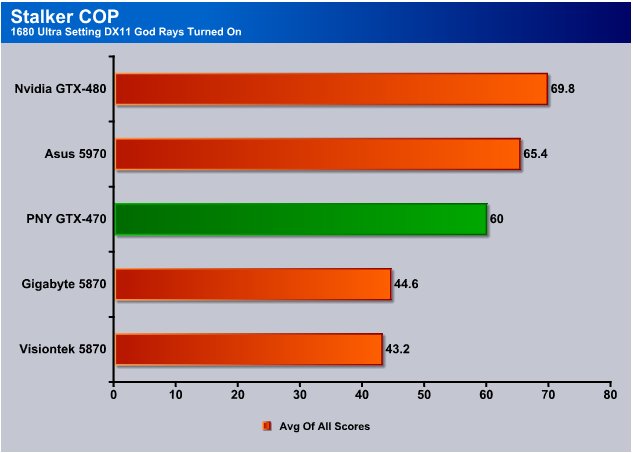
Crank it to 1680×1050 with Sun-shafts and we see the PNY GTX-470 hitting 60 FPS while the HD5870 is getting 44.6 FPS.
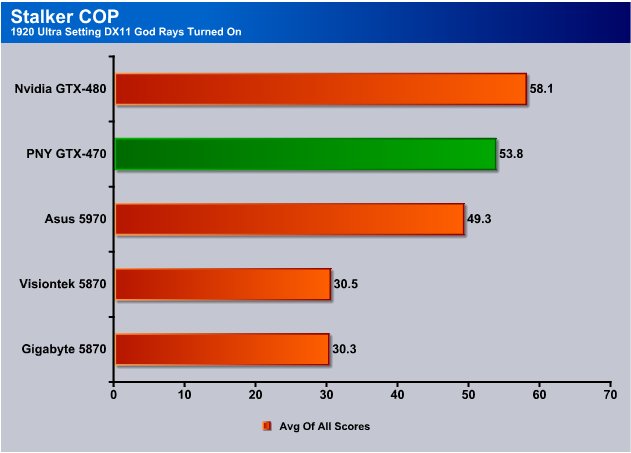
At 1920×1200 we see the average FPS on the HD 5870’s hitting 30 FPS and remember this is the average FPS the minimum FPS wasn’t pretty for the HS5870’s. The PNY GTX-470 is still at 53.8 FPS and had no problem with minimum FPS.
Stalker is a good benchmark but it’s one of those benchmarks that tries to provide too much information so we run with average FPS.
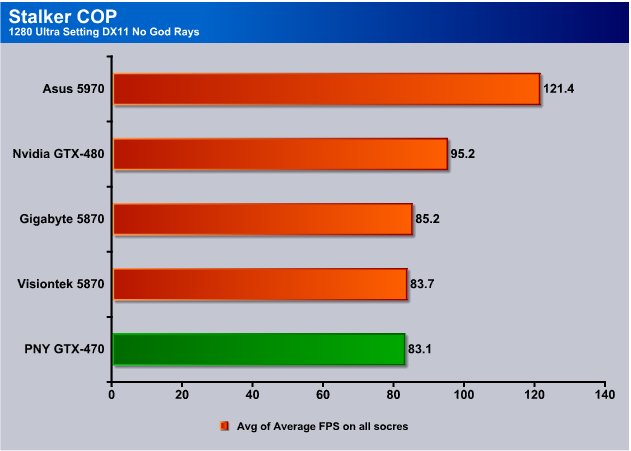
Take Sun-shafts out of the equation and the HD5870 barely tops the PNY GTX-470 but we will tell you right up front benchmarks with turned down eye candy don’t weigh very heavily in our final scoring when it comes to enthusiast class cards.
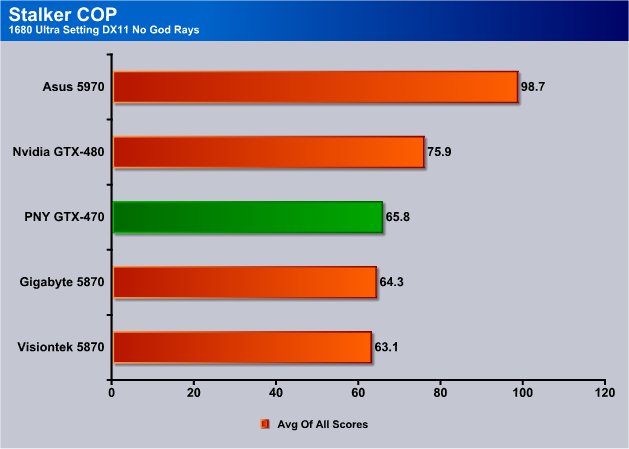
Here at 1680×1050 with sun-shafts off the PNY GTX-470 is barely ahead of the HD5870’s and about 10 FPS behind the GTX-480. What you have to keep in mind though is that beyond 30 FPS game graphics look rock solid to the eye.
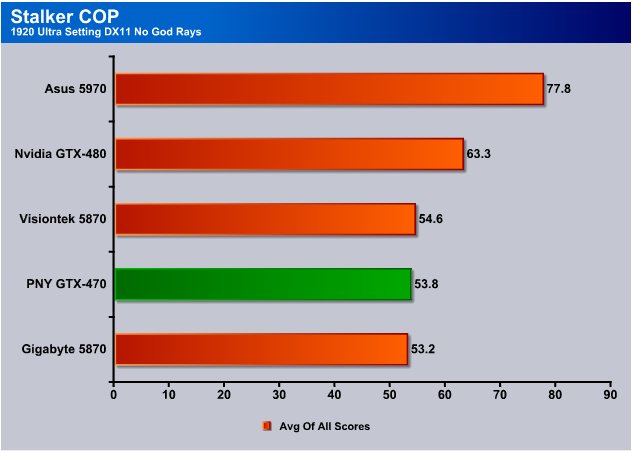
1920×1200 see’s the PNY GTX-470 splitting the win with the HD5870’s.
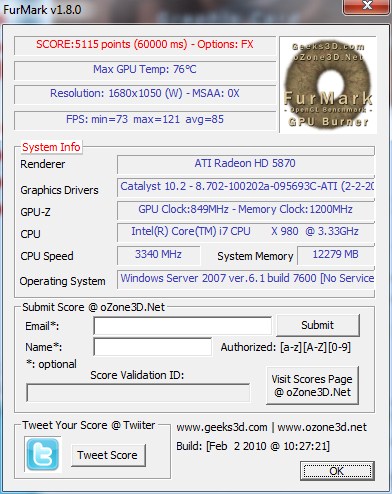
Furmark
Since Furmark has a built in benchmark we decided to play with that a little bit to evaluate it’s benchmark viability. This is a shot of the Furmark results from a previous review so you can see what the results page looks like. We went ahead and built charts for this review.
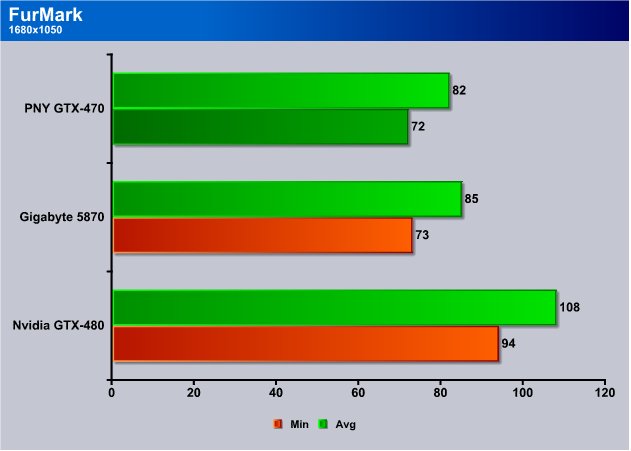
Furmark sees the PNY GTX-470 hitting 72 FPS Min and 82 FPS Avg and the HD5870 is a couple of FPS ahead of it.
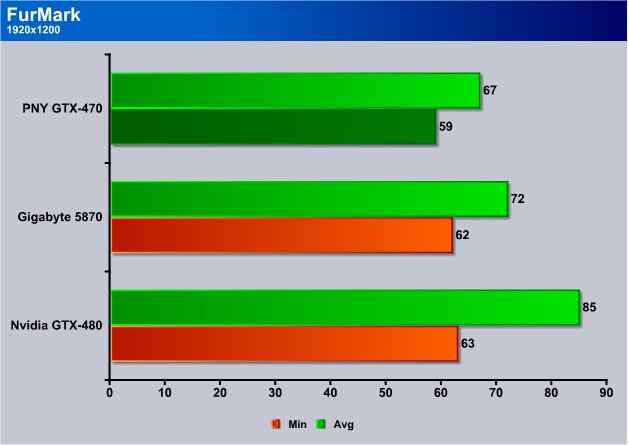
Kick the Furmark benchmark up to 1920×1200 and the PNY GTX-470 hits 59 FPS min and 67 FPS average while the HD5870 remains in the lead on this benchmark.
Mass Effect 2

Two years after Commander Shepard repelled invading Reapers bent on the destruction of organic life, a mysterious new enemy has emerged. On the fringes of known space, something is silently abducting entire human colonies. Now Shepard must work with Cerberus, a ruthless organization devoted to human survival at any cost, to stop the most terrifying threat mankind has ever faced.
To even attempt this perilous mission, Shepard must assemble the galaxy’s most elite team and command the most powerful ship ever built. Even then, they say it would be suicide. Commander Shepard intends to prove them wrong.
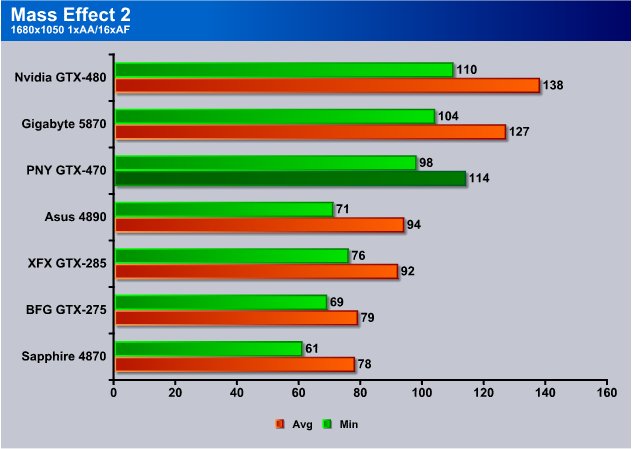
We decided to go with 1xAA/16xAF in Mass Effect 2 just to throw a little curve at the benchmarks. With less AA/AF the HD5870 topped the PNY GTX-470’s performance but we suspect that would level out if we increased AA/AF to much higher levels.
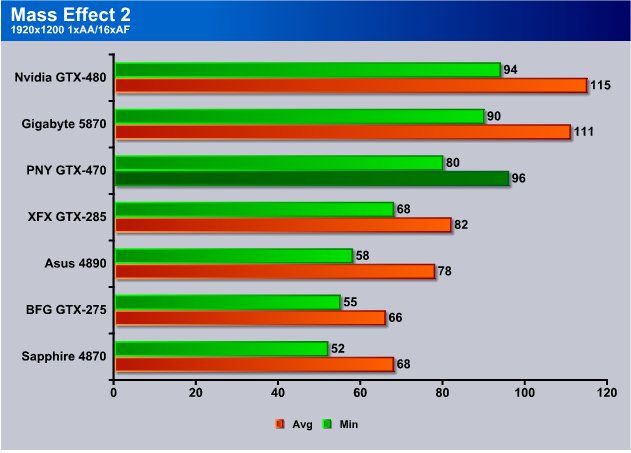
At 1920×1200 with 1xAA/16xAF the HD5870 held it’s lead on the PNY GTX-470 but with frame rates like this even the HD4870 will run Mass Effect 2 reliably which is why we didn’t bother with non-AA/AF testing.
Metro 2033

Metro 2033 is an action-oriented video game with a combination of survival horror, and first-person shooter elements. The game is based on the novel Metro 2033 by Russian author Dmitry Glukhovsky.
The enemies that the player encounters range from human renegades to giant mutated rats and even paranormal forces known only as “The Dark Ones”. Players frequently have to defend themselves with makeshift combination’s of different weapons, e.g a revolver with a sniper scope attached.
Ammunition is also scarce, and the more rare Military Grade bullets are used as currency (to purchase supplies and guns), or in combat as a last resort, giving an added damage boost, forcing the player to hoard supplies.
The game lacks a health meter, relying on audible heart rate and blood spatters to show the player what state they are in and how much damage was done. A gas mask must be worn at all times when exploring the surface due to the harsh air and radiation. There is no on-screen indicator to tell how long the player has until the gas mask’s filters begin to fail, so players must set a wrist watch, and continue to check it every time they wish to know how long they have until their oxygen runs out, requiring the player to replace the filter (found throughout the game). The gas mask also indicates damage in the form of visible cracks, warning the player a new mask is needed. The game does feature traditional HUD elements, however, such as an ammunition indicator and a list of how many gas mask filters and adrenaline shots remain.
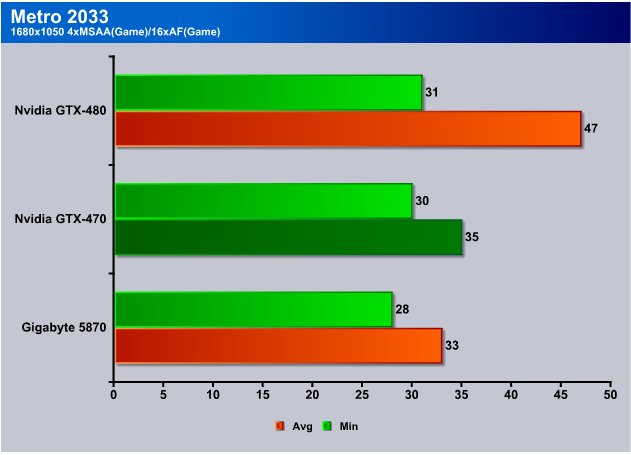
At 1680×1050 the HD5870 dropped below 30 FPS and with eye candy like Metro 2033 has it won’t be long before the other top end GPU’s join it. At this level the PNY GTX-470 hit 30 FPS min and 35 FPS AVG.
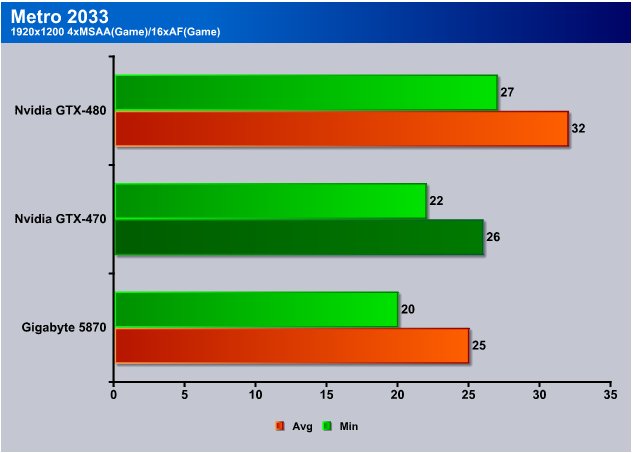
Cranking it to 1920×1200 the PNY GTX-470 hit 22 FPS Min and 26 FPS Avg and we noticed a little micro-stuttering during the benchmark. Even the GTX-480 dropped below 30 FPS at 4xMSAA/16xAF but we wanted to make the benchmark settings high enough that we get some longevity out of the game for benching.
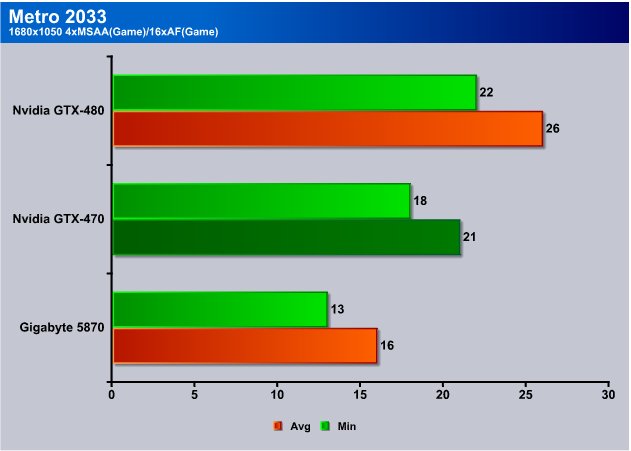
In the next two charts we kicked on PhysX and we don’t test PhysX much because when we test PhysX the ATI fans scream bloody murder. When we don’t test PhysX the Nvidia fans scream. So scream away it doesn’t matter what we do someone is going to whine about it so whine away.
With PhysX enabled (using a hex core i7 980x here) we got 13 FPS Min and 16 Avg on the HD5870 and graphics were rough enough that you wouldn’t want to play. The PNY GTX-470 hit 18 FPS min and 21 FPS Avg and game play was pretty choppy. The GTX-480 hit 26 FPS Avg and 22 FPS Min and we find ourselves longing to try some dedicated PhysX card testing in Metro 2033.
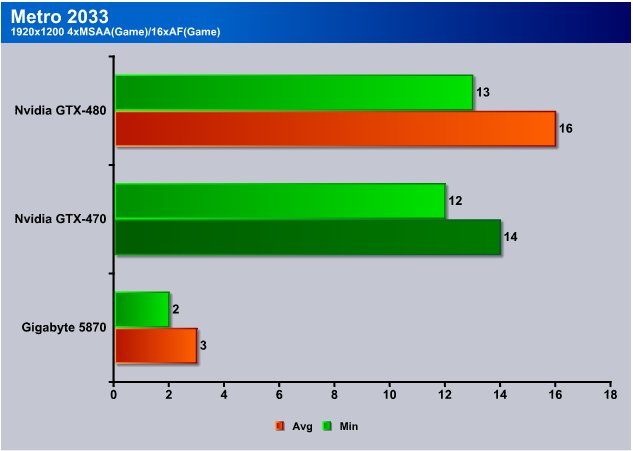
Here’s where the rubber met the road in Metro 2033, the HD5870 only managed 2 FPS Min and 3 FPS Avg but you have to remember that the PhysX is running on the CPU and not the GPU so this isn’t really a fair test for the HD5870 and we will not use PhysX in the consideration of our final score.
The PNY GTX-470 didn’t fare much better because at 12/14 FPS no one is going to be playing Metro 2033 at 1920×1200 with these setting with a single card and no PhysX card. PhysX is lacking in one big respect and it’s a glaring oversight on Nvidia’s part. PhysX should scale to the level of processing power available and it just doesn’t. That oversight limits PhysX’s viability in gaming and games that use it demand Nvidia GPU’s to pull it off. We are sure that is by design but it would gain greater acceptance if it were scalable.
3DMark Vantage

For complete information on 3DMark Vantage Please follow this Link:
www.futuremark.com/benchmarks/3dmarkvantage/features/
The newest video benchmark from the gang at Futuremark. This utility is still a synthetic benchmark, but one that more closely reflects real world gaming performance. While it is not a perfect replacement for actual game benchmarks, it has its uses. We tested our cards at the ‘Performance’ setting.
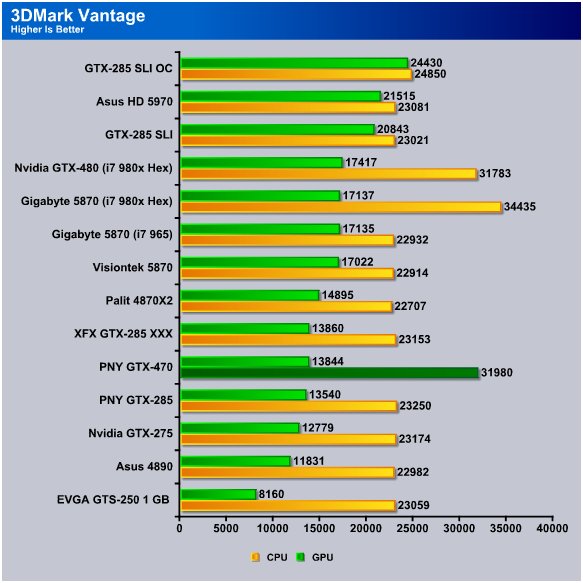
What we are charting here is the CPU score and the GPU score. What we’ve found out is that the GPU score doesn’t increase with a more powerful CPU but the overall score does. We aren’t interested in the combined score of the CPU/GPU we want the GPU score.
Here’s what’s funny about Vantage and the GTX-470. The HD5870 scores a 17K(ish) score while the PNY GTX-470 scores a 13844 but in games we see the GTX-470 keeping up with the HD5870 lineup so that forces us to rethink Vantages viability as a good measurement of performance. Maybe it’s time for Vantage 2.0 DX11 with Tessellation and Ray Tracing.
TEMPERATURES

We went a little different on thermal testing this round. Keep in mind this is on an open Top Deck Testing station and Nvidia is telling us that isn’t the optimal condition for thermal testing. If we met every optimal condition that vendors tried to pass at us all we would be doing is optimizing for testing and no testing would get done.
What we are being told is that certain chassis provide better front to back airflow than others and those are the chassis they want used. We have a HAF932 on the way for testing the 4xx lineup in but that’s just not really very viable for every end user to run out and buy an expensive new chassis ranging from $100 – $200 just to run a GF100 GPU in so we are taking the recommendations with a grain of salt right now. We will do preferred chassis testing in the HAF932 and report temperatures from the Top Deck Testing Station and inside the HAF932. We fail to see how any chassis with front to back airflow is going to make any difference considering we have front to back airflow on the Top Deck testing station to the tune of 106 CFM front and back on all the GPU’s. We turn those fans off for Furmark testing but for temperatures taken in game we run them just like you do chassis fans.
People need to get over the heat issues, the GF100 lineup is designed to operate up to 105° C and at 105° C it throttles to prevent damaging the card. If you can’t live with that then aftermarket cool it or buy another GPU. The GTX-295 operates at about 90° C on a good day and no one had a problem with that. Yet a GPU with 3+ Billion transistors that rivals the GTX-295’s performance is criticized, that doesn’t make a lot of sense.
Since such a large issue has been stirred up over the thermals on the GTX-4XX lineup we are doing Furmark, Crysis and Heaven 2 thermal readings on the PNY GTX-470. Please be aware that I am just deleting the hate mails about thermals on the 4xx lineup. The operational thermal limits are up to 105° C and we haven’t seen one exceed that limit and until that time it’s not much of a concern for us.
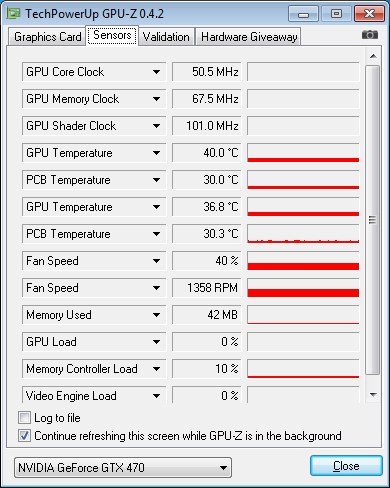
Here’s a shot of GPU-Z after idling at the desktop for 30 minutes and you can see the Idle temp is 40° C.
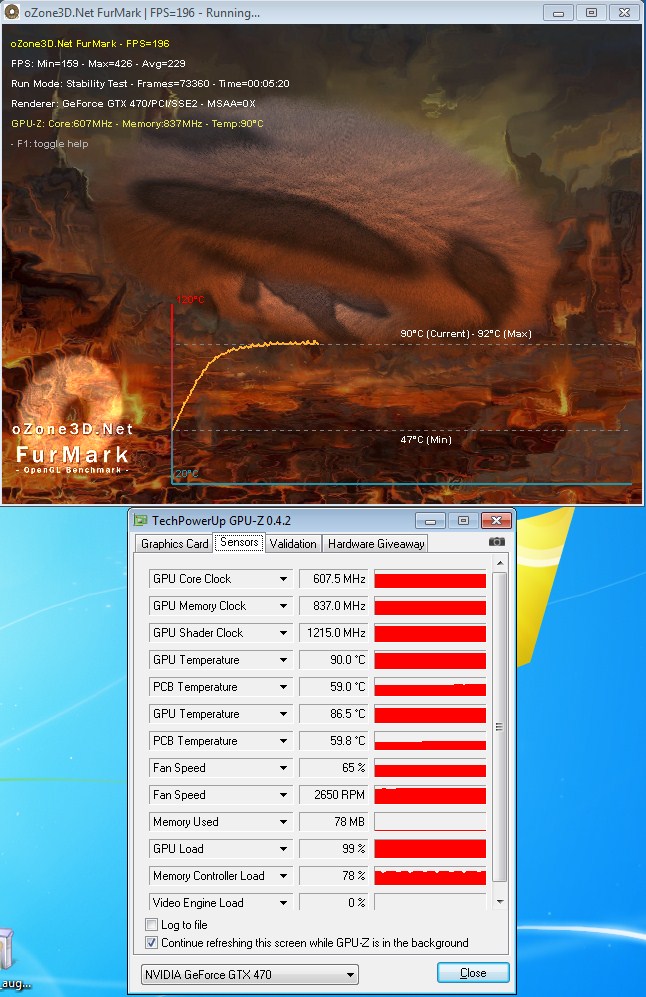
Then a 5 minute run in Furmark shows the GPU hitting 92° C, we did 10 minute runs but the temp remained at 90 – 92° C.
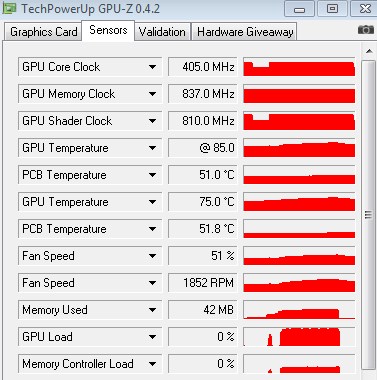
This shot is from Crysis benchmarking. We didn’t use this benchmark for scoring because GPU-Z refreshing in the background might affect performance but it’s showing us that at the highest temperature the PNY GTX-470 hit 85°C. We did ten complete 3 run passes at the Crysis benchmark lasting about 30 minutes before we took the reading.
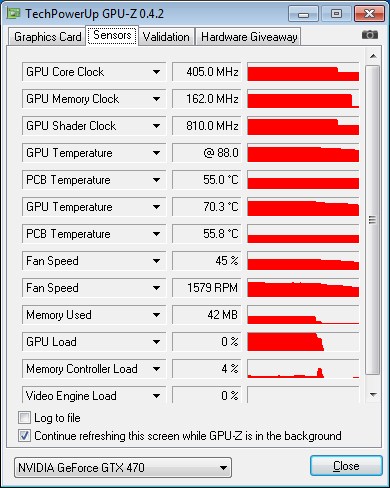
In Heaven 2 we saw temperatures at 88° C which is what 2° C less than Furmark was generating. Furmark had no extra airflow on the Top Deck testing station and Heaven and Crysis had an additional 2 fans totaling 106 CFM one blowing on the back of the PNY GTX-470 and one on the front and air intake port which resulted in a 2° C decrease in temperatures. Is 2° C of thermal decrease worth re-casing your rig and spending $100 – 200 and 5 or 6 hours re-casing it. We don’t think so.
POWER CONSUMPTION

To get our power consumption numbers we plugged in out Kill A Watt power measurement device and took the Idle reading at the desktop during our temperature readings. We left it at the desktop for about 15 minutes and took the idle reading. Then we ran Furmark for 10 minutes and recorded the highest power usage.
| GPU Power Consumption | |||
| GPU | Idle | Load | |
| PNY GTX-470 | 178 Watts | 487 Watts | |
| Nvidia GTX-480 | 196 Watts | 521 Watts | |
| Gigabyte HD5870 | 167 Watts | 379 Watts | |
| Asus EAH5970 | 182 Watts | 412 Watts | |
| Gigabyte 4890 OC | 239 Watts | 358 Watts | |
| Asus EAH4770 | 131 Watts | 205 Watts | |
| BFG GTX-275 OC | 216 Watts | 369 Watts | |
| Nvidia GTX-275 Reference | 217 Watts | 367 Watts | |
| Asus HD 4890 Voltage Tweak Edition | 241 Watts | 359 Watts | |
| EVGA GTS-250 1 GB Superclocked | 192 Watts | 283 Watts | |
| XFX GTX-285 XXX | 215 Watts | 369 Watts | |
| BFG GTX-295 | 238 Watts | 450 Watts | |
| Asus GTX-295 | 240 Watts | 451 Watts | |
| EVGA GTX-280 | 217 Watts | 345 Watts | |
| EVGA GTX-280 SLI | 239 Watts | 515 Watts | |
| Sapphire Toxic HD 4850 | 183 Watts | 275 Watts | |
| Sapphire HD 4870 | 207 Watts | 298 Watts | |
| Palit HD 4870×2 | 267 Watts | 447 Watts | |
| Total System Power Consumption | |||
The PNY GTX-470 (Whole system power consumption) was idling in the rig at 178W and with Furmark running top power consumption was at 487W so the GTX-4xx lineup isn’t gentle on power consumption and consumes about 108W more than the the HD5870.
Overclocking
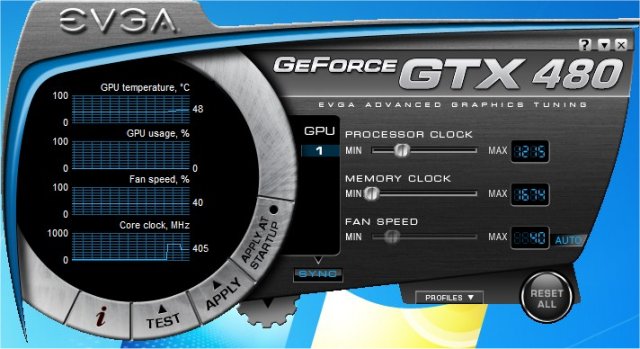
We started out with EVGA Precision, yes we know there’s a skin for the 470 but it really doesn’t make any difference for the OC itself so we were lazy and didn’t re-skin Precision.
We see the standard 607MHz Core Clock (1215 divided by 2) and the standard memory clock 837 MHz.
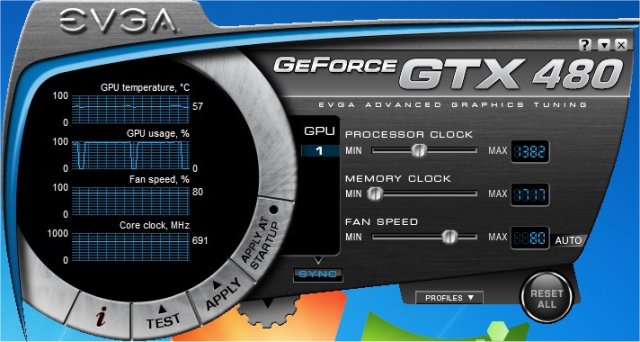
We spend a few hours tuning the OC and the best we could get was 691MHz Core and 859MHz Memory. The core overclock was pretty decent but we had hoped to clock higher than the GTX-480 default clock but it just wasn’t happening. Seems Nvidia learned from the GTX-275 which could usually clock higher than the GTX-285 stock clock and probably reduced sales of the more expensive model.
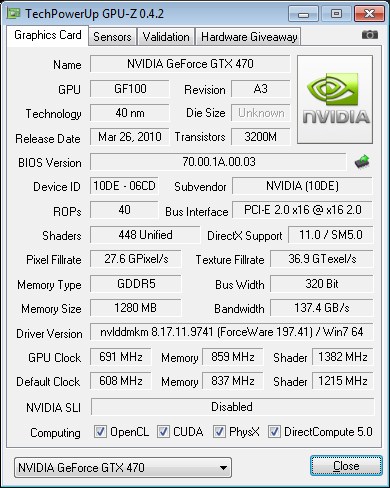
We went ahead and took a screen shot of GPU-Z so you can see the true Core speed and Memory speed without having to divide on the fly. Core 691 MHz and it was entirely stable at that, try for 700 and we get artifacts. The memory on the card just didn’t want to OC much, we got a measly 22MHz OC and beyond that we got artifacts. Figure that’s DDR5 and it’s quad pumped so that a 88 MHz frequency increase. Still we’ve seen better but this is Nvidia’s first GDDR5 memory controller and we expect improvements on that design as it matures.
Conclusion
The PNY GTX-470 provides great performance at a somewhat affordable price. When compared to the HD5870 it holds its own and costs about $50 less then the HD5870. It runs $150 less than its bigger brother the GTX-480 and from a price performance standpoint the PNY GTX-470 is probably the better choice.
Given a SLI capable motherboard we would see the upgrade path as a single GTX-470 now and when the next generation of GPU’s hits pick up a second for some SLI action.
Performance was high enough on the GTX-470 that any game you pick will play well on it (with the exception of Metro 2033 which doesn’t run well on any GPU). The PNY GTX-470 will run heavily tessellated games with Ray Tracing and features DX11 capabilities. They run a little warm and they use more power than the HD5870 but they have more capabilities than the HD5870 so that’s a choice you’ll have to make. It’s not much of a choice for us, we like eye candy that cripples most GPU’s and the PNY GTX-470 provides that. Sure it’s going to use some power but look at it this way, toss in a $50 game and your good for 40 – 50 hours of game play, go to a movie and have dinner with your better half and your out $100 (unless you subject your better half to fast food). So 50 hours of game play for $50, or 4 hours of dinner and a movie for $100. Of course you have to figure in the initial cost of the PNY GTX-470 which is $350 (ish) but it comes with 5 free movie downloads so order a Pizza, DL a movie and stay home and play a game after the movie.
We like the performance of the PNY GTX-470 and the (comparative) value it offers, performance was high, gaming with eye candy like that didn’t hurt our feelings any and we can’t wait to get a couple of these in SLI to see how well they do.
| OUR VERDICT: PNY GTX-470 | ||||||||||||||||||
|
||||||||||||||||||
|
Summary: The PNY GTX-470 offers great performance at a better price than the GTX-480 and holds it’s own against the HD5870. Considering the PNY GTX-470 is $50 less than a HD5870 and performs in line with it in most games, has DX11 capabilities, and packs all the new GF100 technology it’s an attractive option for high end graphics.
|