The long awaited Sata 3 interface is here, Seagate is the first company to offer Sata 3 drives for the new interface, the Seagate Barracuda XT 2TB drive. Lets take it for a spin.
Introduction
The long awaited Sata 3 interface is finally here. The new interface promises to offer twice the bandwidth of the older Sata 2 interface. Currently hard drives don’t challenge the Sata 2 bandwidth unless your talking Raid arrays. More than likely SSD Raid arrays. Seagate estimates that within 2 – 3 years we will need the additional bandwidth that Sata 3 offers but the fledgling technology is here now.
We have the flagship Gigabyte P55A-UD6 with Sata 3 and USB 3.0 and a Seagate Barracuda XT 2TB drive to spin up on the new interface. You should be aware though that this is just a speed bump drive and it’s not going to challenge the bandwidth of Sata 3. It has the Sata 3 interface and is backwards compatible with Sata 2, but it’s not going to exceed Sata 2 theoretical bandwidth speeds.
That’s not to say the Barracuda XT is a bad drive or anything of that nature, it’s a very good drive, one of the best 7200 RPM drives we’ve ever seen and it has a whopping big 64MB cache. There’s a lot to like about the Seagate Barracuda XT, but it’s still not going to exceed 300MB/s which is the Sata 2 theoretical limit. One of the things we like about Seagate is they are very open and let you know right up front what to expect.
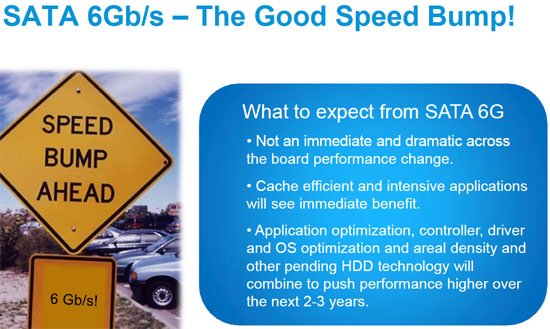
This is an excerpt from the media kit we got on the Barracuda XT and realistically given the density of 1 and 2 TB drives with a rotational speed of 7200 RPM they’ve about reached the limit of platter drives. They need higher density, higher RPM’s, and OS and driver optimization to go much further.
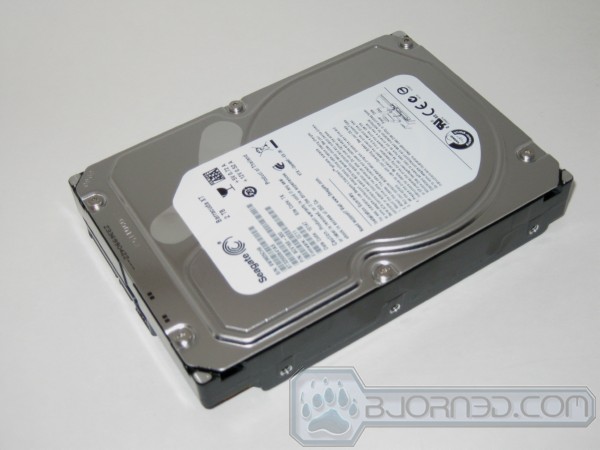
With a form factor of 3 1/2 inches the new drive looks exactly the same as the older Sata 2 interface drives but we have no problem with that it still has that new HD smell we are addicted to.
Features & Specifications
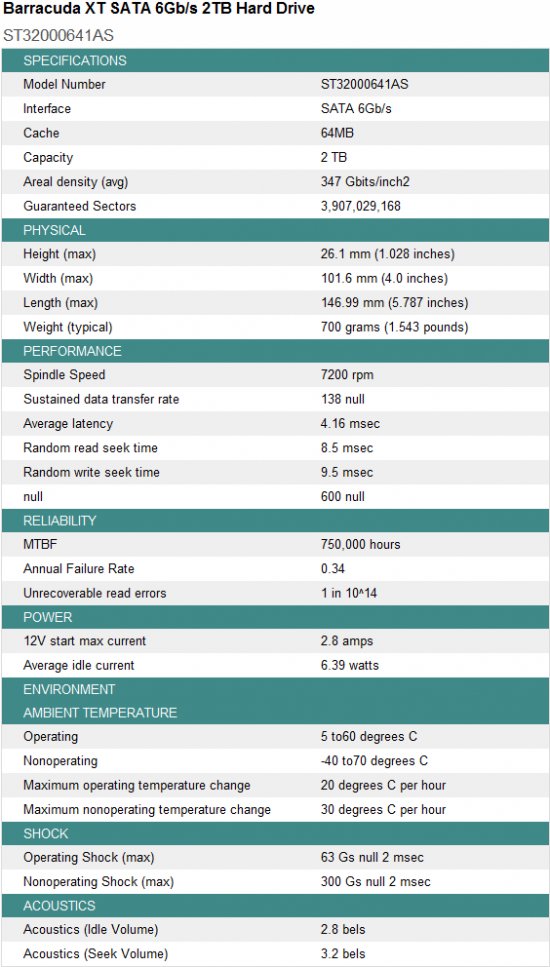
With the new Sata 3 interface and a 64MB cache backing up the Seagate Barracuda XT 7200 RPM drive it might not exceed the Sata 2 bandwidth theoretical limit but it’s not going to be a slacker. With a random read seek time of 8.5ms and a random write seek time of 9.5ms and an average latency of 4.16ms we expect to see some speeds in excess of 100MB/s single drive operation.
Sisoft Sandra HD Information Dump
Since this is a new breed of drive we did a dump of the information that Sisoft Sandra could read from the drive and while Sandra, like most HD utilities, is a little behind the Sata 3 information we wanted to provide as much information on the new Sata 3 drive as possible so here it is.
SiSoftware Sandra HD Report
- SCSI General Properties
- Controller : 1
- Bus : 1
- Target ID : 0
- Logical Unit No. : 0
- General Capabilities
- Channel : Master
- Type : ATA
- Interface : SATA
- Removable : No
- Model : ST32000641AS
- Revision : CC11
- Serial Number : 9WM05CH9
- ATA/ATAPI Approved Version : 8.41
- Rotational Speed : 7200rpm
- Drive Geometry
- CHS Geometry : 16383 x 16 x 63
- CHS Total Sectors : 16514064
- LBA Total Sectors : 3907029168
- Number of ECC Bytes : 4
- Capacity : 1.82TB
- Translation Mode Disk Geometry
- CHS Geometry : 243201 x 255 x 63
- Bytes Per Sector : 512bytes
- Capacity : 1.82TB
- Partitions Information
- Partition 1 : MBR IFS-NTFS 1.82TB
- Logical Drives
- Logical Drive : F:
- Cache Information
- Read Cache : Yes
- Write Cache : Yes
- Prefetch Buffer : No
- Properties
- NCQ – Native Command Queuing : Yes
- PEC – Physical Event Counters : Yes
- LBA Support : Yes
- Features
- S.M.A.R.T Support : Yes
- Security Support : Yes
- Power Management Support : Yes
- ACPI Power Management Support : No
- Power-up in Standby : No
- Packet Command Interface : No
- Removable Media : No
- Look-Ahead Buffer : Yes
- Write-Back Cache : Yes
- Host Protect Area : Yes
- Microcode Update : Yes
- Acoustic Management : No
- 48-bit LBA : Yes
- Device Config Overlay : Yes
- Active Features
- S.M.A.R.T Enabled : Yes
- Security Enabled : No
- Power Management Enabled : Yes
- Look-Ahead Buffer Enabled : Yes
- Write-Back Cache Enabled : Yes
- Host Protect Area Enabled : Yes
- S.M.A.R.T Information
- Version : 1.01
- ATA Commands Support : Yes
- ATAPI Commands Support : Yes
- S.M.A.R.T Commands Support : Yes
- S.M.A.R.T Data
- TFF : 0 (0 – 0) [0000]
- TFF : 0 (255 – 0) [0A00]
- T85 : 250 (0 – 255) [40FF]
- TFF : 0 (0 – 0) [0000]
- T88 : 250 (0 – 255) [10FF]
- Transfer Modes Support
- I/O Queue Depth : 32
- Block Size : 8
- Maximum SATA Mode : G2 / SATA300
- Transfer Modes Active
- Current Block Transfer : 8
- Current SATA Mode : G2 / SATA300
Notice that Sandra is reporting a Sata 300Gb/s interface, that’s what we ment bu not uite up to date for reading Sata 3 600Gb/s drives. We are sure that in the near future Sisoft will release an update supporting the new interface.
Pictures
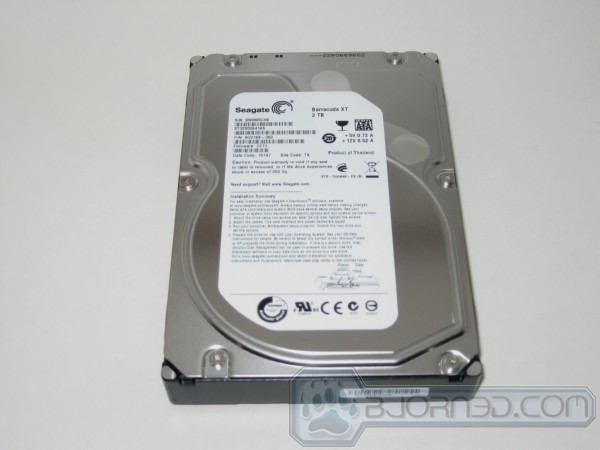
Looking all nice and shiny the Seagate Barracuda XT 2TB drive looks much the same as any of the Seagate drives we’ve seen in the last year. The only real difference in the way it looks is the sticker designating it the Barracuda XT.
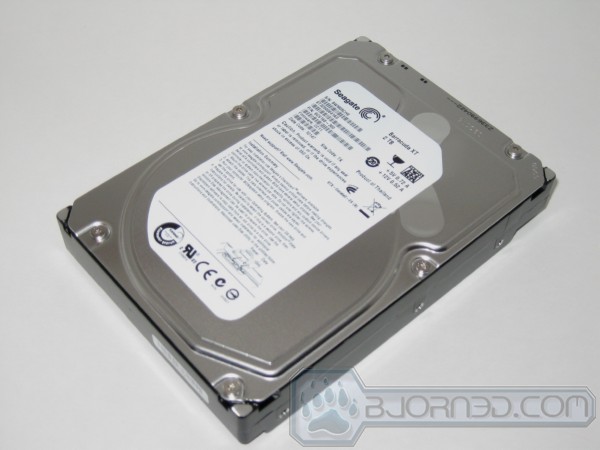
This is a standard 3.5 inch drive designed for desktop machine usage but we suspect it won’t be long before 2.5 inch variations appear in both platter and SSD flavors.
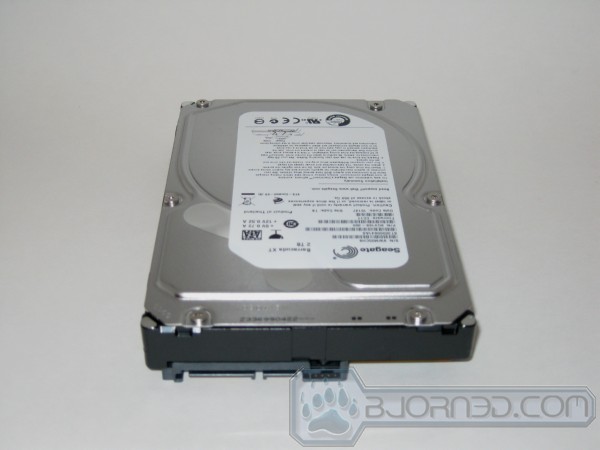
The rear of the drive reveals what looks to be a standard Sata interface and the drive is backward compatible with all Sata standards but unlike older drives is capable of utilizing the new features of the Sata 3 interface. Older drives will work on the Sata 3 interface but aren’t designed for optimal performance on the new interface.
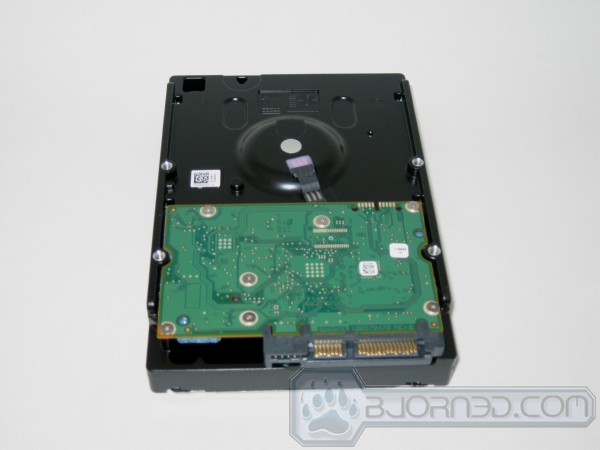
The bottom of the drive gives you a look at the half PCB design used on the drives controller electronics. We took a look at some older drives and the drives PCB has more clearly defined data paths and fewer solder points so it looks like drive controllers are evolving for the better.
The Interface Design & Decision
It’s always fun when you get a new critter in your hand and have to figure out the best way to provide palatable information about it with testing. More fun than one human should have.
We are using the Gigabyte P55A-UD6 board to test the drive with and there are a few things specific to the entire line of Giga P55A boards relating to the Sata 3 controller setup. In BIOS you will find a Sata 3 setting with a Turbo designation. This Setting allows the Sata 3 controller to run at Sata 3 speed or 6Gb/s (600MB/s) but if you use Sata 3 Turbo it disables the use of SLI and Crossfire on the P55A lineup. If you disable Sata 3 Turbo then it’s still a Sata 3 interface but limited to 3Gb/s (300MB/s) but you can use multi-GPU setups. Using Sata 3 Turbo will not only limit you to one GPU but it will also cut the bandwidth on the first PCI-E slot, the one you put your video card in, to 8x speed. So you give up SLI/Crossfire and the first slot is limited to 8x speed if you use Sata 3 Turbo, or USB 3.0 Turbo. Here’s the response we got from Gigabyte on the Interface limitations.
According to Colin and engineer team, that is the limitation of the P55 chipset, no native SATA3 support and PCIe 2.0 limited to 1×16 or 2×8. Due to PCI-e Gen 1 bandwidth limitation, we need to use a PCI-e Gen 2 bandwidth (since SATA3 transfer is 6Gb/s (600MB/s), PCIe Gen 1 x1 lane from the P55 has a limitation, as it’s only able to offer 2.5Gb/s (300MB/s), therefore, we need to get a Gen 2 lane, which offers 5Gb/s (600MB/s). As we don’t see much of a performance difference of x16 graphics vs x8 graphics, we use that lane for SATA3 and USB 3.0.
Keep in mind, users are able to turn on and off Turbo SATA and Turbo USB, so if they want to use the full x16, graphics they can, however, it will switch x1 Gen1 lane off the P55, which will limit to 2.5Gb/s. We feel this is a fair trade off, as it means we are able to give users the option to use SATA 3 and USB 3.0 on our entire lineup of P55 motherboards, unlike our competitor who only has support for their very highest end P55.
We like that Gigabyte has incorporated the entire P55 lineup with Sata 3 and USB 3.0 and we know that this is a limitation of the P55 chipset. There are only so many PCI-E lanes available and they have to get the bandwidth from somewhere. Most end users use a single GPU and 8x bandwidth isn’t going to affect performance on single card setups. Since Gigabyte opened the door by responding about the competitors high end boards we felt compelled to contact Asus and this is the response we got from them.
The allocation of the PCI-E lanes comes from the PCH we unified the 1.1 lanes and then supply them to the PLX bridge this in return provides us with our PCI-E 2.0 x 1 Lane which provides 500MB of throughput eliminating any bottleneck. I believe I had previously supplied a breakdown of this information in a previous email I will resend it will all other applicable information. I hope this provides a clearer breakdown of the implementation. Additionally we are currently working with Marvell to have a newer driver supplied to enhance performance for current generation drives ( as most optimization has been done for their SSD prototype controller as well as large file transfers.
Additionally the reason why we did 4 is to ensure sufficient bandwidth for our – E premium refresh models because they need bandwidth for both SATA6G and USB3.0. So to clarify as noted below.
1 PCI-E 1.1 lane provides 250MB 4 equaling 1000MB
We have taken 4 and provided to PLX Bridge.
This way we can provide 500 to USB and 500 to SATA6G.
It is not a perfect implementation but practical efficient and does not limit the throughput need to benefit from the drives connected to those buses.
Yes, as the PLX 8613 controller provides up to 4 PCIex1 2.0 lanes output, we can connect up to 4 devices behind it.
As each PCIex1 2.0 lane takes 5Gb/s bandwidth, and we feed it with 4 lanes of PCIex1 1.1 for it to use, which sums up to 10Gb/s bandwidth, by having only two devices connecting to that controller ensures the full bandwidth without compensation.
We realize that this is a HD review but the hard drive is a Sata 3 interface and currently there are two implementations of the Sata 3 interface out there and you need to know the difference. Especially if, like most of the Bjorn3D staff, you are a multiple GPU user.
The Gigabyte implementation is platform wide and if you are a single GPU user there’s nothing wrong with it given the chipset limitation. If you are a multi-GPU user then Asus probably has the more elegant solution for you. Gigabyte takes the bandwidth it needs from the PCI-E Gen 2 lanes and leaves you with 1 GPU running on an 8X bandwidth slot, Asus, which is offering Sata 3 and USB 3 on it’s premium boards has taken the bandwidth from the PCH (Platform Controller Hub) and unified the PCI-E lanes with a PLX 8613 bridge chip. So the Asus solution is limited to higher end boards and probably more suitable to multi-GPU end users.
All that being said we are testing on the Gigabyte P55A-UD6 today and have no desire to start an Asus/Gigabyte multi-board comparison of the Seagate Barracuda XT. We have the Asus board in house and will review it with the Seagate Barracuda XT and report results on it in that review.
TESTING & METHODOLOGY
To test the Seagate Barracuda XT we cloned our test rig drive to the Sata 3 drive, it’s the same test drive we’ve been using on all our drive testing and is nothing more than a clean Windows load with all the drive testing software installed, as well as all the current drivers and patches for the OS. It’s the equivelent of doing a fresh load of Vista from disk but takes a lot less time and ensures that every drive tested uses exactly the same OS load and drivers. Nothing that may affect the outcome of the testing procedure can creep in. We ran all of the tests a total of 3 times and averaged those results. The Average of the three results are presented here. In the case of a pictorial benchmark we ran the bench 3 times and picked the median result.
We ran our usual battery of tests on the drive, and used it as the primary boot drive during testing. All of the drives tested were used as the primary boot drive during testing. That’s a more realistic test than strapping the drive in and testing it with a bare format or as a non-boot drive and it represents real life transfer rates, much like you can expect when you install and operate the drive in your own system. Each test was performed 3 times and the average of the 3 test run is reported here.
Seagate and Gigabyte both informed us that we would get slightly better benchmark numbers if we turned Write Cache flushing off, so we turned Write cache flushing off for both the Barracuda LP and XT but the other drives tested had Write cache flushing turned on. Our main comparison is between the two similar density drives so it shouldn’t be an issue but we wanted to leave the other drives on the charts for comparison purposes.
Test Rig
| Test Rig “Quadzilla” |
|
| Case Type | Top Deck Testing Station |
| CPU | Intel Core I7 870 Extreme |
| Motherboard | Gigabyte P55A-UD6 (SLI and CrossFire on Demand) |
| Ram | Kingston HyperX 1600MHz 8GB kit (8-8-8-24) |
| CPU Cooler | Thermalright Mux 120 (Dual 120mm Fans) |
| Hard Drives |
Seagate Barracuda XT (ST32000641AS) |
| Optical | Sony DVD R/W |
| GPU | BFG GTX-260 MaxCore |
| Case Fans | 120mm Fan cooling the mosfet CPU area |
| Docking Stations | None |
| Testing PSU | Thermaltake Toughpower 1200 Watt |
| Legacy | None |
| Mouse | Razer Lachesis |
| Keyboard | Razer Lycosa |
| Gaming Ear Buds |
Razer Moray |
| Speakers | None |
| Any Attempt Copy This System Configuration May Lead to Bankruptcy | |
Test Suite
|
Benchmarks |
|
ATTO |
|
HDTach |
|
Crystal DiskMark |
|
HD Tune Pro |
|
AS SSD Benchmark |
|
Sisoft Sandra |
|
Everest Ultimate |
ATTO
ATTO is a little long in the tooth but still provides a good method of checking hard drive performance. Since your comparing results from the same benchmark to other drives benched on the same software it provides a basis for comparison and in most cases provides reliable and reproducible results.
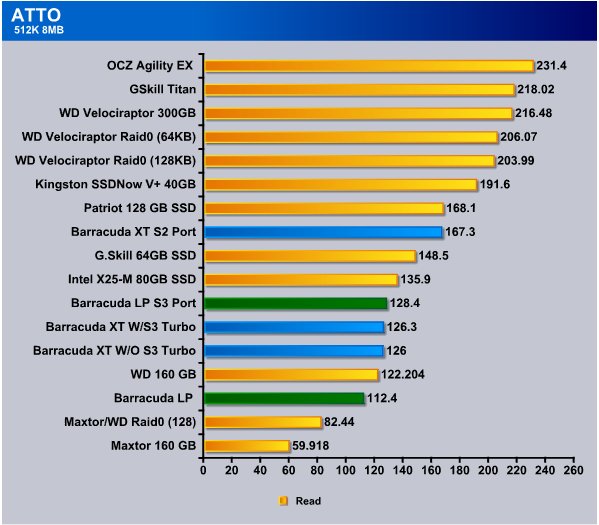
Lets get this out of the way right off the bat. We tested the Seagate Barracuda XT in Sata 3 Turbo, Sata 3 W/O Turbo, and on a S2 port. We also tested the Barracuda LP which has the same platter density on Sata 3 and Sata 2. While testing on Sata 3 we used Sata 3 Turbo. The Seagate Barracuda LP is a 5900 RPM drive and it’s the only drive we had onsite to test that has the same platter density. We would have preferred to have a 7200 RPM drive with the same density per platter but we didn’t have one onsite.
While the Sata 3 port with Turbo produced the most reliable results the Sata 3 without Turbo produced almost mirrored results. Since the drive doesn’t exceed 300MB/s there’s not much difference in transfer speed in this test. we did get a little bit of an amazing result from the Barracuda XT when it was hooked to the Sata 2 port and the transfer speed jumped to 167MB/s which is a jump of about 41MB/s using the older port. We suspect that that will change when the Sata 3 firmware on the drive and the interface has matured.
We were also a little shocked when the Barracuda LP hooked to the Sata 3 port beat the Barracuda XT by 2MB/s but we’ll have to watch the charts as we go to see if that’s a trend that holds up.

In the Atto write test we saw the best result from the Barracuda XT when hooked to the Sata 2 port and is scores a massive 143.9MB/s, hooking to the Sata 3 port with Turbo on we see 111.8MB/s and without turbo we see 90.02MB/s. The Barracuda LP dropped to 65.8MB/s on the Sata 2 port and 52.8MB/s on the Sata 3 port.
Again the Barracuda XT performed better on the Sata 2 port and it’s early in the game so we aren’t sure what’s up with that.
We can see the mental wheels churning in some readers, so lets cover this again. On Gigabyte boards specifically you have the Sata 3 option for Turbo, it’s not really turbo but lacking a better name they used Turbo because it’s a well understood phrase. Sata 3 Turbo provides the full 600MB/s theoretical speed, turning Turbo off limits the bandwidth to 300MB/s but lets you use SLI or Crossfire at 8x8x on the PCI-E lanes. Using Turbo disables SLI and Crossfire and limits the first PCI-E slot to 8x. We;ll have to study the effects of that in the motherboard review.
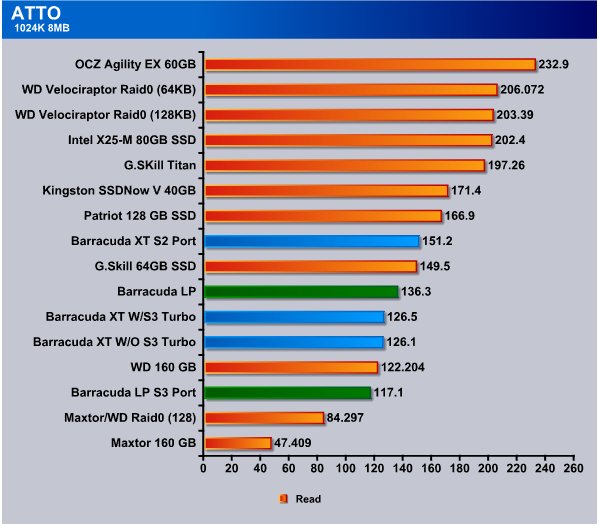
In the first three tests so far the Barracuda XT has performed better on the Sata 2 port by a pretty good margin and this time on the Sata 2 port it got 151.2MB/s and the Barracuda LP hooked to the Sata 2 port got 136.3MB/s which is more than 10MB/s better than the Barracuda XT did hooked to the Sata 3 port. Hooking the Barracuda LP to the S3 port hurt it’s performance and it dropped almost 20MB/s but we can’t hold that against the Sata 3 port or the Barracuda LP because the LP is designed for Sata 2 and we would consider hooking a Sata 2 drive to a Sata 3 port as a last ditch “I’m out of ports” option.
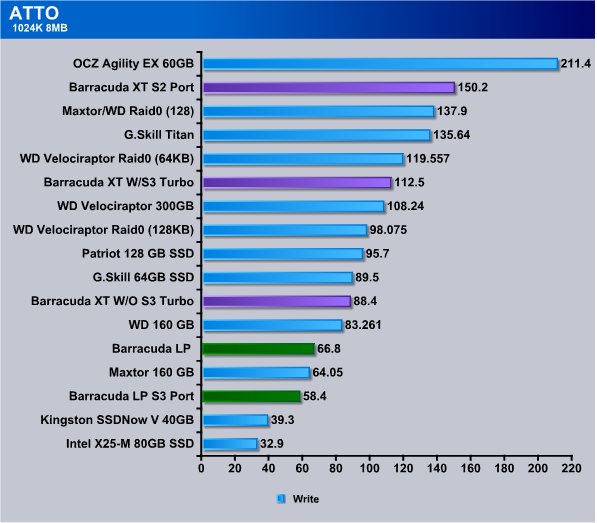
This is the 4th test (All ATTO so far) that shows the Barracuda XT running faster on the Sata 2 port, more than 37MB/s faster. Running Sata 3 with Turbo it hit 112.5MB/s and dropped to 88MB/s without Turbo. The Barracuda LP was running 66.8MB/s Sata 2 and again suffered on Sata 3.
HD TUNE PRO
HD Tune Pro is an extended version of HD Tune which includes many new features such as: write benchmark, secure erasing, AAM setting, folder usage view, disk monitor, command line parameters and file benchmark. HD Tune Pro is a computer benchmarking application that can test the performances of any PC.
Here are some key features of “HD Tune Pro”:
- Benchmark: measures the raw performance
- Transfer Rate
- Access Time
- CPU Usage
- Burst Rate
- Hard Disk information which includes firmware version, serial number, disk capacity, buffer size, transfer mode
- Hard Disk Health
- S.M.A.R.T. Information (Self-Monitoring Analysis and Reporting Technology)
- Temperature
- Power On Time
- Copy text to clipboard
- Copy screenshot to clipboard
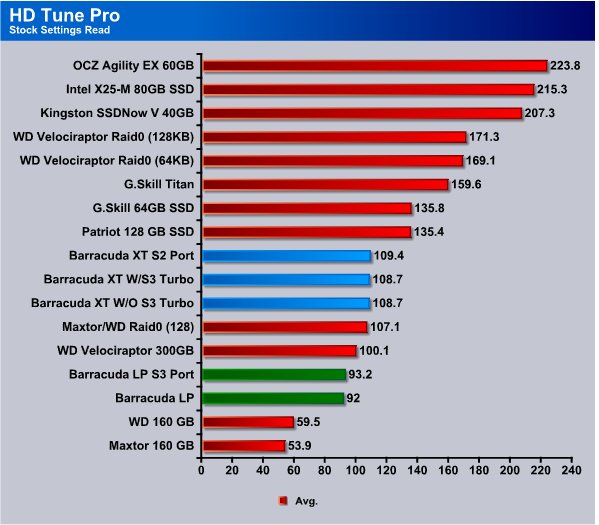
We got a very consistent speed from the Barracuda XT in the average read speed on HD Tune Pro. No Matter what port we hooked it to we were in the 108 – 109MB/s range. The Barracuda LP rabged from 92 – 93MB/s and that shows why we like the LP good performance with a “Green” design. For the most part we like raw speed, and in that case the Barracuda XT is more to our taste in platter drives.
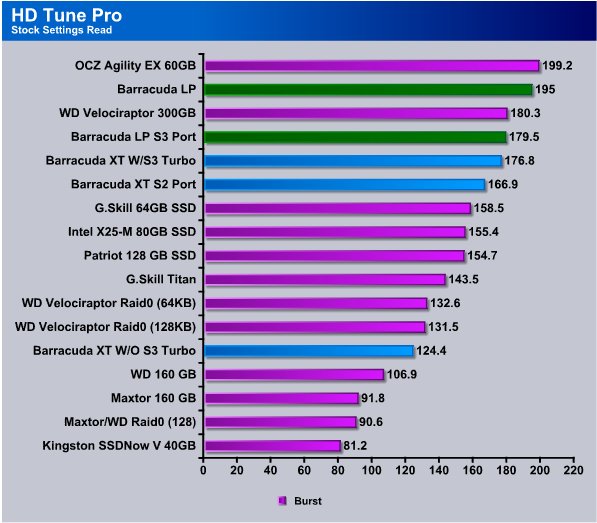
Burst speed which is a Cache hit transfer the Barracuda LP took top honors for platter drives and came in at 195MB/s and the Barracuda XT topped out at 176.8MB/s on the Sata 3 port with Turbo enabled. On the Sata 2 port it gave a respectable 166.9MB/s and on the Sata 3 port without Turbo performance dropped to 124.4MB/s. Despite what we have heard about Sata 3 Turbo/Non-Turbo we can’t help but feel that there is a difference in performance between the two settings on the Gigabyte P55A-UD6, that seems to show up mostly in Burst testing.
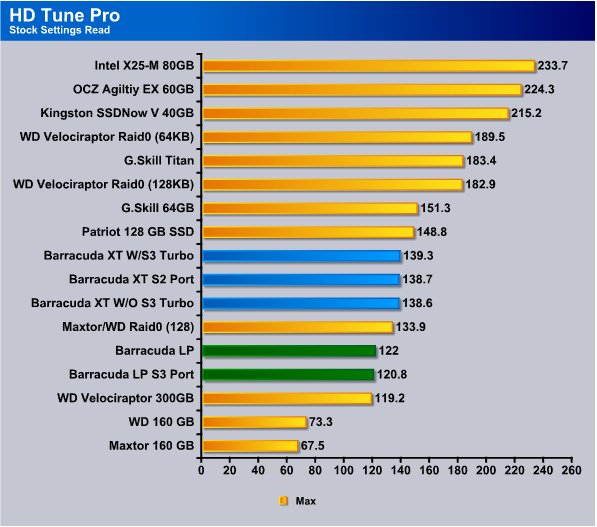
The Maximum speed on the Barracuda XT came in at 139.3MB/s on the Sata 3 port with Turbo enabled but here again we see minimal differences between and port we had the Xt on. Notice the Barracuda XT is turning in 20MB/s more sped than the Velociraptor in this test. We can just imagine what this drive would do if it had the same rotational speed of a Velociraptor. We would suspect that one of the reasons the XT is able to outstrip the Velociraptor is hard drive platter density. The Seagate Barracuda has a higher platter density and the read write head doesn’t have to move as far to read or write the same amount of data.
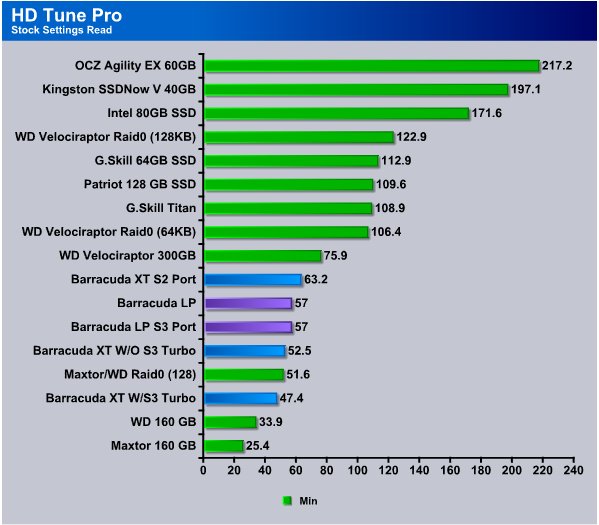
Minimum speeds on the Barracuda XT were a little lackluster but for the most part the drops in speed were so momentary it was merely a blip on the screen. Just a fraction of a second drop in speed that doesn’t affect average speed by more than 1 – 2 MB/s looks bad in the minimum speed test. While 50MB/s isn’t a bad score and 47.4MB/s isn’t something to sneeze at we expected a little better but this early in the interfaces design we can understand little glitches.
HDTach
HD Tach is a physical performance hard drive test which utilizes a special kernel mode VXD in order to get maximum accuracy by bypassing the file system. A similar mechanism is used in Windows NT/2000.
The HD Tach sequential read test is a little bit different from other benchmarks. Most benchmarks create a file on the hard drive and test within that file.
The problem is that modern hard drives use a zone bit recording technique that allows different read speeds depending on where the data is located. Data on the outside of the drive is much faster than data recorded on the inside. SSD’s are freed from this limitation due to their Nans Flash technology.
HD Tach reads from areas all over the hard drive and reports an average speed. It also logs the read speeds to a text file that you can load into a spreadsheet and graph to visually read the results of the test.
In addition to sequential read, HD Tach tests the drive’s random access time. Random access is the true measure of seek speed. Many drives advertise sub 10 millisecond seek speeds, but seek speeds are misleading.
Finally, HD Tach tests the drive burst speed. The burst speed is the speed that data can be accessed from the drive’s on-board read-ahead memory. This measures the speed of the drive and controller interface.
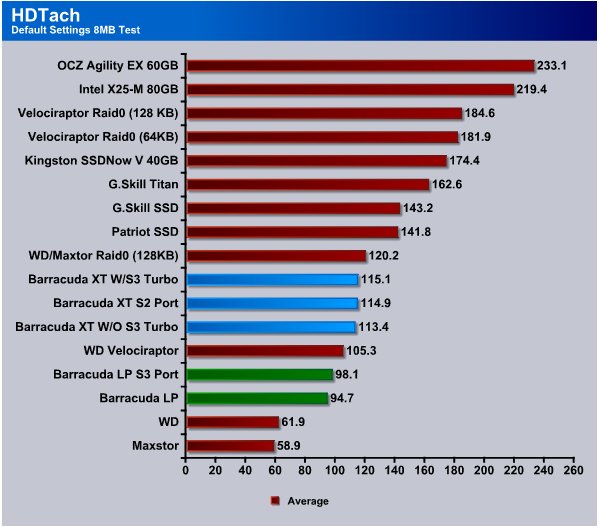
HDTach sees a much closer performance from the Barracuda XT and we suspect that HDTach is more well equipped than the now long in the tooth ATTO. The Barracuda XT hit 115.1MB/s with Turbo, and 113.4MB.s without Turbo, and 114.9MB/s on the Sata 2 port. For the first time the Barracuda LP did better on the Sata 3 port but the speed is down in the sub 100MB/s speed which is to be expected from a 5900 RPM Green drive.

Burst testing shows the Barracuda XT’s massive 64MB cache has an advantage. Burst testing is typically cache only transfer speed and the massive 64MB cache on the XT gave us a 296.6MB/s. Burst testing on the XT without Sata 3 Turbo dropped it to 182.3MB/s so there is a significant difference there. The Barracuda LP which has 32 MB cache ran in the 220(ish)MB/s range.
Crystal Disk Mark
Crystal DiskMark is a simple hard disk benchmarking software that can perform sequential or random read/write tests on a selected drive. You can select the number of read/write operations as well as the size of the data sample. The program presents you with easy to read MP/s results for each test. Standalone software, no installation required.
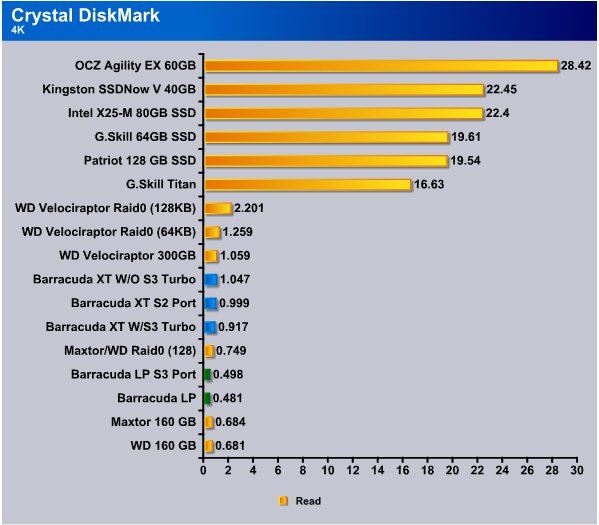
Getting to the 4K read test in CDM, and we’ve said this many times, the 4k test is brutal and typically on platter drives you see 1MB/s and under and that’s completely normal for 4k continually repeated writes. It’s a brutal test. The Baracuda XT barely breaks the 1MB/s (Sata 3 No Turbo) barrier and previously the only platter drive (Sata) to do that, that we’ve tested was the Velociraptor. Shifting the drive to Sata 3 with Turbo we got .917MB/s and on the Sata 2 port we got .999MB/s. The 4K test wasn’t nearly as kind to the Barracuda LP but it’s a 5900 RPM drive and designed for Green operation while still providing good performance.
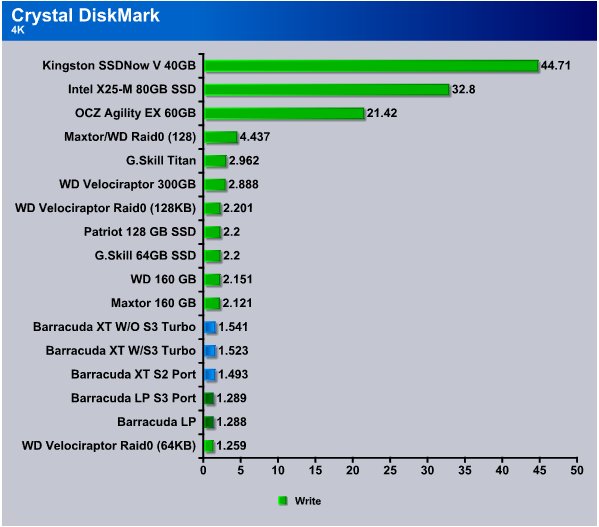
The Barracuda XT did a little better in the 4k write test and turned in a 1.541MB/s non-turbo Sata 3, Sata 3 with Turbo it slipped a little but not much and turned in a 1.523MB/s and on Sata 2 a respectable 1.493MB/s. The Seagate Barracuda LP was in the 1.28 MB/s range.
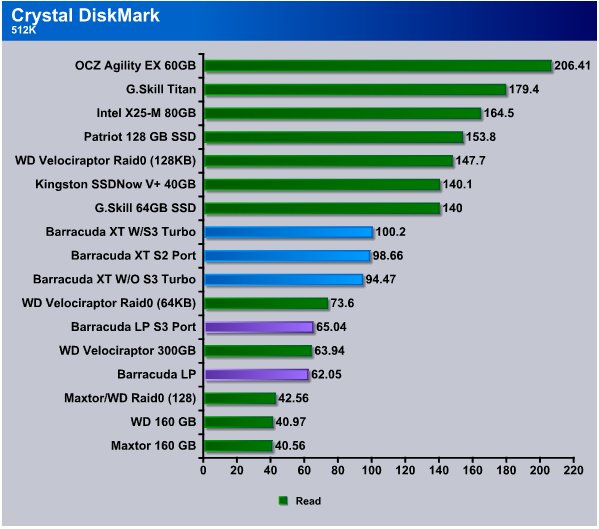
The 512k read test gives us an idea of larger but still reasonable sized writes and comes in at 100.2MB/s using Sata 3 Turbo mode, on the Sata 2 port we got 98.66MB/s and Sata 3 without Turbo 94.47MB/s. The Barracuda LP came in at 65.04MB/s on Sata 3 and 62.05MB/s on Sata 2. Again keep in mind the Barracuda LP is designed for a different role but it was the only platter drive we had available with the same platter density.

Sequential 512K write we see that the Seagate Barracuda LP hits 65.76MB/s without Turbo and 65.63MB/s with Turbo and 65.04MB/s on Sata 2. Throughout CDM testing we haven’t seen much difference between Sata 3, Sata 3 non-Turbo and Sata 2. Since Sata 3 drives won’t saturate the available bandwidth of the interface at this time we expected this to be the case. What you have to keep in mind it that this is the first generation of Sata 3 drives and interfaces and Sata 3 might be challenged by Solid State Drives in RAID configurations but the interface is designed for future needs and as platter density on drives increases (and rotational speed) the platter drives will consume more of the bandwidth. So Sata 3 while in it’s infancy isn’t utilizing the bandwidth this is just the baby step portion of development and yet we may get some benifit from soon to be released Sata 3 SSD’s.
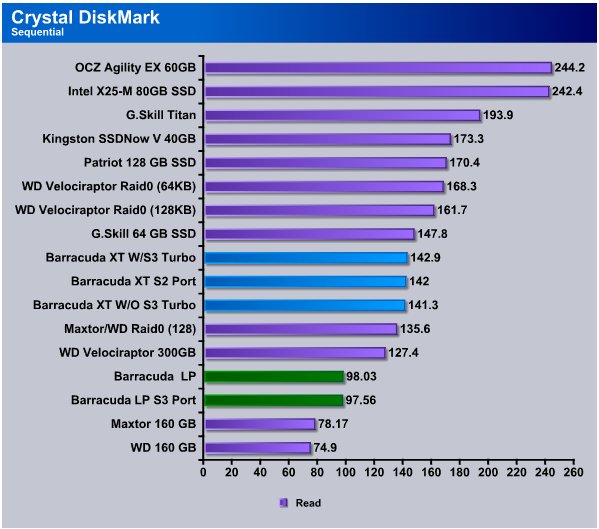
Here’s where CDM gets interesting, the Barracuda XT with Sata 3 Turbo hits 142.9MB/s and on the Sata 2 port 142MB/s and finally on the Sata 3 without Turbo 141.3MB/s. Notice the mighty Velociraptor setting down there at 127.4MB/s. The Barracuda XT isn’t what you might call a slacker in sequential reads.
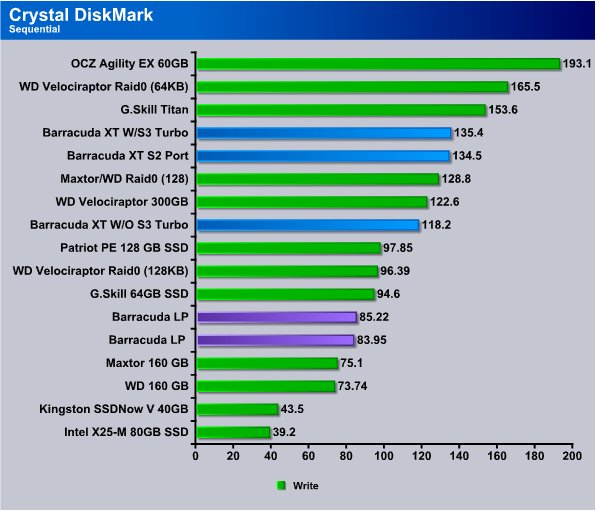
Here again we see the Barracuda XT hitting stride at 135.4MB/s in Sata 3 Turbo, and once again it’s looking down at the Velociraptor. With the XT on the Sata 2 port we see 134.5MB/s and Sata 3 without Turbo 118.2MB/s which frankly is more than we expected from the information we got from Gigabyte.
PCMark Vantage
This new version of PCMark shifts its focus away from only providing pure hardware performance-analysis results, to generating accurate performance ratings based on popular Windows Vista Consumer Scenarios ranging from media and entertainment to productivity and communication. PCMark Vantage incorporates an updated interface with easier access to test details and selections, results, system info and other features for 32 and 64-bit computers.
In this case we are primarily looking at the HD suite in PCMark Vantage and since we run the professional version we can select just that Suite. Since PCMark Vantage is based on Windows Vista workloads, and Windows 7 is (forgive us oh Microsoft deities) very similar to Vista it should provide some interesting non-synthetic drive transfer results.
Be warned that non-synthetic drive transfer rate results are often shocking when compared to standard synthetic benchmarks which tend to shoot for top end performance numbers.
HD Suite Overall Results

We realize that the overall score doesn’t do much for us when it comes to what speeds the drive actually achieved but it’s good for comparison to it’s slower spindle sped brother the 5900RPM LP. Top end score for the Barracuda XT on Sata 3 Turbo is 5503 while non-Turbo drops to 5326, and Sata 2 which fared well in synthetic benchmarks dropped even farther to 5078. The Barracuda LP comes in at 3866 Sata 2 and 3845 Sata 3 which confirms the performance hit from using a Sata 2 drive on a Sata 3 port on Gigabyte boards.
Application Loading
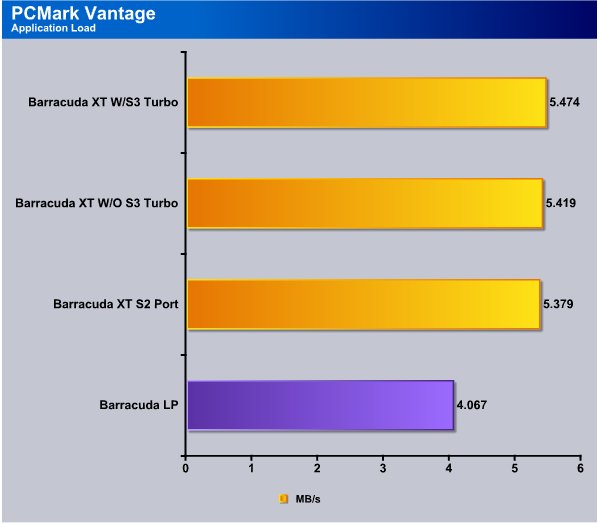
Here’s where the shock sets in, while synthetic benchmarks show speeds in excess of 100MB/s on a lot of drives the Application load test shows that we are getting 5.474MB/s in Sata 3 Turbo with non-turbo Sata 3 coming in at 5.419MB/s and on Sata 2 the Barracuda XT turned in a 5.379MB/s. We just ran the Barracuda LP on a Sata 2 port for this series of tests to confirm the transfer rates and it turned in a 4.067MB/s.
Gaming
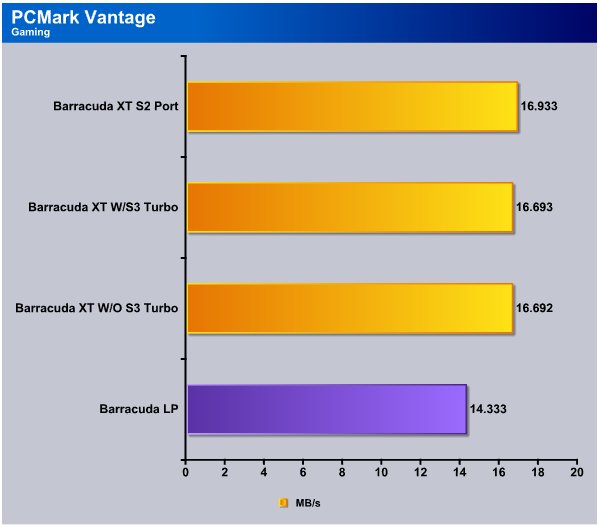
Gaming tests in Vantage show a little improvement and gave the advantage to the Barracuda XT while on the Sata 2 port, closely followed by the XT with Sata 3 Turbo, and then Sata 3 without turbo The difference between turbo and non-turbo was almost non-existent. The Barracuda LP turned in 14.333MB/s which is great considering it’s a low power consumption Green drive.
Media Player
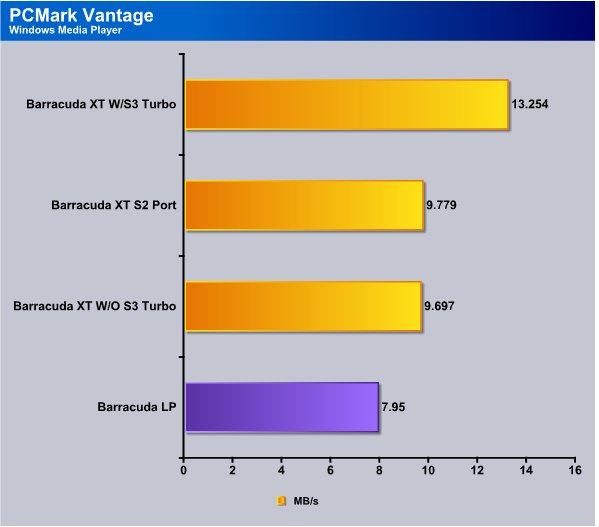
Windows Media Player sees the Barracuda XT running at 13.254MB/s with Turbo enabled and we get a serious drop to 9.779MB/s on the Sata 2 port, and a slight drop to 9.697MB/s without Sata 3 Turbo. The LP version (Sata 2 LP drive) comes in at 7.95MB/s.
Photo Gallery

Vantage sees importing pictures to Windows Photo Gallery giving advantage to the Barracuda XT while running on the Sata 2 port, and it’s neck and neck for non-Turbo and Turbo Sata 3. The Barracuda LP is still turning in respectable numbers for a Green Drive.
Vista Startup
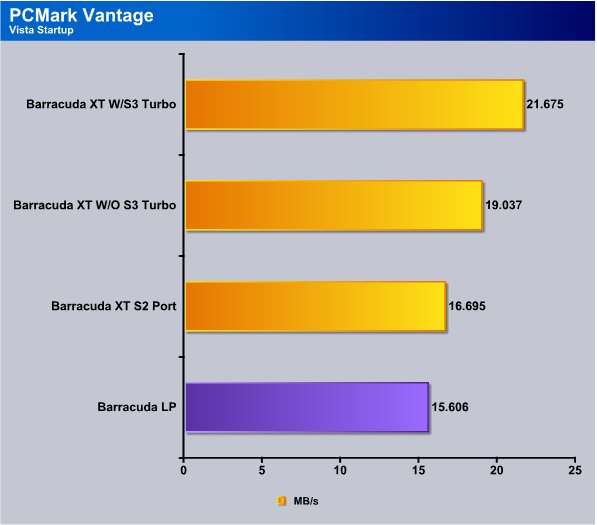
The Vista Startup portion of Vantage shows the Barracuda XT hitting 21.675MB/s in Sata 3 Turbo Mode, and Sata 3 without Turbo 19.037MB/s. While attached to the Sata 2 port the XT drive runs at 16.695MB/s and the Barracuda LP drive hits 15.606MB/s.
Windows Defender
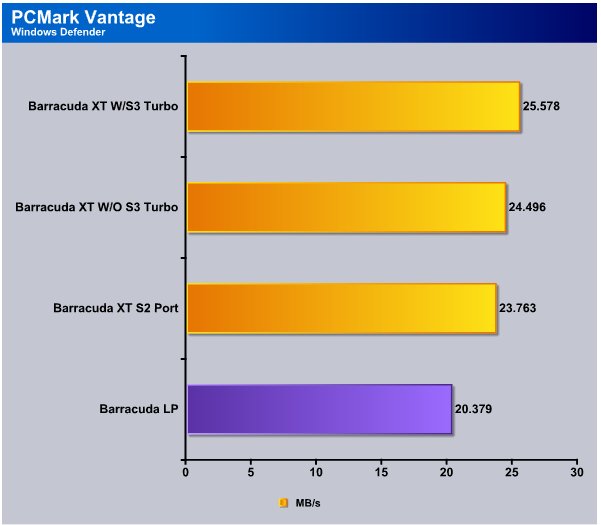
Vantages Windows Defender test shows the Barracuda XT with Turbo hitting 25.578MB/s and without Turbo 24.496MB/s. On the Sata 2 port the XT turned in a 23.763MB/s and the LP drive turned in a 20.378MB/s and of course it was on the Sata 2 port.
Media Center
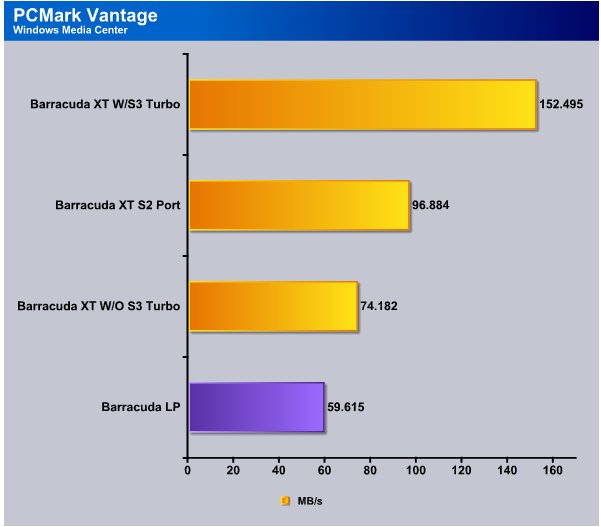
We aren’t sure about the Media Center results and we may be seeing a cache hit on the Sata 3 Barracuda XT but with such high numbers on all the drives we suspect that this result is accurate. We ran it a total of six times to make sure the results were consistent.
Movie Maker
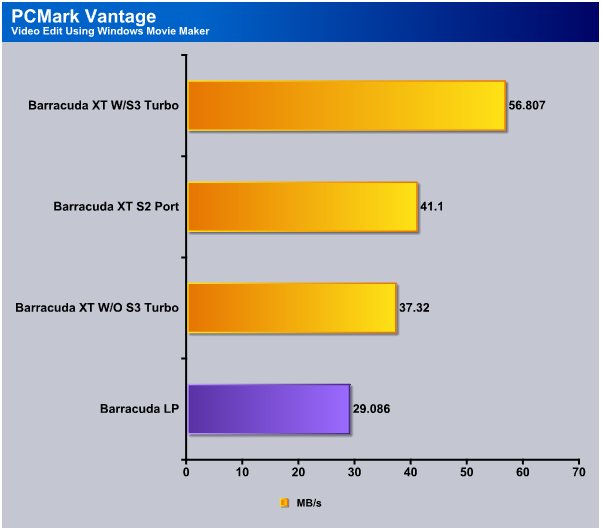
Video Editing using Windows Movie Maker shows the Barracuda XT with Sata 3 Turbo hitting 56.807MB/s and on the Sata 2 port only 41.1MB/s. Without Turbo but still on the Sata 3 port we got 37.32MB/s and the LP drive hit 29.086MB/s. We checked our settings a bunch of times and we don’t understand why we got such large differences between Sata 3 non-turbo and Sata 3 Turbo but the settings were consistent across testing.
Benchmark Screen Shots
We took a few screen shots of the Barracuda XT we wanted to put out there. Some of the HD testing utilities produce transfer rate graphs that provide extended information beyond what a Bar chart can convey in a palatable manner.
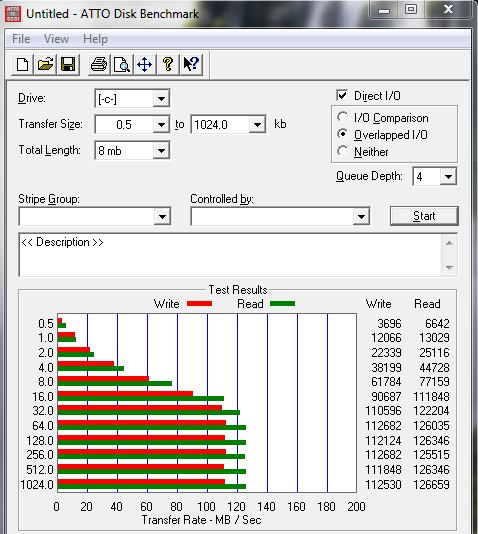
ATTO is a little long in the tooth but we found it interesting that the Seagate Barracuda XT leveled out transfer speeds on relatively small transfers. Notice that in this shot of the XT running on the Sata 3 port with Turbo enabled that at 16kb it hits 90.687MB/s Write and 111.848MB/s Read, then levels out at 32kb and transfer speeds don’t vary much from that point on.
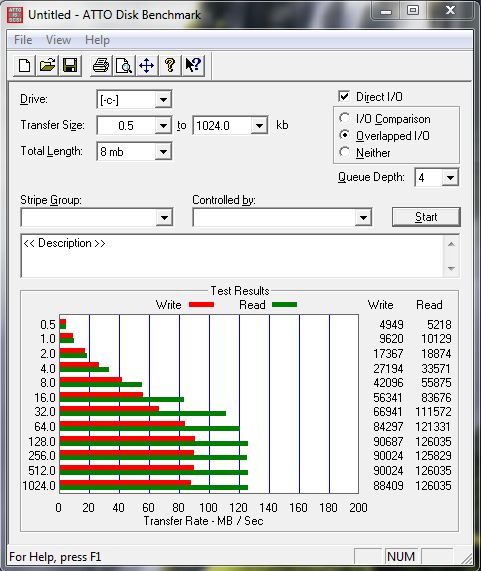
Now this is the sister shot to the previous shot and all we’ve done is go into BIOS and disable Sata 3 Turbo so it’s still running on the Sata 3 port but turning off turbo had an effect on the drive. Please note that Turbo is a function of the Gigabyte P55A-UD6 and not specific to the HD itself.
At 16kb on the previous screen shot we were reading 118.848MB/s and writing at 90.687MB/s and here with Turbo off we are reading 83.676MB/s and writing at 56.341MB/s so turning Turbo off on the P55A-UD6 is reducing bandwidth on the drive.
Here it is again, With Turbo on Sata 3 enabled on the P55A-UD6 it takes 8x PCI-E lanes from the first PCI-E slot and your GPU runs at 8x and SLI/Crossfire are disabled. With Turbo off you get SLI/Crossfire running at 8x8x or single card at 16x. Single card 8x isn’t going to hurt performance, but turning Turbo on you lose SLI/Crossfire. Here’s the bug in the pile, we ran the Turbo/Non-Turbo test probably 15 times in Atto and each time we got a performance decrease on the Barracuda XT when using Non-Turbo mode. So for all intents and purposes to get the optimal transfer rate on that board you need Turbo enabled, at least in this test.
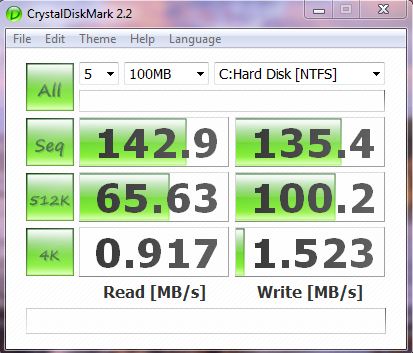
We got tired of playing with ATTO and moved to CDM, in this shot we are running in Sata 3 mode with Turbo enabled, and we got pretty good results.
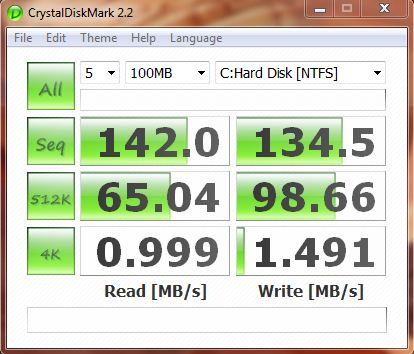
Then we hooked to the Sata 2 port and with the same drive got almost identical results as when the Barracuda XT was hooked to the Sata 3 port with Turbo Enabled. Sure there are minor speed differences but not enough to say the XT performed any better on Sata 3 than it did on Sata 3.
Then all this checking graphs and similar speeds on the Sata 3 port prompted a thought in our under caffeinated brains. HDTach graphs performance with a line graph so let’s screen shot that.
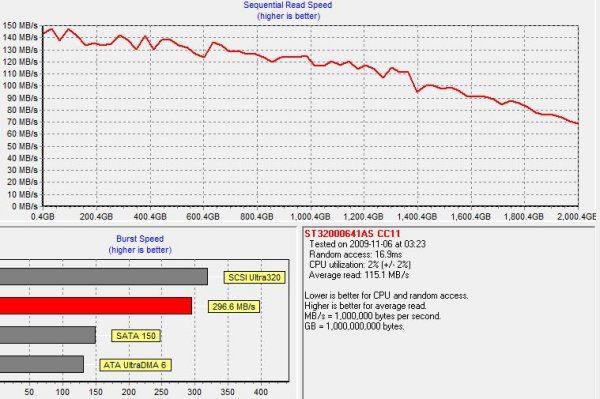
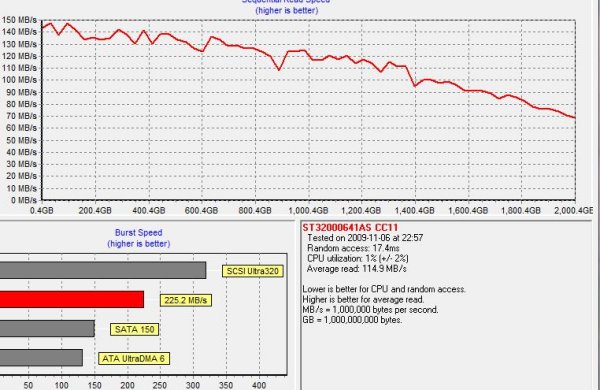
This shot above is on the Sata 3 port with Turbo enabled, and the shot below is on the Sata 2 port. The portion we are most interested in is the line graph. With the exception of the small valley on the screen shot below, that occurs between 800 4GB and 1,000 4GB (right below the word “Higher” in higher is better). As close as we can tell the line graph is identical with that one exception.
Sata 3 W/Turbo the burst rate was higher so if the data you were seeking was a cache only hit Sata 3 would be better in that instance. Sata 3 average read speed was 115.1MB/s and Sata 2 average read speed was 114.9MB/s and average read speed is where the money is at so to speak.
We don’t mention this to say anything bad about the Barracuda XT, not by any means but rather to show that Seagate has done an exceptional job optimizing the Barracuda XT for both Sata 3 and Sata 2. In some cases like ATTO the benchmark showed a preference for Sata 3, but in Vantage we saw almost no difference between Sata 2 and Sata 3 so if you want to pick up one of the Sata 3 drives and use it on your existing Sata 2 board in anticipation of a future upgrade your not going to get hurt by picking this Sata 3 implementation.
Conclusion
We took the long hard road on the Barracuda XT and studied and tested it as many ways as we could think of. Since it’s a new interface, on a new drive, it warranted a more through look than say a Sata 2 speed bump drive.
We like the Seagate Barracuda XT for a few reasons, mainly we like that it offers good performance on both Sata 3 and Sata 2. In our rational minds we weren’t expecting a major improvement in the speed and Seagate was very up front with that. In our enthusiast minds we saw theoretical speed limits on the new Sata 3 interface. Sometimes you just have to beat the enthusiast side of the brain a little and consider hardware limitations.
Given that the Barracuda XT has a pretty standard rotational speed of 7200 RPM, platter density that is the same as most 1 and 2TB Seagate drives, and that drives with those specs are almost maxed out on transfer speeds already we didn’t expect a major speed improvement.
What we did expect was a new interface capable of handling higher transfer speeds of drives in the next 3 – 5 years and that’s what we got. Leave it to Seagate to lead the industry and produce the first Sata 3 drive.
As technology improves and higher density drives appear the bandwidth that Sata 3 provides may be challenged. Increasing Rotational speed to 10k or even 15k might challenge the bandwidth the interface offers. Certainly high end SSD’s in RAID configurations will challenge it now. The design and concept of the Interface is a design aimed at the future and current platter drives in single drive operation aren’t going to challenge the bandwidth.
Now back to the drive itself. (We tend to get excited about new technologies and digress a little) We like the transfer speed the Barracuda XT provides, we like the huge 2TB storage it offers. We love the 64MB cache it has. For all intents and purposes the Barracuda XT is just as Seagate advertised it, a good speed bump, a good speed bump that paves the way for even faster drives down the line. That’s a good thing, speeds might not be as high as we had hoped in our enthusiast minds eye, but in our hardware limitation minds eye it performs just like we expected.
We are using an addition to our scoring system to provide additional feedback beyond a flat score. Please note that the final score isn’t an aggregate average of the new rating system.
- Performance 8
- Value 8
- Quality 10
- Warranty 9
- Features 9
- Innovation 9
Pros:
+ System Is Snappier
+ Backward Compatible With Sata 2
+ Quiet
+ 64MB Cache
+ Standard SATA Interface
+ Sata 3 Interface
+ Seagate Quality
Cons:
– Not A Major Speed Improvement
– Higher Price Than Other 2TB Drives
The Seagate Barracuda XT gives good performance on both Sata 2 and Sata 3 and is the first of what is sure to be a long line of Sata 3 drives. It’s not the Speed we had hoped for but when does expectation ever meet reality. With speeds hovering in the above 100MB/s range in benchmarks the Barracuda XT is a fast drive and the 64MB cache isn’t going to hurt anyone’s feelings. In all it’s a very capable drive and with 2TB of storage it’s not going to cramp your style when it comes to media or games.
Final Score: 8.5 out of 10 and the Bjorn3D Seal Of Approval.