Testing Methodology
The OS we use is Windows 8 Pro 64bit with all patches and updates applied. We also use the latest drivers available for the motherboard and any devices attached to the computer. We do not disable background tasks or tweak the OS or system in any way. We turn off drive indexing and daily defragging. We also turn off Prefetch and Superfetch. This is not an attempt to produce bigger benchmark numbers. Drive indexing and defragging can interfere with testing and produce confusing numbers. If a test were to be run while a drive was being indexed or defragged, and then the same test was later run when these processes were off, the two results would be contradictory and erroneous. As we cannot control when defragging and indexing occur precisely enough to guarantee that they won’t interfere with testing, we opt to disable the features entirely.
Prefetch tries to predict what users will load the next time they boot the machine by caching the relevant files and storing them for later use. We want to learn how the program runs without any of the files being cached, and we disable it so that each test run we do not have to clear pre-fetch to get accurate numbers. Lastly we disable Superfetch. Superfetch loads often-used programs into the memory. It is one of the reasons that Windows Vista occupies so much memory. Vista fills the memory in an attempt to predict what users will load. Having one test run with files cached, and another test run with the files un-cached would result in inaccurate numbers. Again, since we can’t control its timings so precisely, it we turn it off. Because these four features can potentially interfere with benchmarking, and and are out of our control, we disable them. We do not disable anything else.
We ran each test a total of 3 times, and reported the average score from all three scores. Benchmark screenshots are of the median result. Anomalous results were discounted and the benchmarks were rerun.
Please note that due to new driver releases with performance improvements, we rebenched every card shown in the results section. The results here will be different than previous reviews due to the performance increases in drivers.
Test Rig
| Test Rig | |
| Case | Test Bench |
| CPUs | Intel XEON E5-2687W |
| Motherboards | ASUS Rampage IV Extreme |
| Ram | Kingston HyperX Beast 64GB (8x8GB) 2133Mhz 11-12-11 Quad-Channel Kit |
| CPU Cooler | Custom Liquid Cooling |
| Hard Drives | 8x Western Digital RE4 2TB 7200RPM 3Gb/s Hard Drives (Raid 5) |
| SSD | 3x Kingston HyperX 240GB SATA III 6Gb/s SSD |
| Optical | ASUS DVD-Burner |
| GPU | MSI GTX 780 Lightning 3GB Video Card Nvidia GeForce GTX 770 2GB Video Card Nvidia GeForce GTX 780 3GB Video Card Nvidia GeForce GTX 680 2GB Video Card Nvidia GeForce GTX TITAN 6GB Video Card Nvidia GeForce GTX 690 4GB Video Card |
| GeForce Drivers | 320.14 (GTX 680, 690 and TITAN) 320.18 (GTX 780, 770) 320.49 (GTX 760) |
Synthetic Benchmarks & Games
We will use the following applications to benchmark the performance of the MSI GTX 780 Lightning video card.
| Benchmarks |
|---|
| 3DMark 11 |
| 3Dmark 2013 |
| Crysis 3 |
| Far Cry 3 |
| Metro 2033 |
| Unigine Heaven 4.0 |
| Batman Arkham City |
| Dirt 3 Showdown |
| Metro Last Light |
| Sniper Elite V2 |
3DMark 11

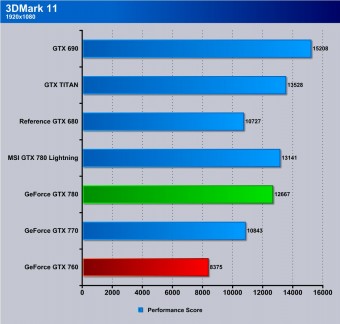
Here you see that the Lightning performance is very good and even comes close to TITAN territory which is nice to see for sure as even at its price premium it is much less expensive than the TITAN.
3DMark 2013
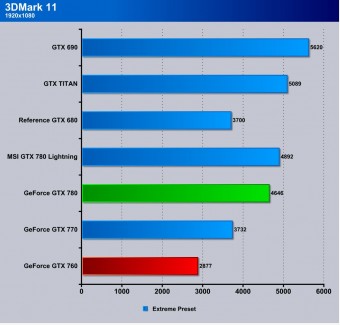
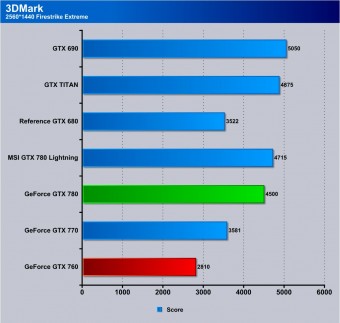
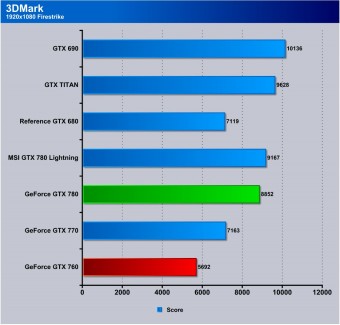
In 3DMark Firestrike and extreme the MSI 780 Lightning once again has a very strong showing easily pulling to the heels of the TITAN and beating out the reference model 780
Unigine Heaven 4.0

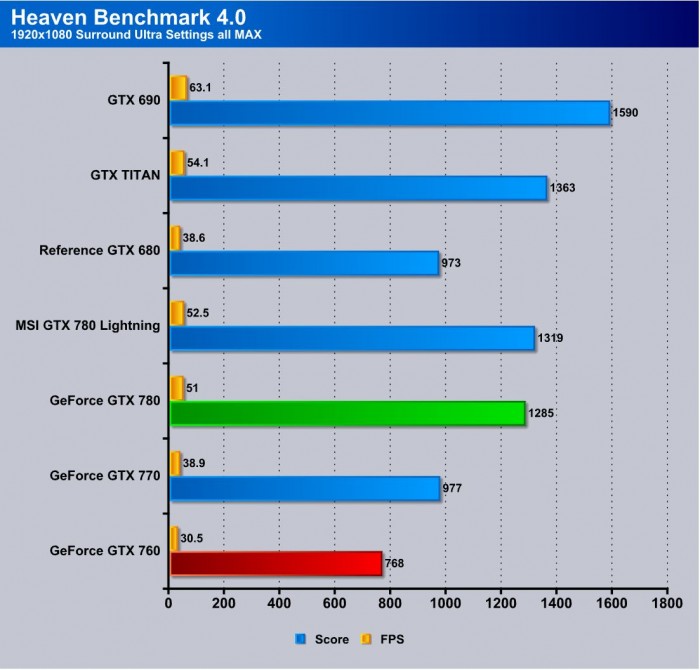
Unigine Heaven is a benchmark program based on Unigine Corp’s latest engine, Unigine. The engine features DirectX 11, Hardware tessellation, DirectCompute, and Shader Model 5.0. All of these new technologies combined with the ability to run each card through the same exact test means this benchmark should be in our arsenal for a long time.
Heaven shows the MSI Lightning pulling a solid 1.5 Average FPS over the reference 780 model which is a solid lead for a card with only a modest overclock out of the box.
Far Cry 3
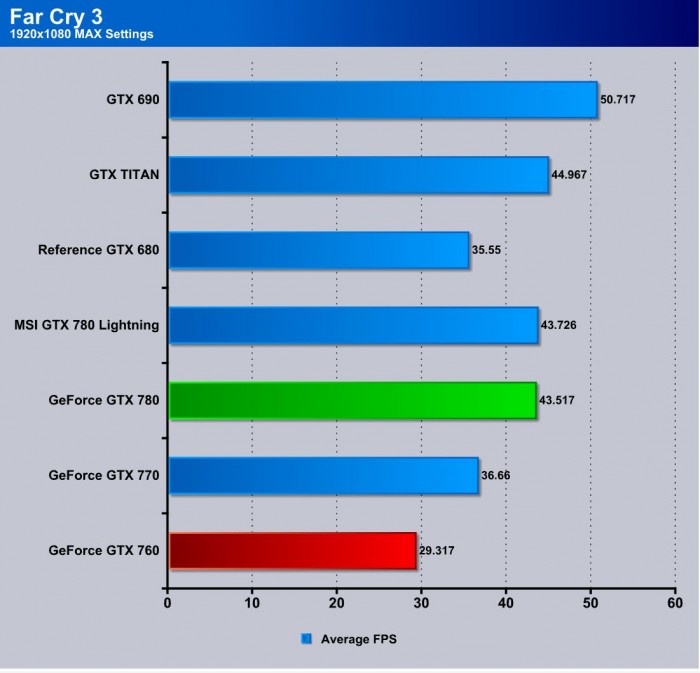
Moving over to Far Cry 3, we used a pre-determined path and re-ran each card to monitor average FPS across the complete run. Each run was completed multiple times to ensure continuity and accuracy. Here we see that the Lightning is slightly above the reference model card but not by a lot as this game simply does not have much room to grow with overclocking as even the titan barely leads the reference 780 here.
Metro 2033

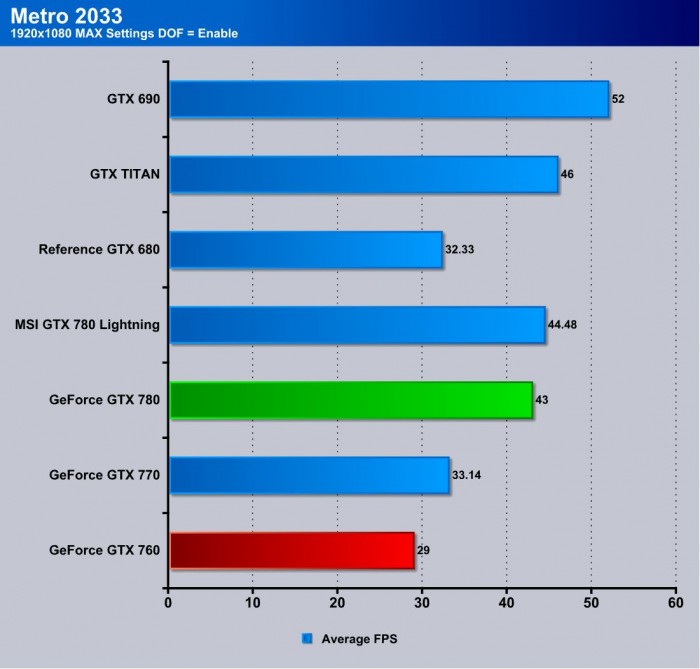
Even after many years, Metro 2033 is still one of the most demanding DX11 video games available to really push the limits of your system. Here the MSI GTX 780 Lightning pulls a almost 1.5FPS lead over reference again and about 1.5FPS behind TITAN so in the middle of the two which is not a bad spot to be.
Batman Arkham City

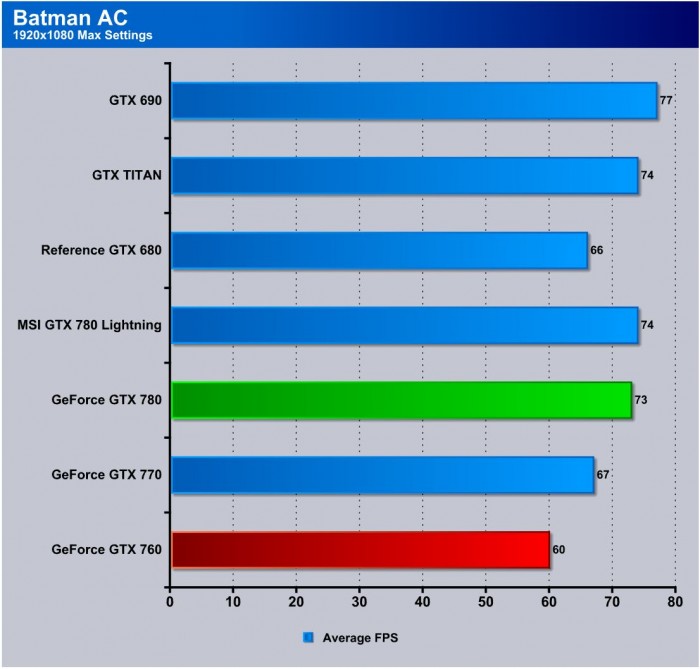
Batman Arkham City is a fun game and utilizes FXAA fully. It is nice to see the full screen anti-aliasing getting picked up by popular titles. When it comes to performance the MSI 780 Lightning pulls up to TITAN level performance on this test and I’m sure with even minor overclocking well past it.
Crysis 3
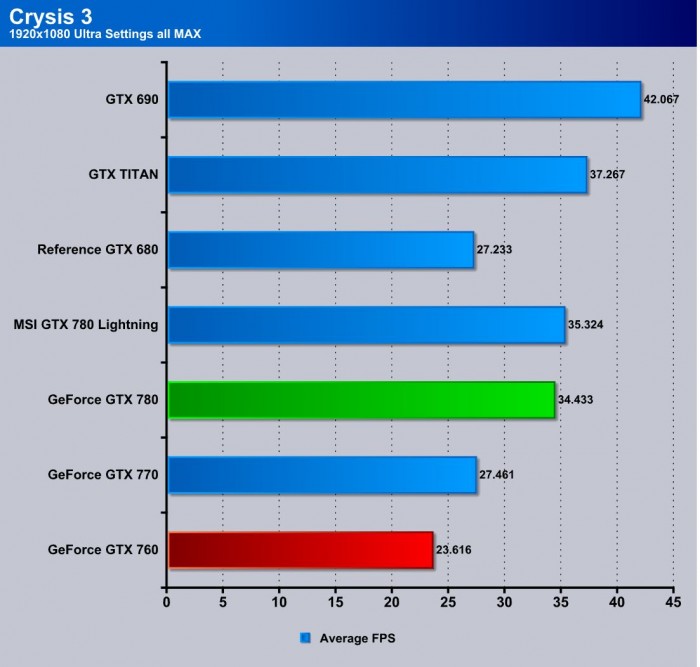
Crysis 3 is much like the original Crysis in that playing it at max settings is painful for even the highest end hardware. The MSI 780 Lightning does a respectable job here pulling a bit more shy of the TITAN this time and a bit closer to reference but still maintaining an average of over 30 FPS although at absolute max settings I would not rely on it to be completely playable as some stuttering was definitely apparent. For a single card your gonna want to tune down settings just a bit to ensure optimum playability.
Metro Last Light
Here we have Metro Last Light which is a brand new game added to our testing platform as it just came out. If you thought Metro 2033 was stressful you have seen nothing yet. The particles and lighting, as well as the PhysX effects all add up to an amazing looking game that can put a stun even the most powerful system in its tracks. Here the MSI 780 Lightning pulls a over 30FPS average but once again we see that it simply dips a bit too much into stuttering at maximum settings so you will want to tune this one back a few ticks to ensure optimum gameplay.
Sniper Elite V2
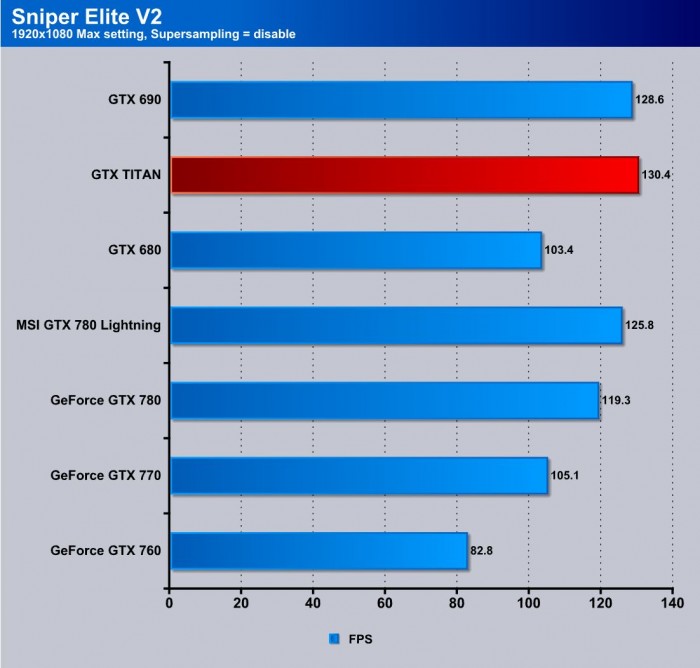
Sniper Elite V2 is a fun game which, when first released, was quite stressful but still playable on most higher end cards. By now, most cards have surpassed it, and all of the cards we are testing here today break the 60 FPS mark for average. The MSI 780 Lightning once again pulls a very strong lead over the reference model for which it is loosely based and pulls an average of 125+ FPS which is way more than enough to be completely smooth even with any dipping you may see as it never reaches even remotely close enough to see any stuttering.
Dirt 3 Showdown

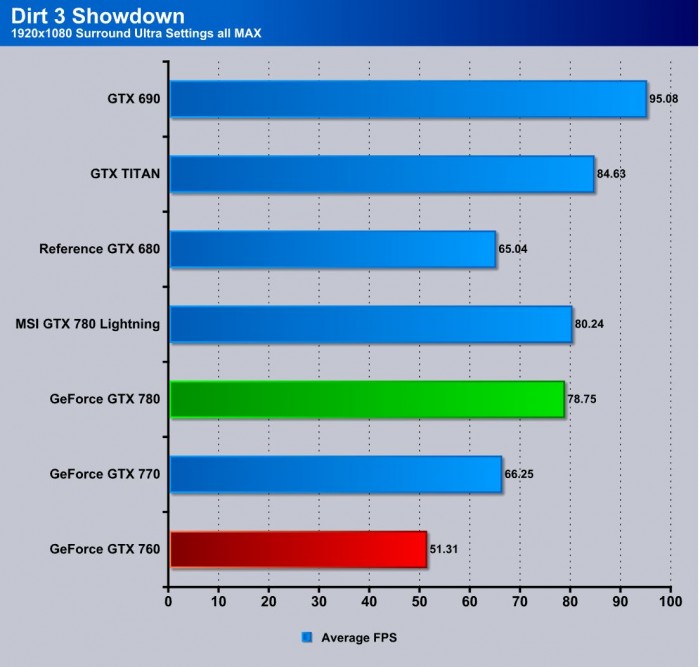
Dirt 3 Showdown is a visually beautiful game with excellent lighting and overall motion blurring creating a real visual spectacle of a game. The MSI 780 Lightning easily pulls a more than playable average at 78.75FPS average and honestly I never saw any signs of stuttering even in crowded racing or high paced movements.
Review Overview
Performance - 95%
Value - 85%
Quality - 95%
Features - 95%
Innovation - 90%
92%
The Lightning is an amazing benchmarkers card with everything including the kitchen sink thrown in. This card simply bleeds innovation and stands waiting for the next splash of LN2 to set its pace.
 Bjorn3D.com Bjorn3d.com – Satisfying Your Daily Tech Cravings Since 1996
