Testing & Methodology
We’ve expanded our testing suite considerably since the X79 chipset release, and will continue to use the same methods for most of the motherboards and CPU’s we test. In the interests of thoroughness and accurate results, we run each test at least three times, and some tests more than that. We average the total of all the tests from each benchmark then report the average here.
The OS we use is Windows 7 Pro 64bit with all patches and updates applied. We also use the latest drivers available for the motherboard and any devices attached to the computer. We do not disable background tasks or tweak the OS or system in any way. We turn off drive indexing and daily defragging. We also turn off Prefetch and Superfetch. This is not an attempt to produce bigger benchmark numbers. Drive indexing and defragging can interfere with testing and produce confusing numbers. If a test were to be run while a drive was being indexed or defragged, and then the same test was later run when these processes were off, the two results would be contradictory and erroneous. As we cannot control when defragging and indexing occur precisely enough to guarantee that they won’t interfere with testing, we opt to disable the features entirely.
Prefetch tries to predict what users will load the next time they boot the machine by caching the relevant files and storing them for later use. We want to learn how the program runs without any of the files being cached, and we disable it so that each test run we do not have to clear pre-fetch to get accurate numbers. Lastly we disable Superfetch. Superfetch loads often-used programs into the memory. It is one of the reasons that Windows occupies so much memory. Vista fills the memory in an attempt to predict what users will load. Having one test run with files cached, and another test run with the files un-cached would result in inaccurate numbers. Again, since we can’t control its timings so precisely, it we turn it off. Because these four features can potentially interfere with benchmarking, and and are out of our control, we disable them. We do not disable anything else.
One thing to note is that we are revamping our testing method in order to better represent performance and feature offering to you guys the consumer. Also we want to make it an easier read for you without miles of endless charts. Please feel free to provide feedback on what you think as many benchmarks will be shuffled or removed completely.
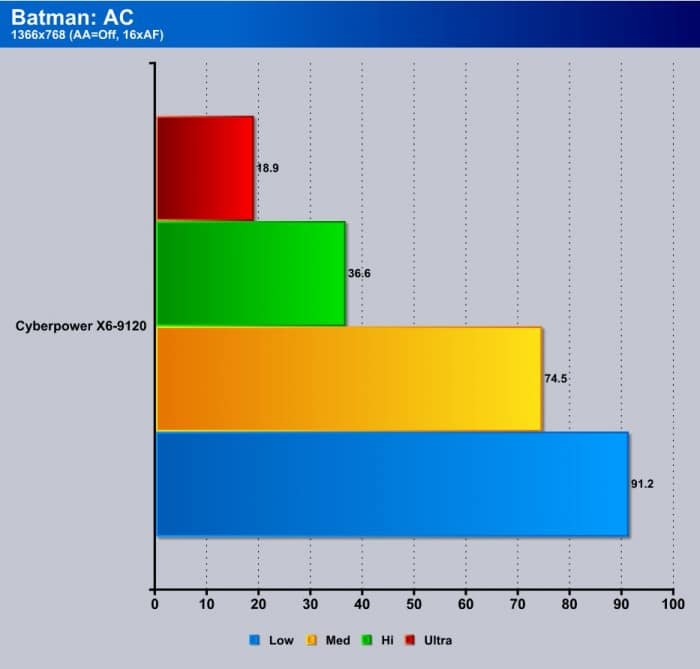
*All Gaming tests were done at standard notebook resolution of 1366×768 for a great gaming experience.
Test Suite
We will use the following applications to test the performance of the notebook.
| Benchmarks |
|---|
| 3DMark 11 |
| Cinebench R11.5 |
| PCMark 7 |
| SiSoft Sandra 2011b |
| Batman Arkham City |
| Crysis 2 |
| Dirt 3 |
| Deus Ex: Human Revolution |
| Total War: Shogun 2 |
| Sniper Elite V2 |
Temperatures

The temperatures were recorded while normal gaming and other tasks such as encoding video until we found what would product the highest thermals for the specific item. The results were recorded carefully. After the results were noted, we let the system sit idle for 30 minutes before taking Idle temperature measurements. We avoid running synthetic stress tests like LINPACK or FurMark, as these do not simulate realistic loads, and go well above normal operations. The results were as follows:
| CPU Temperatures | Temperature (Idle/Load) |
| Core i7-3610QM | 34C/76C |
| GPU Temperatures | Temperature (Idle/Load) |
| Nvidia GTX 670M | 30C/75C |
The results are quite good as mobile devices have very little room for airspace or cooling solutions. Im sure the more efficient Ivy Bridge and Kepler Architectures helped keep temps lower as well.
Battery Power

The Battery duration testing was performed by PowerMark which is a specially designed benchmark by Futuremark (Maker of 3DMark and PCMark) and shows battery expected life under different loading scenarios.
| Configuration | Runtime on battery |
| Light Load | 3h 12m |
| Medium Load | 2h 7m |
| Heavy Load | 1h 39m |
The power consumption tests are broken into 3 different loading types.
- Light load – Basic Desktop usage such as email, word and internet browsing
- Medium Load – Flash based games, video playback light gaming workloads
- Heavy load – 3D gaming, benchmarks or heavy rendering
Performance Benchmarks
SiSoft sandra 2011

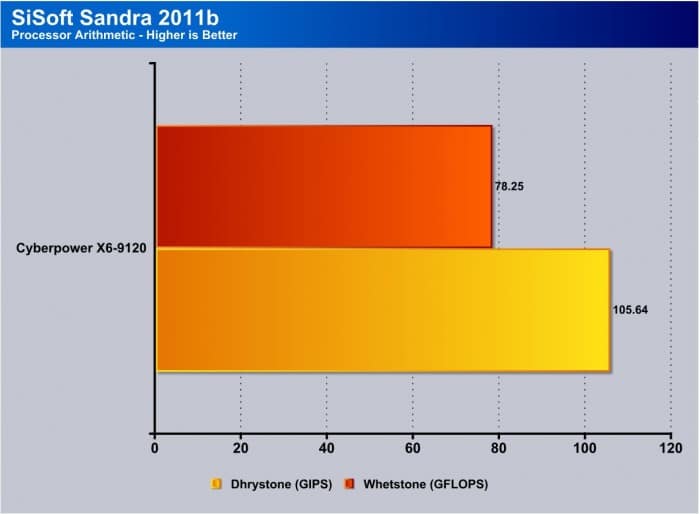
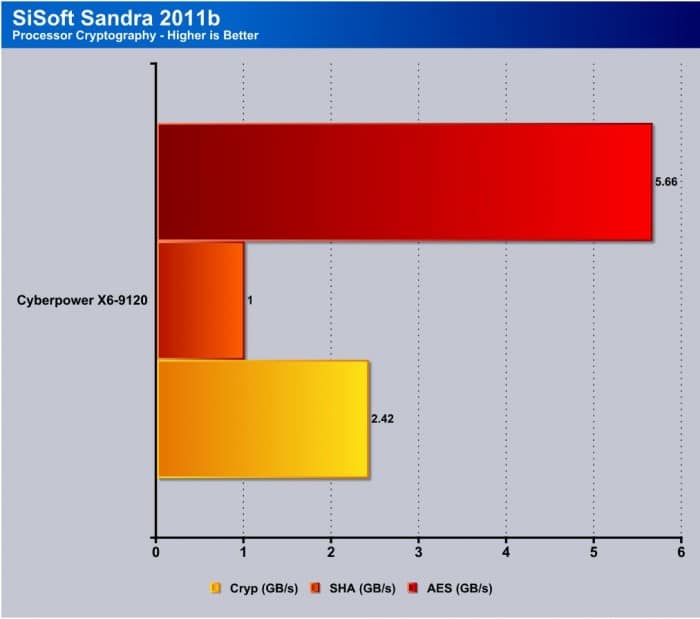
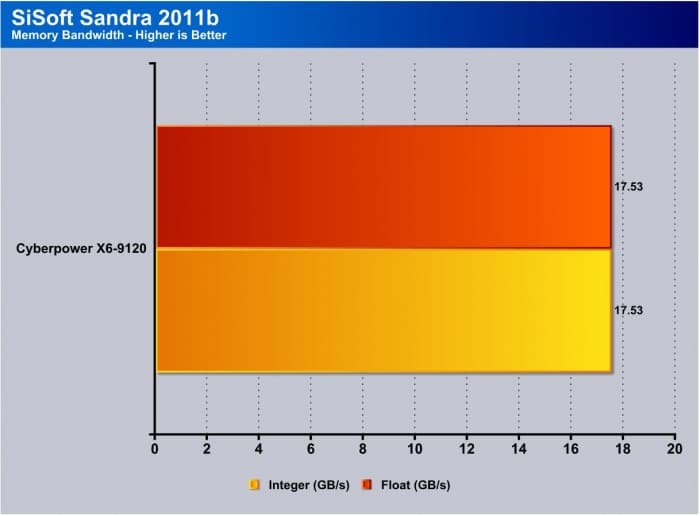
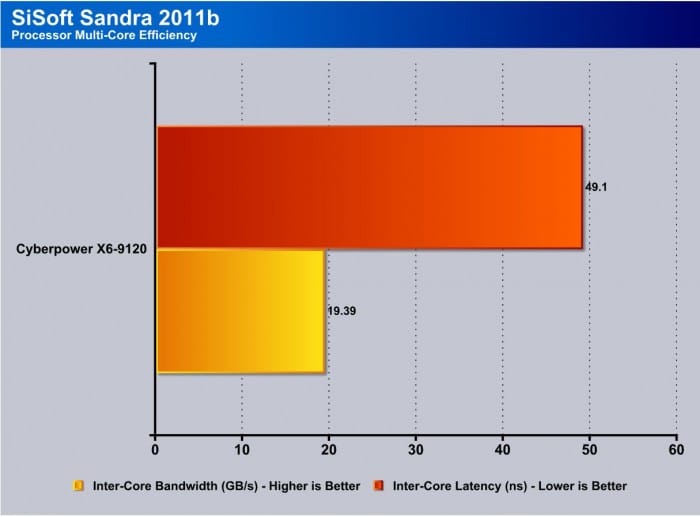
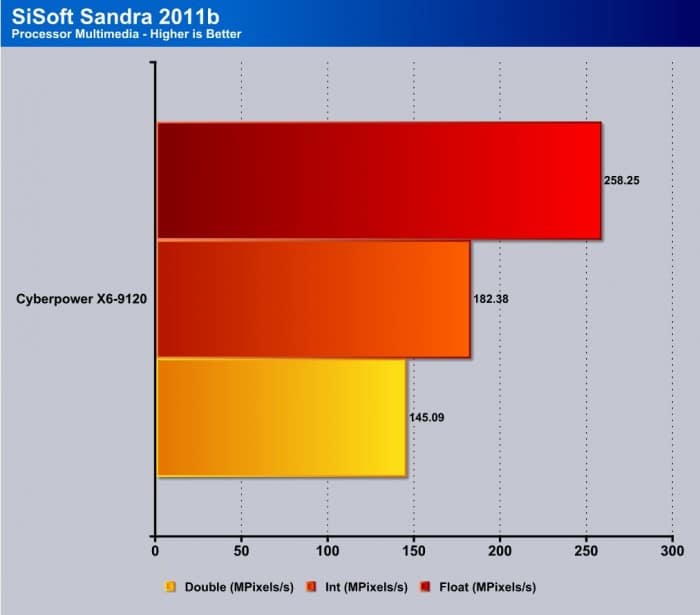
“SiSoftware Sandra (the System Analyzer, Diagnostic and Reporting Assistant) is an information & diagnostic utility. It should provide most of the information (including undocumented) you need to know about your hardware, software and other devices whether hardware or software. It works along the lines of other Windows utilities, however it tries to go beyond them and show you more of what’s really going on. Giving the user the ability to draw comparisons at both a high and low-level. You can get information about the CPU, chipset, video adapter, ports, printers, sound card, memory, network, Windows internals, AGP, PCI, PCI-X, PCIe (PCI Express), database, USB, USB2, 1394/Firewire, etc.”
SiSoft Sandra is a awesome test to demonstrate raw numbers for a systems capability. Here we see that the Ivy Bridge platform is quite efficient and can really pull off some good numbers. Overall raw processing power is nice but we think with some higher speed ram you could see a bit more potential from the processing side of things.
Cinebench R11.5
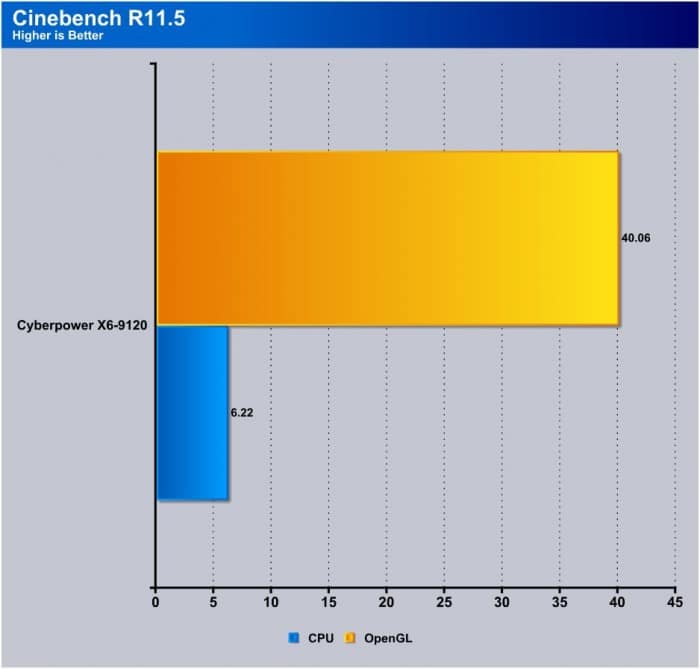
SuperPi is a single threaded benchmark which measures efficiency and is heavily influenced by architectural changes as much as it is by clockspeeds.
For a smaller laptop, the Cyberpower X6-9120 really shows some punch here which means mobile content professionals can rely on the hyper threaded quad core to simply do work for them. The GPU being CUDA capable means as more programs support the technology that can work in conjunction for some real processing power.
PCMark 7
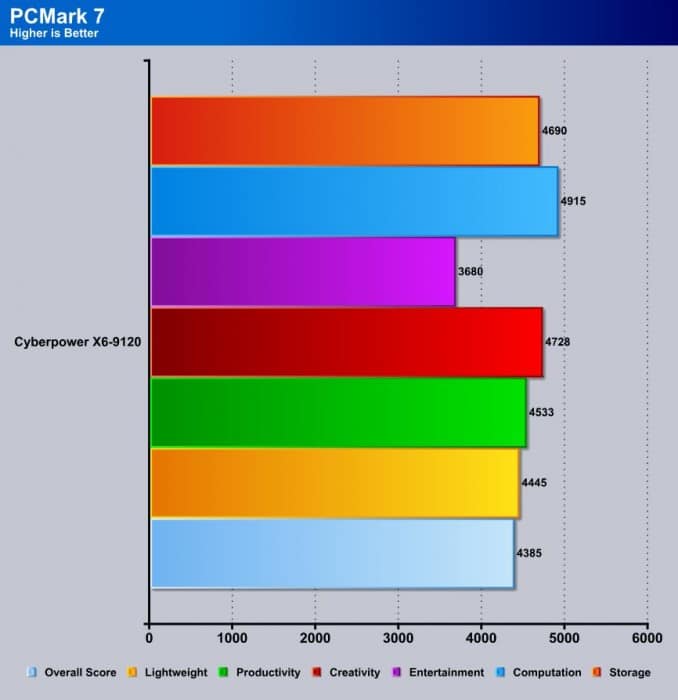
The PCMark benchmark gives a pretty good representation of system performance in multiple types of usage for your PC. Here we see that its pretty even across the board with definite prominence in the computation department due to the i7 with its 8 functioning threads.
3DMARK 11

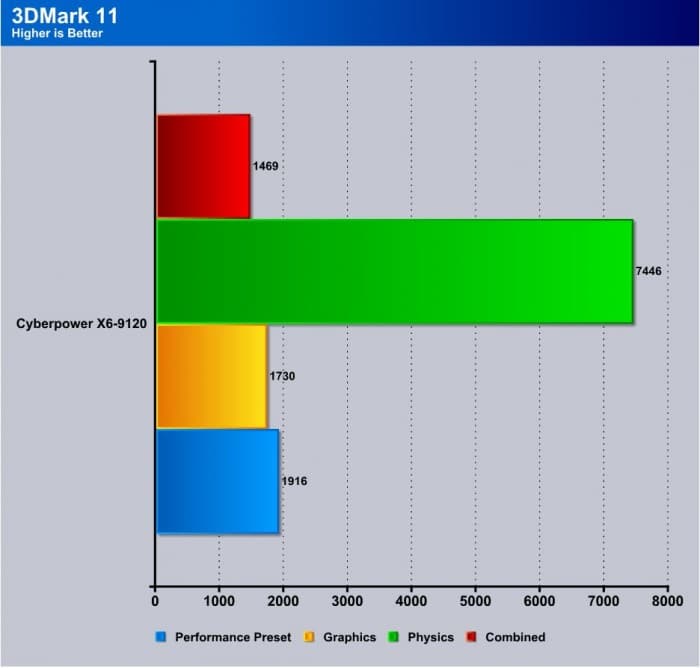
3DMark 11 is the newest in Futuremark’s suite of benchmarking utilities. Its a fully capable DirectX11 benchmark which also stresses and analyzes the system performance as a whole to simulate a heavy rendering environment such as a high end game or other app the end user may run. This benchmark was run with Performance settings 5 times and all runs were averaged for the result below.
Here we see how the notebook scores on 3DMark 11 which is futuremarks newest 3D Benchmark. Here once again you can see that the CPU is definitely some leaps and bounds above GPU power as this notebook offers loads of processing power. 3D performance is not bad but this notebooks strong point is its raw CPU performance.
Batman Arkham City
Here we see that in Batman: Arkham City all detail settings are playable up to high which averages at 36+ FPS but there are dips which get lower. Medium would be the best choice which will still provide a pretty and very playable gaming experience.
Crysis 2
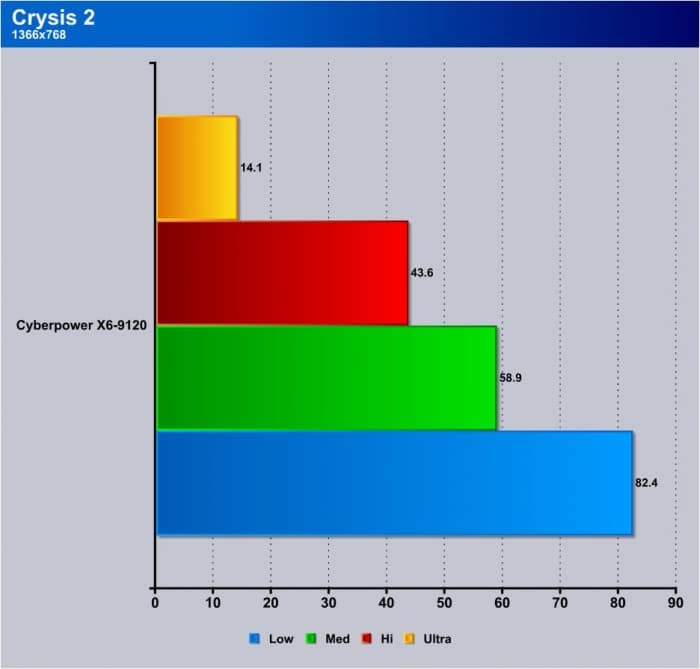
Crysis 2 was a bit more favorable as averages for high setting eclipsed 40 FPS quite easily which means even more playable detail at this setting.
Dirt 3
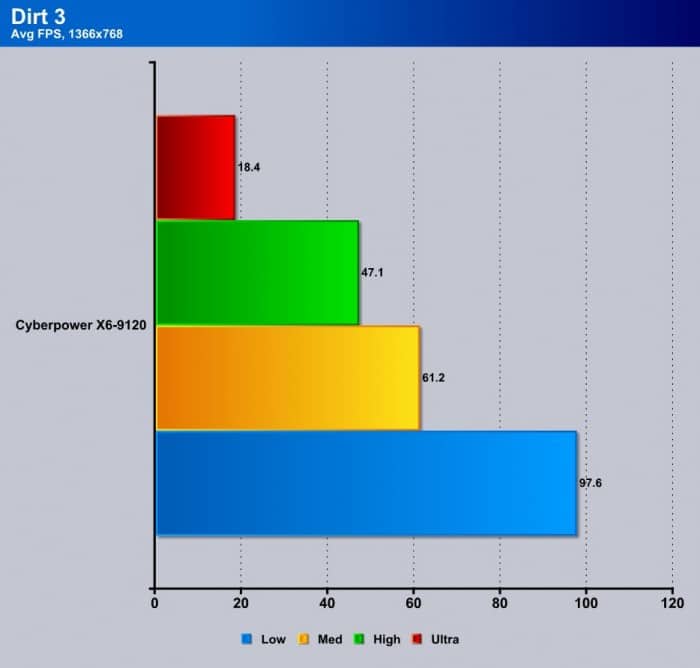
Dirt 3 provided some nice gameplay and quite capable gameplay performance at high settings as well with only minor hitches here and there with framerate drops.
Deus Ex: Human Revolution
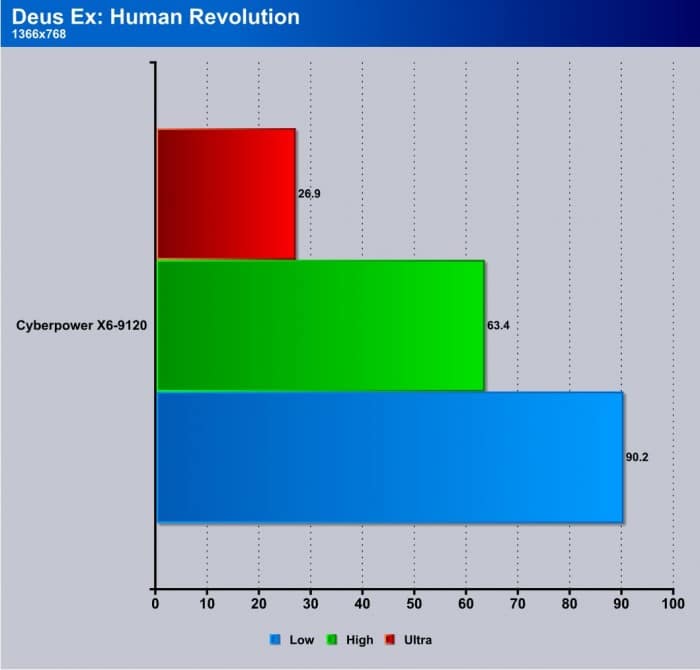
Deus Ex was more than capable of running at high settings but Ultra was a little out of reach as choppiness got in the way.
Total War: Shogun 2
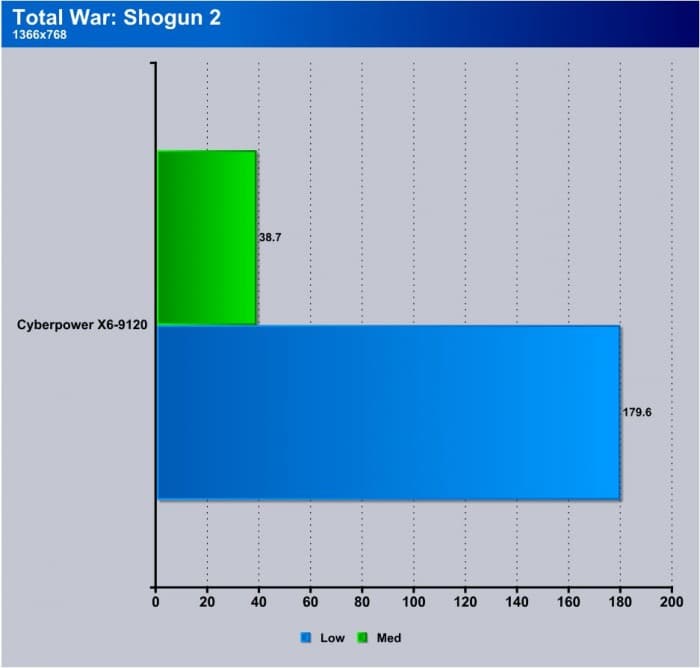
Shogun 2 is a bit newer of a game. The unit count is huge which really puts a hurt on the GPU at higher detail settings. For this reason it is tough to recommend medium as it simply can get big dips if entering the battle mode with a large army.
Sniper Elite V2
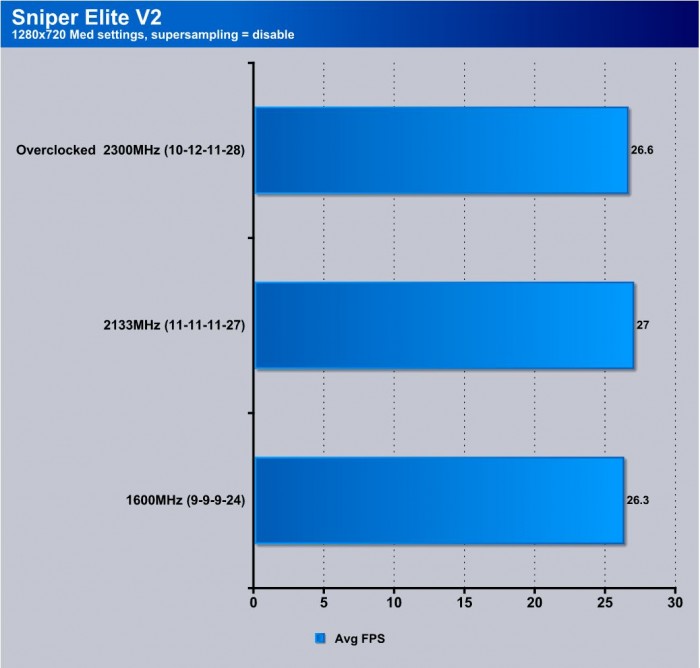
Sniper Elite V2 we had settings at medium and we were surprised that the game was almost playable at 1080p. To compare with the rest of the games, we stuck to 1366×768 where it actually does quite well. If any lags were there they must have been small because we did not really see them.
CONCLUSION
When testing components, we try to test them for their respective purpose. Considering that this notebook was made to dabble in some of everything, we feel comfortable testing it at standard notebook resolution for gaming tests and reserving the 1080p usage for HD video playback and video/photo work for content professionals. 1080p resolution gives much more screen real estate to work with and therefore also uses much more GPU power to game. If this laptop was a much more expensive unit, with perhaps a GTX670M, then we would feel a bit more inclined to test it at higher resolutions.
The inclusion of the SSD changes the whole character of the notebook as now it goes from waiting for loading to waiting for you to tell it what to do.
The only thing we could really complain about would be the piano finish on the laptop as it is simply a fingerprint and dust magnet. Also, in some spots the notebook plastic can flex a little but overall build quality feels solid.
We have no issue recommending this notebook for any student, gamer, mobile content professional or pretty much anyone looking for a high quality ultra powerful mobile rig. It simply performs well.
| OUR VERDICT: Cyberpower X6-9120 Notebook | ||||||||||||||||||
|
||||||||||||||||||
| Summary: The Cyberpower X6-9120 has amazing processing power and mobile gaming prowess. For this it earns the Bjorn3D Golden Bear Award. |
 Bjorn3D.com Bjorn3d.com – Satisfying Your Daily Tech Cravings Since 1996
