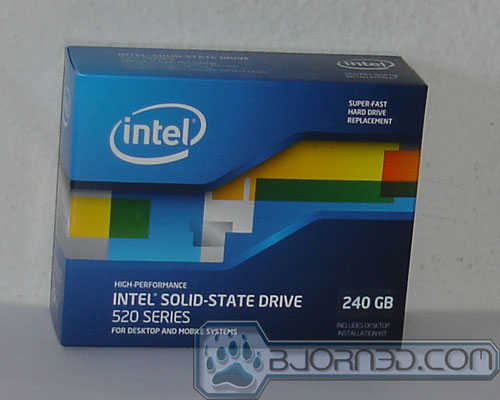
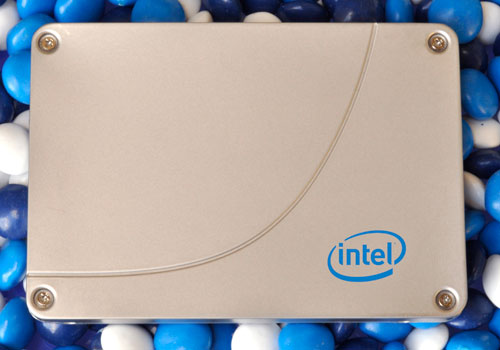
This drive has been advertised as the fastest SSD to date. Does it really pack the punch Intel claims it does? Keep reading to find out!
INTRODUCTION
Intel is one of the few companies that often leads the tech world in innovation and movement. This is especially true in in the microprocessor market, where the chipmaker has retained steady dominance ever since Conroe appeared on the market since 2006. While Intel may not always succeed in every single round (remember the Pentium 4?), the company often recovers quickly and regains its lead over the competitors. Big companies like Intel have both the resource and talent to keep their dominance.
Intel’s innovative nature led them to create the “tick-tock” plan for their CPU’s. They probably also have a similar plan for their SSD as they did with the CPU in which they start with a new controller first (tick) then fine-tune it and pair it with a die shrink of NAND (tock) for additional performance and storage capacity. We have seen this with the X25-M, which introduced the Intel SSD controller and utilized 50nm MLC NAND. The following year, Intel released the the X25-M G2, which utilizes 34nm MLC NAND and brings the capacity up to 160GB. Unfortunately for Intel, the SSD is a relative new area of technology where innovation advances are happening at alarming pace. Intel had originally planned to release the successor to the second generation X25-M in 2010 but the company could not produce a controller that was fast enough to compete against the Crucial C300 and the current market leader, the SandForce controller.
While Intel dominated the CPU market, it was not able to retain its market leader position in the SSD. The X25-M released in 2008 was a huge success, beating almost all its competitors in almost every benchmark; it was the best SSD available at the time. Unfortunately for Intel, its dominance was short lived as competitors such as SandForce- and Marvell-based drives quickly caught up with the industry leader. SandForce and Marvell have since designed controllers that are not only able to match Intel’s performance but also exceed it by a large margin.
Intel probably did not anticipate competitors such as Marvell and SandForce catching up with its own controller this fast. Not able to produce a controller capable of competing in today’s market, and unwilling to let the competitors to have all of the glory and most likely the market-share, Intel had to do something to stay in the SSD business.
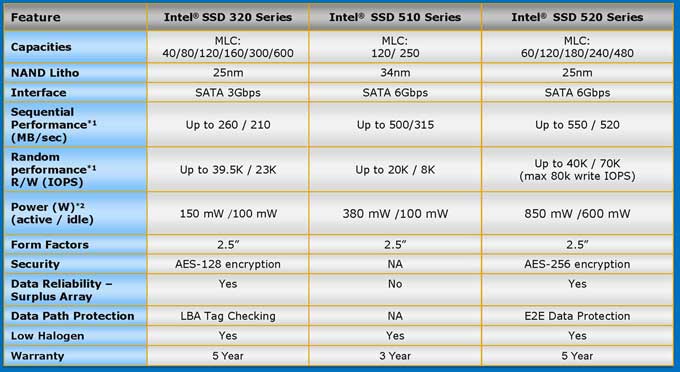
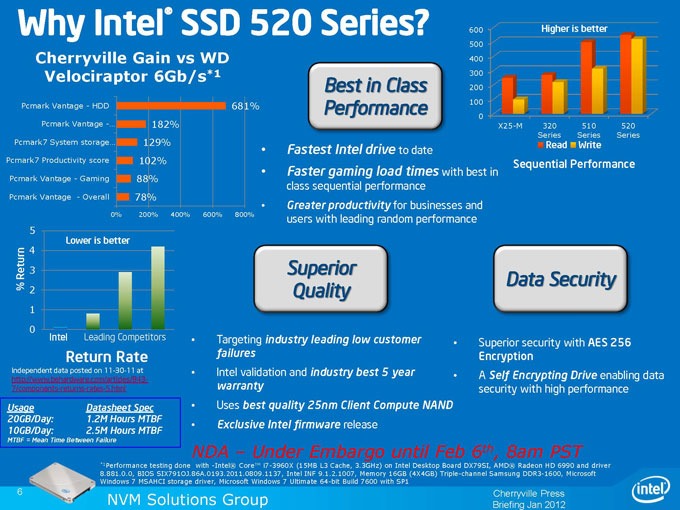
Intel has made a move rare for the chip giant: it recently started making SSD’s based on third-party controllers. Intel did this first with the SSD 510 which used a Marvell 9174 6Gbps controller. Marvell was the fastest and the only SATA III controller back in 2010. However, the SATA III-compatible SandForce 2000 series controllers have since taken the performance crown. In the industry where having the title of “fastest” is the key, Intel has decided to launch the successor to the 510 with a SandForce controller.
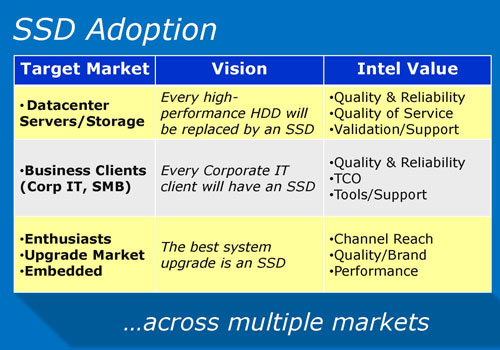
Intel’s vision with their SSD lineup is wide penetration into different markets. From the slides above, we can see that Intel wants not only sell the SSD to enthusiasts but also to business clients, datacenter, servers, and corporate ITs. Intel also wants to bring the SSD to the mainstream markets and OEM.
INTEL SSD 520 WITH SANDFORCE CONTROLLER

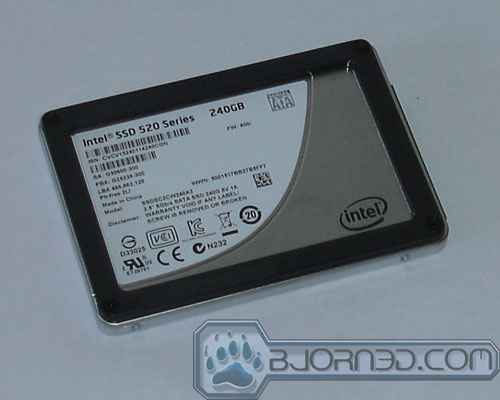
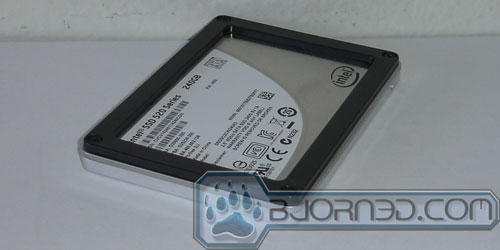
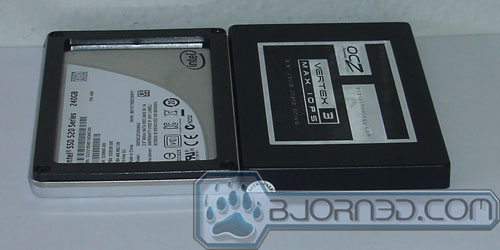
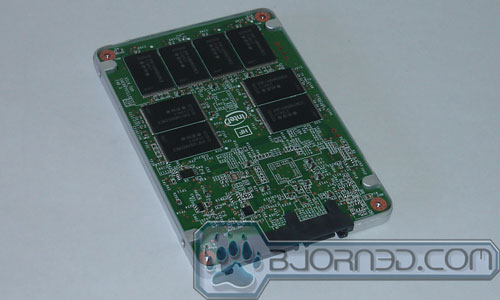
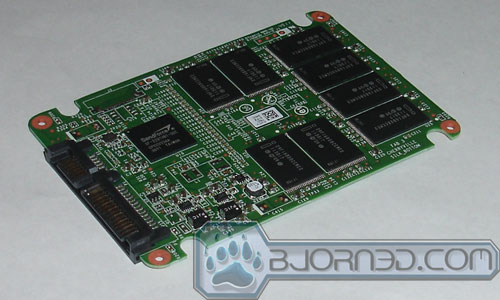
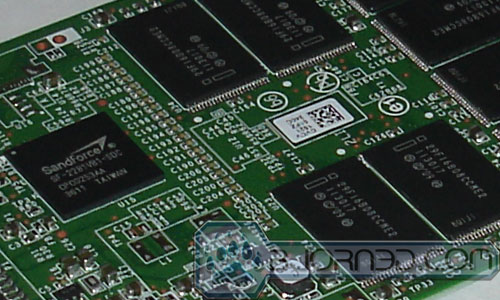
| Intel SSD 510 | Intel SSD 520 | Vertex 3 240 GB | Vertex 3 MAX IOPS 240GB | |
| Controller | Marvell 9174 | SandForce SF2281 | SandForceSF2281 | SandForceSF2281 |
| Sustained Sequential Read (MB/s) | 500 | 550 | 550 | 550 |
| Sustained Sequential Write (MB/s) | 315 | 520 | 520 | 500 |
| NAND Lithograph | 34 nm Toggle | 25nm Sync | 25nm Sync | 34nm Toggle |
| MTBF (hours) | 4,000,000 | 2,000,000 | 2,000,000 | |
| 4K Random Read (IOPS) | 20,000 | 50,000 | 40,000 (155 MB/s) | 55,000 (215 (MB/s) |
| 4K Random Write (IOPS) | 8,000 | 60,000 | 60,000 (235 MB/s) | 65,000 (250 MB/s) |
| Max 4K Random Write (IOPS) | N/A | 80,000 | 85,000 (330 MB/s) | 85,000 (330 MB/s) |
| Warranty | 5 year | 5 year | 3 year | 3 year |
| Price (for 240GB) | $565.99 (Retail) | $509 (MSRP) | $374.99 (Retail) | $479.99 (Retail) |
With the same controller and NAND, the Intel SSD 520 has more or less the same throughput as the OCZ Vertex 3. Because of this, it is the firmware that each company is able to tweak and optimize that yields a faster drive. The SSD 520 has the same sequential throughput of 550 MB/s and 520 MB/s read and write respectively. The drive is rated with a higher 4K random read IOPS of 50,000, as opposed to 40,000 on the OCZ Vertex 3. While both drives have the same 4K random write of 60,000 IOPS, the Vertex 3 comes ahead in the max 4K random write with 85,000 IOPS while the SSD 520 has 80,000 IOPS. The OCZ Vertex 3 Max IOPS still has higher IOPS than either one of the Vertex 3 or the SSD 520.
| Capacity | Price (MSRP) |
| 60 GB | $149 |
| 120 GB | $229 |
| 180 GB | $369 |
| 240 GB | $509 |
| 480 GB | $999 |
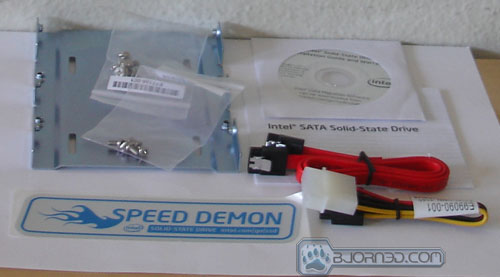
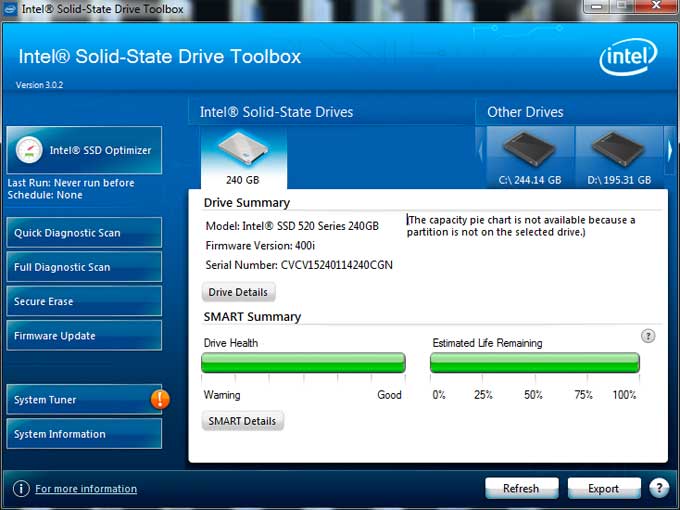
Accessory and Software


TESTING & METHODOLOGY
To test the SSDs, we cloned our test rig drive to the SSD. It is the same test drive we’ve been using on all of our drive testing and is nothing more than a clean Windows load with all the drive testing software installed, as well as all the current drivers and patches for the OS. It’s the equivalent of doing a fresh load of Vista from the disc but takes a lot less time and ensures that every drive tested uses exactly the same OS load and drivers. Nothing that may effect the outcome of the testing procedure can creep in. We ran all of the tests a total of 3 times and averaged those results. The Average of the three results are presented here. In the case of a pictorial benchmark we ran the bench 3 times and picked the median result. As with most SSD testing differences from run to run are minimal and the median result is a good indication of what you can expect from the drive.
We ran our usual battery of tests on the drive, and used it as the primary boot drive during testing. All of the drives tested were used as the primary boot drive during testing. That’s a more realistic test than strapping the drive in and testing it with a bare format or as a non-boot drive and it represents real life transfer rates, much like you can expect when you install and operate the drive in your own system. Each test was performed 3 times and the average of the 3 test run is reported here.
Test Setup
| Test Setup | |
| Case Type | None |
| CPU | Intel Core i5-2500K |
| Motherboard | Asus P8Z68-V Pro |
| RAM | Kingston HyperX 1600MHz |
| CPU Cooler | Prolimatech Megahalem |
| Storage Drives | Intel SSD 520 OCZ Vertex 3 MAX IOPS 240GB Silicon Power Velox V30 60GB OCZ Vertex 3 240GB OCZ RevoDrive 80GB OCZ Solid 2 60GB Kingston SSDNow V+ 128GB MLC OCZ Agility EX 60GB (SLC) Kingston SSDNow V 40GB (MLC) Kingston SSDNow V+ 128GB (MLC) G.Skill Titan 256 GB SSD (FM-25S2S-256GBT1) (MLC) Patriot 128GB Warp SSD (MLC) Intel 80 GB SSD X25-M G.Skill 64GB SSD (FM-25S25-64GB) (MLC) 2 WD VelociRaptor’s 300GB (In single and RAID 0) WD 160 GB SATA 2 Maxtor 160 GB SATA 2 WD & Maxtor in RAID 0 |
| Optical | None |
| GPU | Gigabyte GTX 580 SOC |
| Case Fans | 120mm Fan cooling the mosfet CPU area |
| Docking Stations | None |
| Testing PSU | Cooler Master UCP 900W |
| Legacy | None |
| Mouse | Microsoft Intellimouse |
| Keyboard | Logitech Keyboard |
| Gaming Ear Buds | None |
| Speakers | None |
Test Suite
| Benchmarks |
| ATTO |
| CrystalDiskMark |
| AS SSD Benchmark |
| PCMark Vantage |
| PCMark 07 |
| Iometer |
iometer: RAndom Read and Write
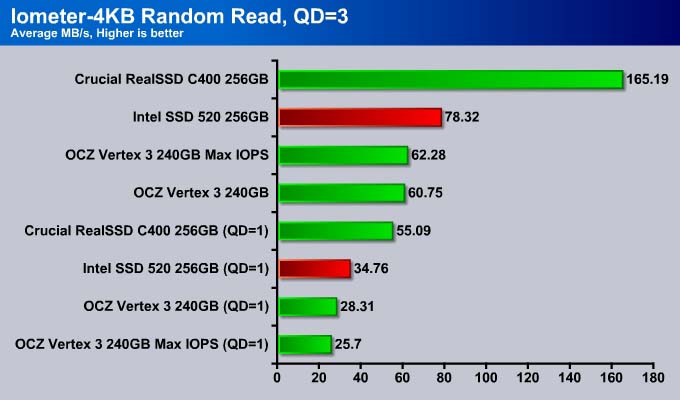
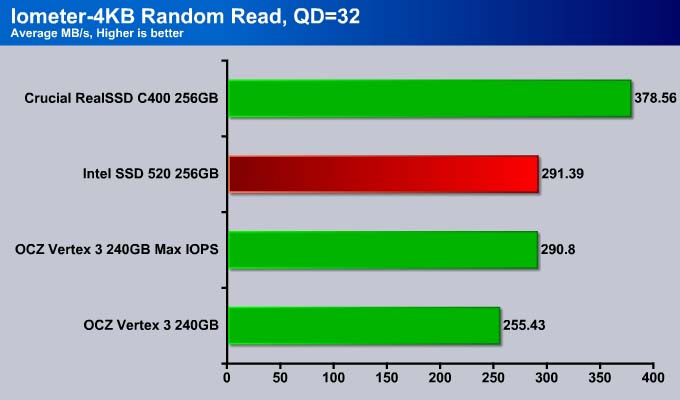
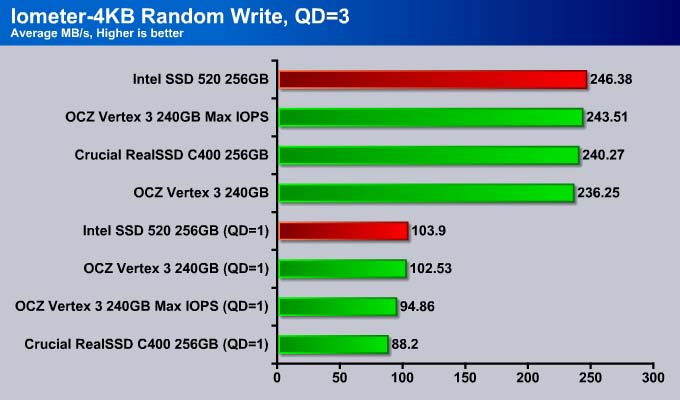
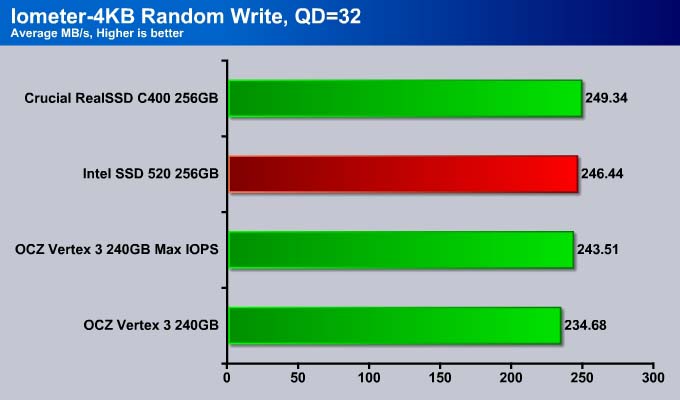
We use Iometer to test an SSD’s read and write performance. For the read test random 4K, data are reading from the drive. For the write test, a random pattern of 4KB data are written to the drive for one minute. We ran single IO, three concurrent, and 32 concurrent IOs. The average MB/s is reported.
Most average desktop workloads are not going to stress the drive over a couple of concurrent IOs but for the enterprise market, the result from 32 concurrent IOs will show us how the drive fares under such stressful conditions. We include both the light workload, queue depth 1 and 3, and the heavy workload, queue depth of 32.
Random Read
Random Read QD=3
Like any other SandForce drive, the Intel SSD 520 is not going to be as fast as the Crucial m4 when comes to random read. However, Intel’s drive shows 20% improvement over the OCZ Vertex 3 drive. It is worth noting here that the OCZ Vertex 3 Max IOPS has a clear edge over the Vertex 3 as the number of concurrent IO increased to 3 where the drive is 25% faster than the Vertex 3 Max IOPS.
| SSD Model | Average I/O Response Time (ms) | Maximum I/O Response Time (ms) | % CPU Utilization |
| OCZ Vertex 3 | 0.2019 | 29.8550 | 6.26 |
| OCZ Vertex 3 Max IOPS | 0.1969 | 1.8517 | 5.91 |
| Intel SSD 520 | 0.1565 | 1.7140 | 7.81 |
queue depth of 3
The SSD 520 has average read response time of 0.1565 ms and maximum response time of 1.7140. It is significantly faster than the Vertex 3 and slightly faster than the Vertex 3 Max IOPS. Clearly, both the Vertex 3 Max IOPS and the SSD 520 are the drive designed for highly concurrent environment. The SSD 520, however, has a slightly higher CPU usage than the Vertex 3 Max IOPS.
At even higher queue depth of 32, the Intel SSD 520 is about 15% faster than the Vertex 3 and just a tad ahead of the Vertex 3 MAX IOPS.
| SSD Model | Average I/O Response Time (ms) | Maximum I/O Response Time (ms) | % CPU Utilization |
| OCZ Vertex 3 | 0.5129 | 66.6352 | 11.99 |
| OCZ Vertex 3 Max IOPS | 0.4506 | 63.0114 | 12.87 |
| Intel SSD 520 | 0.4496 | 7.0321 | 15.34 |
queue depth of 3
At a queue depth of 32, the Intel SSD 520 continues its dominance in the average and maximum response time. Notice here that the Vertex 3 MAX IOPS’s maximum response time is significantly higher than that of the SSD 520, despite the fact average response time is similar. This will make Intel’s drive consistently faster. However, it appears that Intel trades off the performance gain with higher CPU usage.
Random Write
The Random Write for the Intel SSD 520 is slightly improved over the Vertex 3. Note that compared to the Vertex 3 Max IOPS, we get 10% improvement for queue depth of 1. However, at queue depth of 3, the Intel SSD 520 is as fast as the Vertex 3 Max IOPS and 5% faster than the Vertex 3.
| SSD Model | Average I/O Response Time (ms) | Maximum I/O Response Time (ms) | % CPU Utilization |
| OCZ Vertex 3 | 0.0518 | 98.7876 | 16.91 |
| OCZ Vertex 3 Max IOPS | 0.0505 | 96.1822 | 17.41 |
| Intel SSD 520 | 0.0497 | 77.4982 | 13.90 |
When comes to random write, the Intel SSD 520 takes 0.0497 ms on the average to write data and has a maximum response time of 77.4982 ms. Both are lower than the Vertex 3 and Vertex 3 Max IOPS. In addition, the drive also has the lowest CPU utilization.
At 32 queue depth, the SSD 520 still dominates over the Vertex 3 drives.
| SSD Model | Average I/O Response Time (ms) | Maximum I/O Response Time (ms) | % CPU Utilization |
| OCZ Vertex 3 | 0.5583 | 101.8210 | 15.87 |
| OCZ Vertex 3 Max IOPS | 0.5381 | 112.1419 | 11.76 |
| Intel SSD 520 | 0.5316 | 91.4756 | 17.10 |
At higher queue depths, the SSD 520 continues to its lead in the response time. However, the CPU usage is also higher here, just like what we have observed with the read.
iometer: Sequential Read & Write
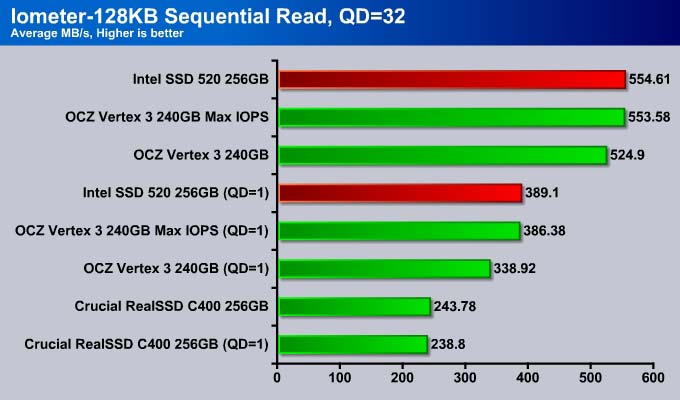
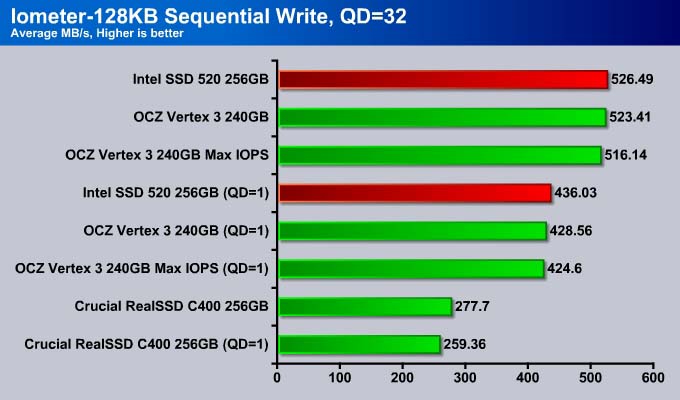
We use Iometer again to measure the drive’s sequential performance by ran a 1 minute 128KB sequential test on the drive at a queue depth of 1 and 32. The average MB/s is reported.
SandForce controllers dominate the sequential read and the Intel SSD 520 is no exception, narrowly edging out the OCZ Vertex 3 Max IOPS.
We see the same result with the sequential write where the Intel SSD 520 is clearly the fastest drive on the market.
So far, the results look promising for the SSD 520.
ATTO
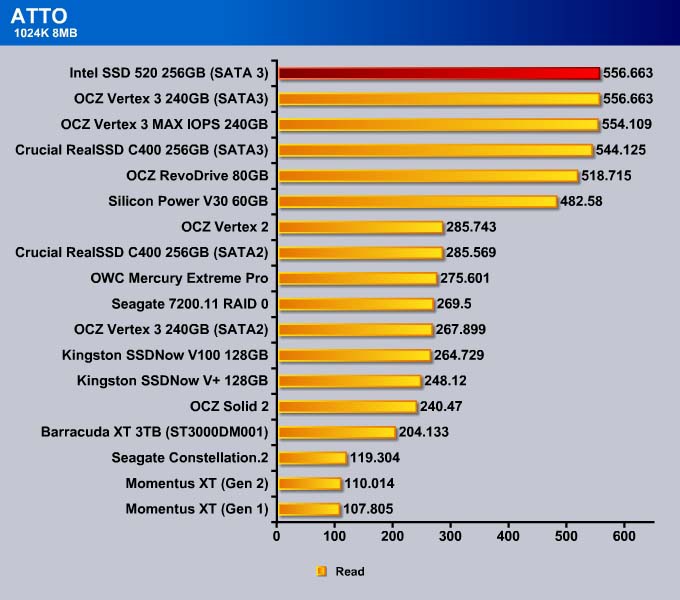
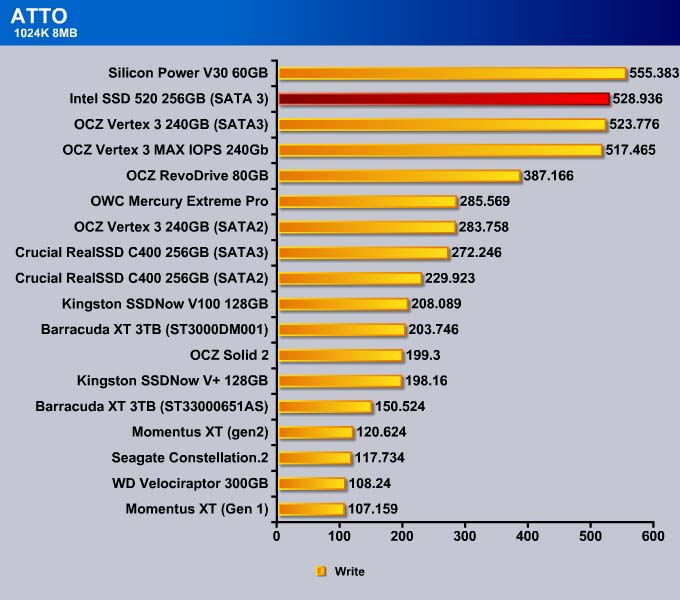
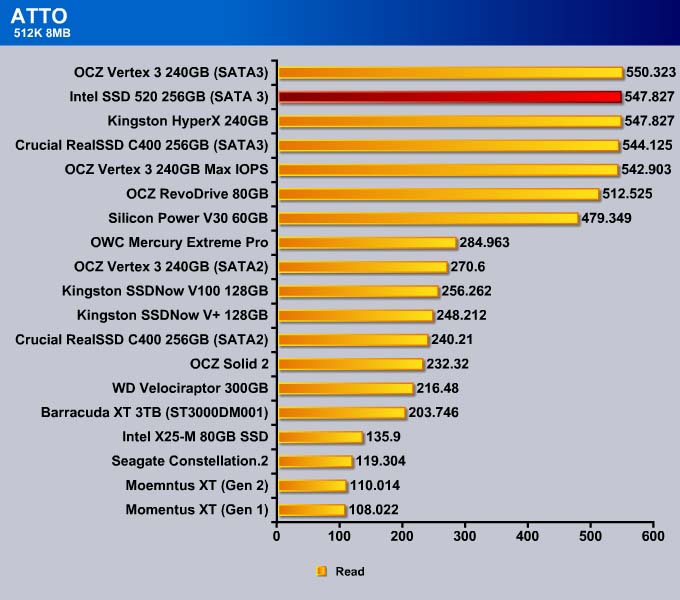
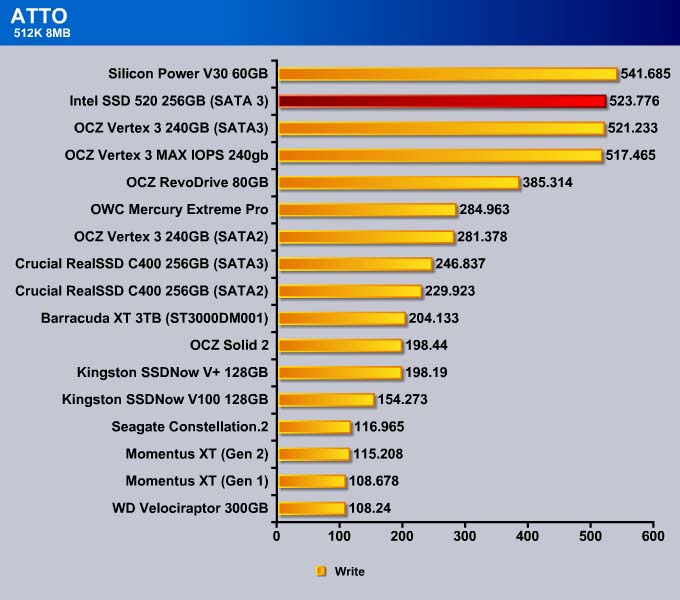
Storage manufacturers often use ATTO to rate their drives. ATTO is designed primarily for mechanical drives, not for SSDs. While it may not always tell the whole story, we include it just to give an idea on how the SSD stacks up against other drives. Also, it is worth re-testing to confirm the veracity of the manufacturer’s claim.
CrystalDisKMark
Designed to test SSD’s, CrystalDiskMark can be configured to utilize completely random data to test the drive’s performance. Iometer, on the other hand, does not use completely random data which often favors SandForce based drives. We configure the CrystalDiskMark to use completely random data of 1000MB test size.
4K
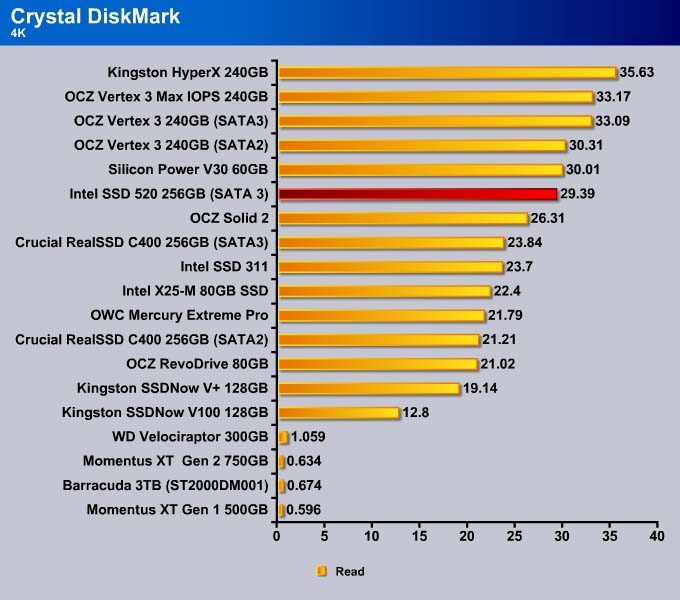
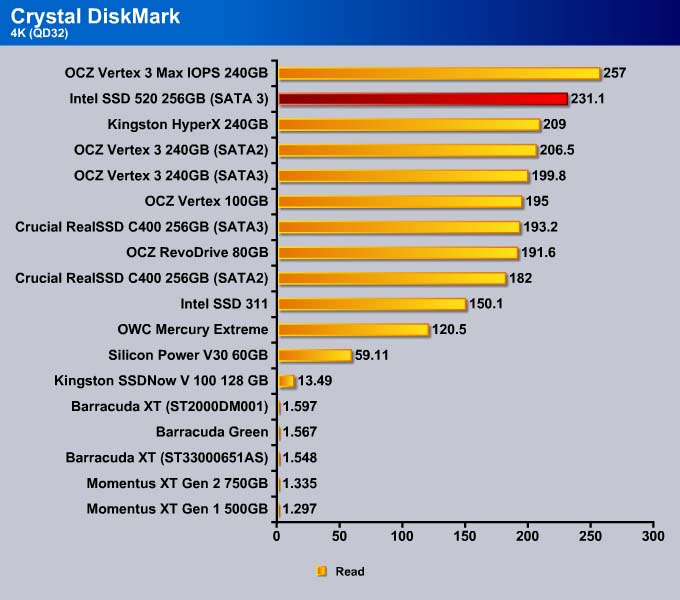
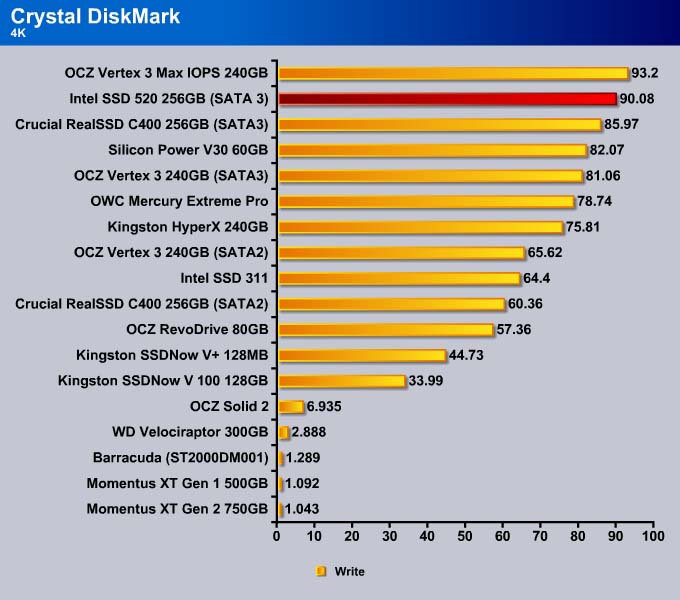
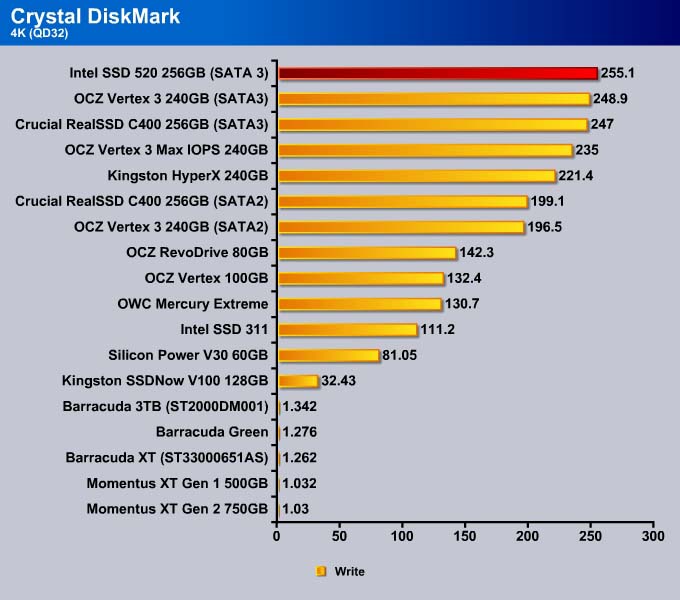
The 4K write for the SSD 520 is better. Only the Vertex 3 MAX IOPS is able to beat the SSD 520. The MAX IOPS uses 34nm NAND for 8-way interleaving while the SSD 520 uses 25nm NAND with 4-way interleaving. So, for random data, the extra NAND die shows a slight benefit in the performance. The SSD 520 is 10% faster than the Vertex 3, though both drives use the same 25nm NAND. Intel was able to improve the firmware to crank out the IOPS on the drive to give it the performance close to that of the 34nm drive.
At a queue depth of 32, the SSD 520 takes the top spot in the 4K write test, beating out the Vertex 3 Max IOPS by 2%.
512K
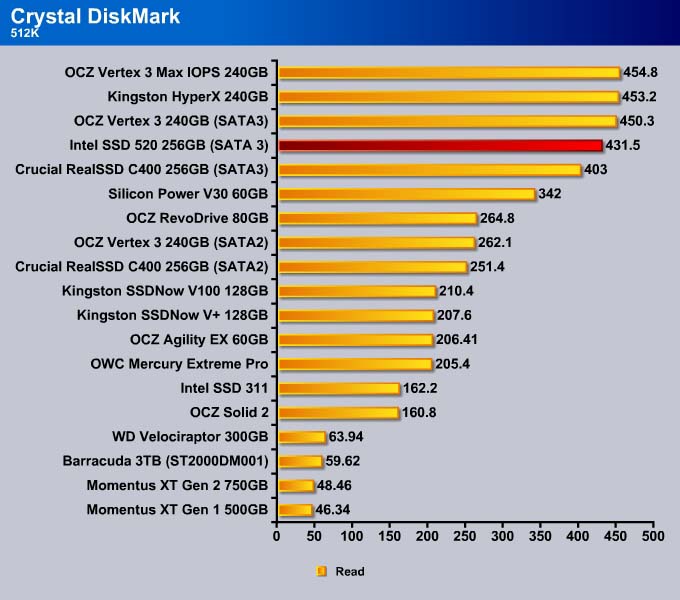
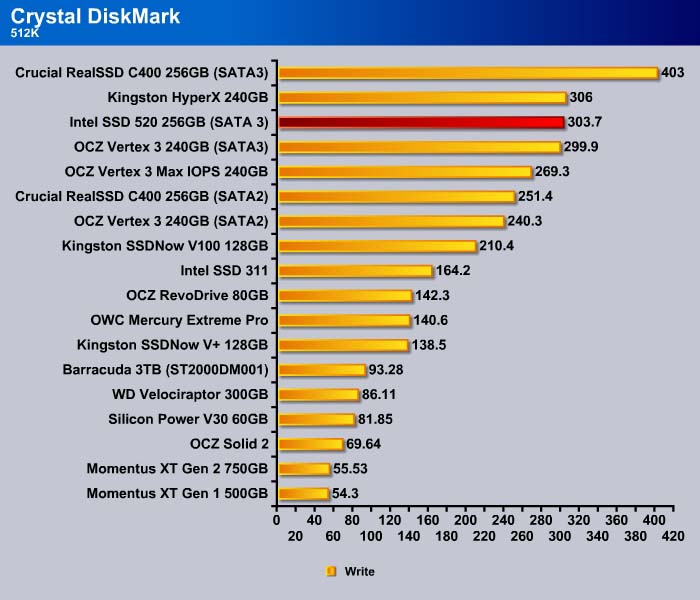
However, 512K write speed for the drive is a tad slower.
Sequential
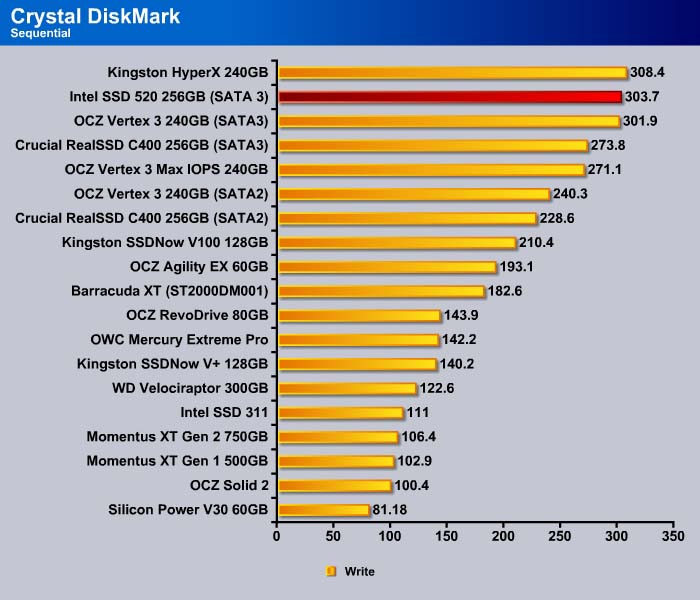
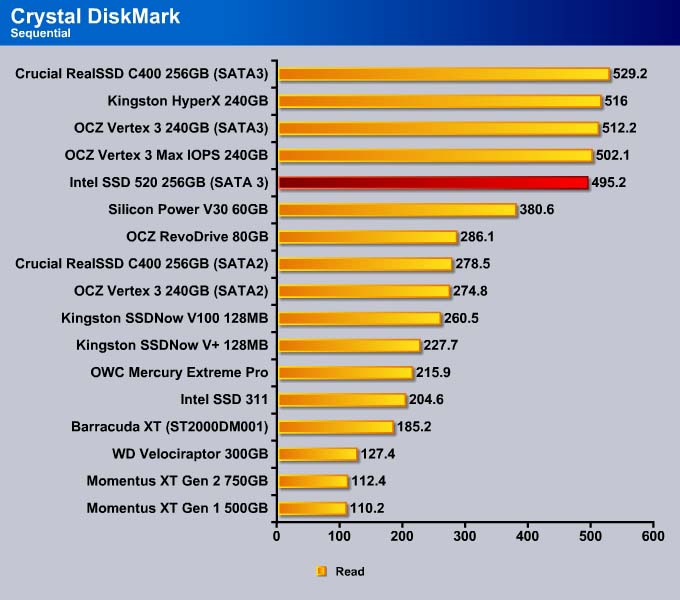
Like what we have seen with the 512K, the sequential read for the MAX IOPS is comparable to other SandForce drives. The Intel SSD 520 is slower in the sequential read but faster in the sequential write.
AS SSD Benchmark
Like the CrystalDiskMark, AS SSD is also designed to test SSDs. We use this tool to measure the drive’s performance at handling incompressible data. Since all SandForce drives compress data to reduce number of write and reduce NAND’s write cycle, SandForce based drives will not going to be the fastest drive here.
4K
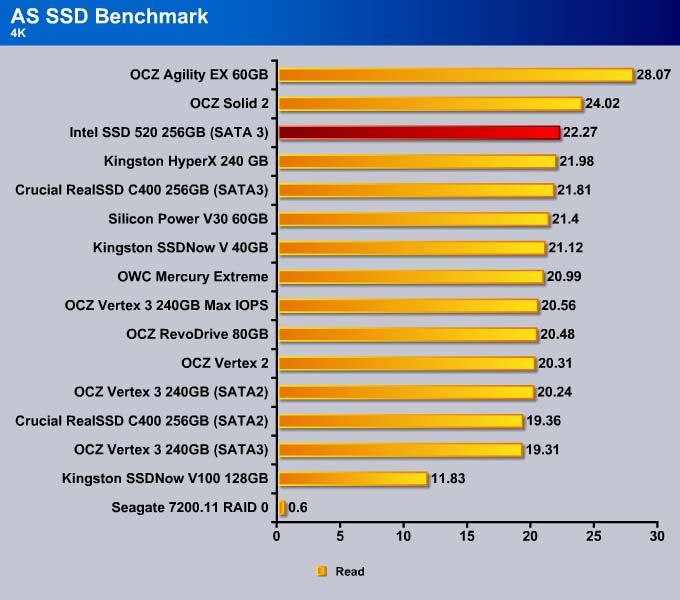
Intel is able to tweak the firmware to squeeze out an extra 0.29MB/s in the read test.
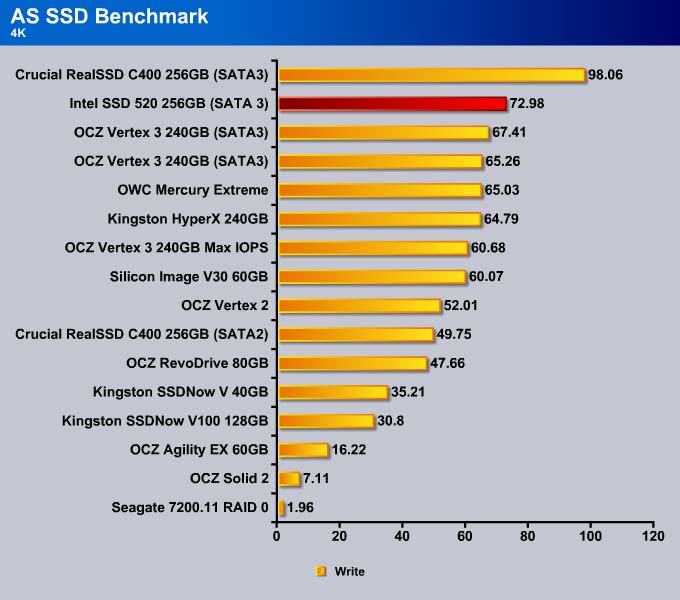
Here we can see the SSD 520 is about 8% faster than the Vertex 3.
4K-64K Thread
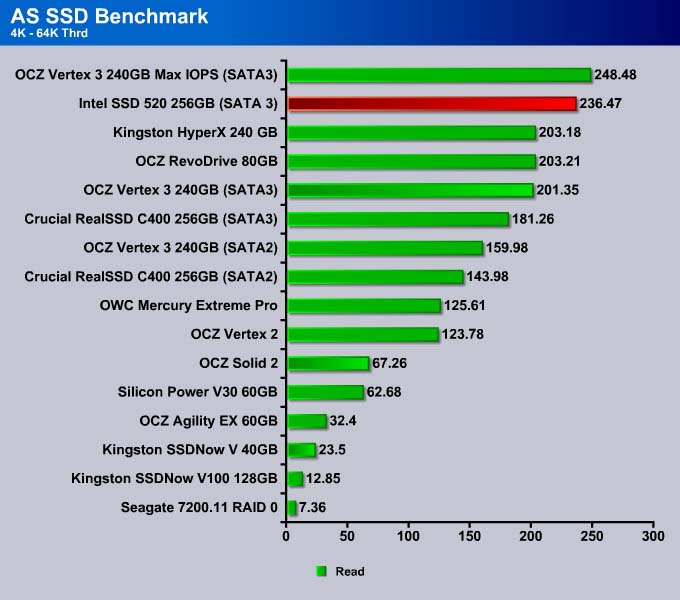
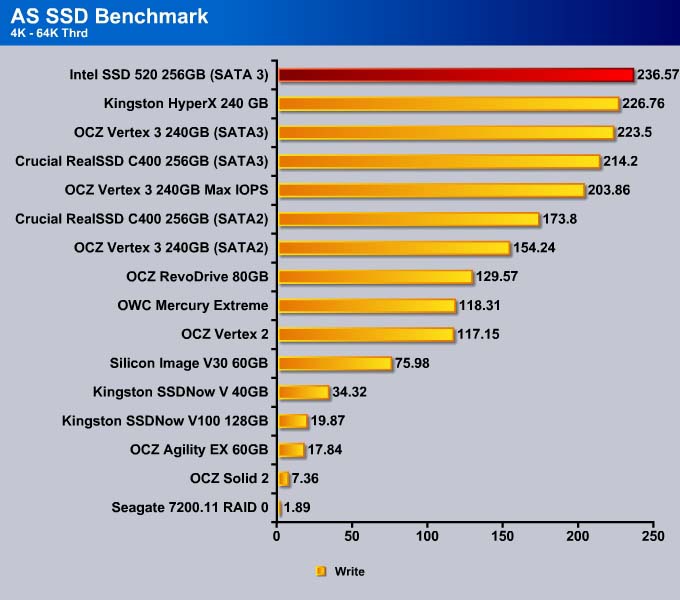
At higher queue depths, the Vertex 3 MAX IOPS actually takes the lead here with the Intel SSD 520 following close by. The interleaving of data in the MAX IOPS leads to a benefit in getting the information from the drive faster.
Sequential
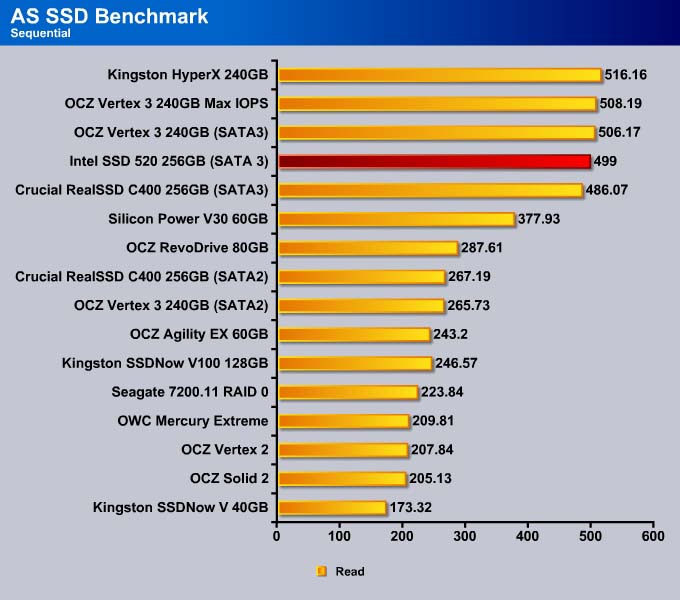
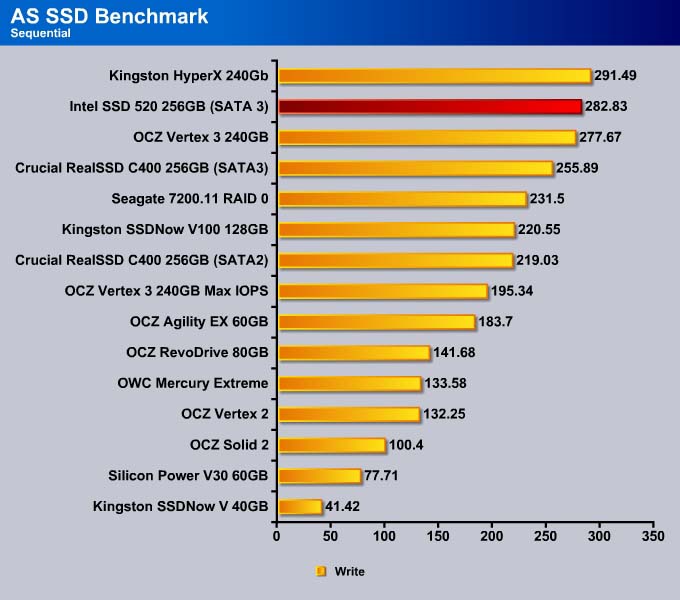
As expected, the SSD 520 performs very similar to other SandForce’s drive since the drive features real-time compression, which will not help when the data is incompressible. The SSD 520 is slowest in the sequential read and second fastest in the write among the SandForce drives.
PC MARK 7
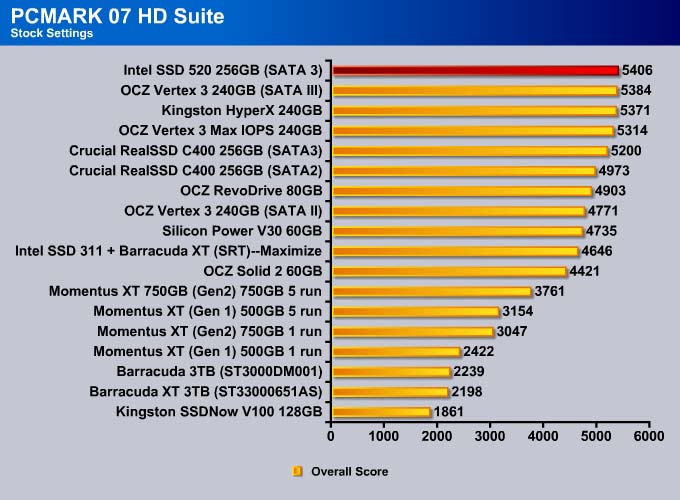
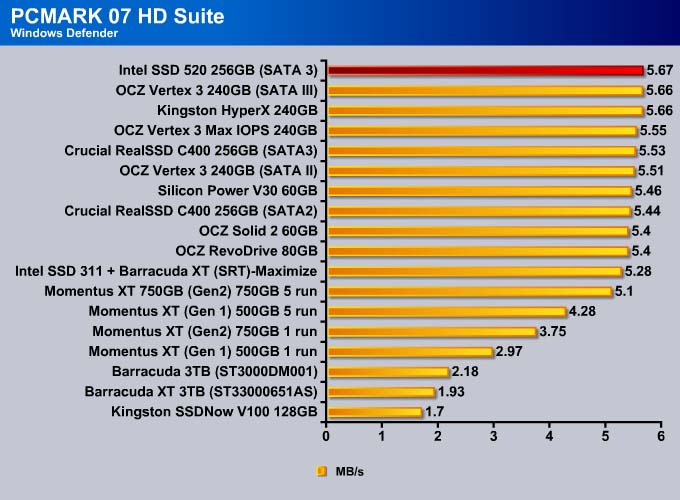
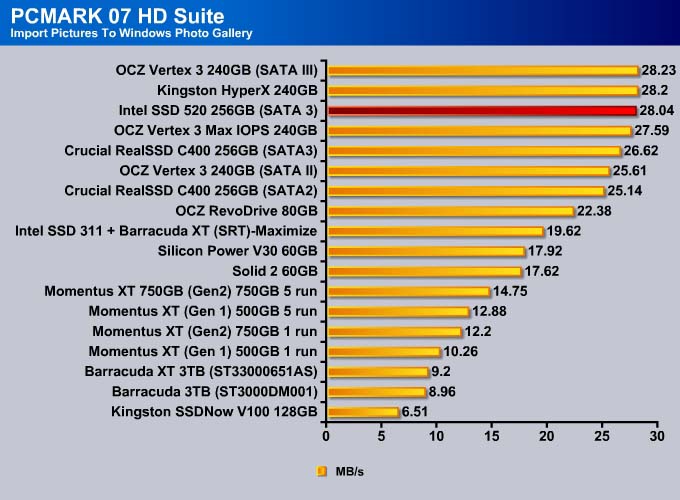
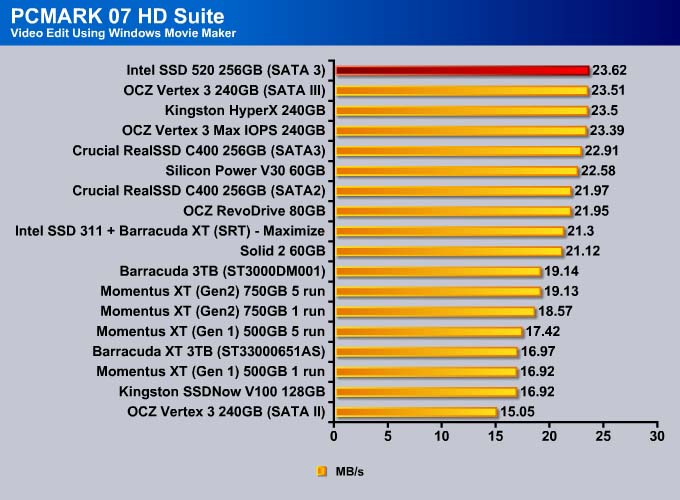
We use PC Mark 7 HD Suite to assess a drive’s performance under commonly used tasks.
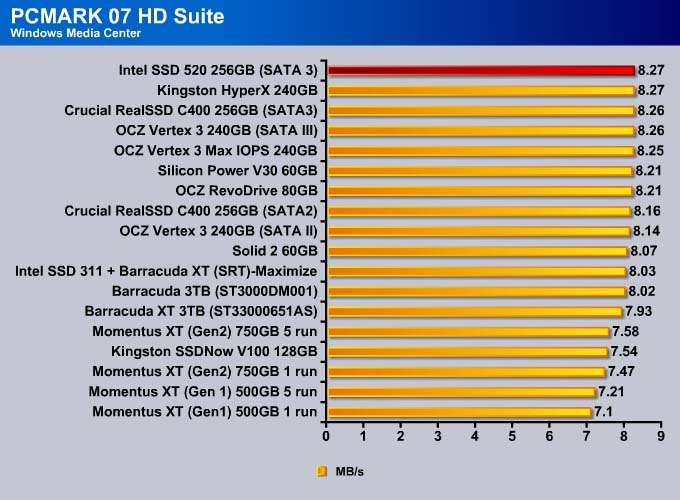
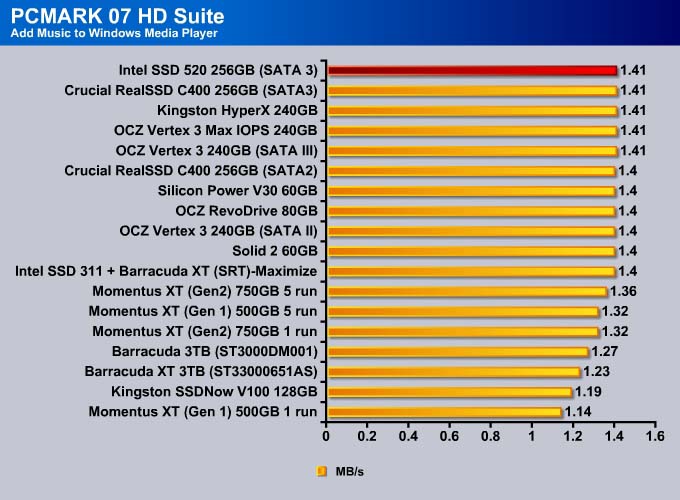
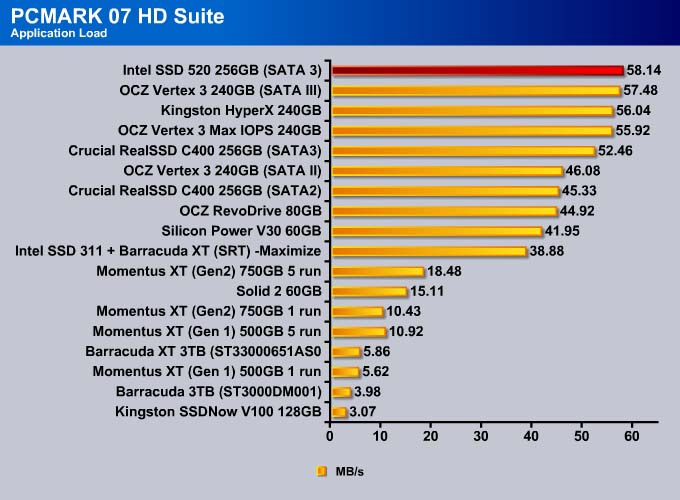
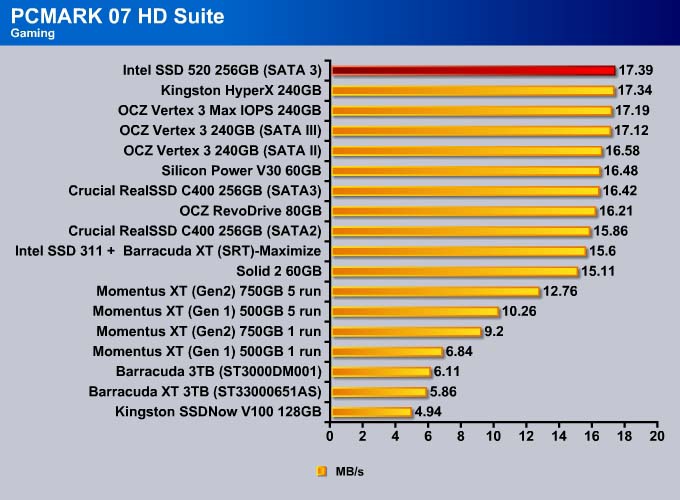
If we use PCMark 07 as our sole performance assessment, we can see the SSD 520 scored 22 more points than the previous leader, OCZ Vertex 3. Comparing it against the other enterprise drive, the OCZ Vertex 3 Max IOPS, the SSD 520 scored 92 more points, which is about 2% faster.
The Intel SSD 520 is no doubt the fastest drive available. The drive takes the top spot in every single test except Importing Pictures (even in that test, it is within 0.2MB/s of the fastest drive).
Conclusion
Intel’s plan in 2012 is to bring the SSD to wide market segments. It is clear with the SSD 520’s wide selection of storage capacity that Intel wants to incorporate every system with an SSD. The Intel SSD 520 is a good start from Intel leading the performance market and we should expect to see updated drives from Intel across the SSD families later this year.
The Intel SSD 520 may have arrived to the party late, but it arrived with a bit of a flare. It is no doubt the fastest drive on the market today. The drive is not only able to hold on its own against the other 25nm SandForce drive (like the Vertex 3 and Kingston HyperX), it is also able to compete against 34nm drives (Vertex 3 Max IOPS) under heavy IO situations.
Looking at the performance of the drive, we can see that the SSD 520 is about 20% faster in random read and 5~10% faster in random write under light IO. At a queue depth of 32, the drive’s performance is marginally faster than the Vertex 3 MAX IOPS. The sequential read and write of the drive is similar to other SandForce drive. The only place where the drive is slower than the Vertex 3 MAX IOPS is the completely random 4K read and write as shown with the CrystalDiskMark.
It is no doubt that the Intel SSD 520 has taken the performance crown once again. However, in the real world, it would be hard to tell the difference between any of the 240GB SandForce drives. The PCMark 07 storage test shows that the Intel drive offers about 2% improvement, which for all intents and purposes, is identical to other drive.
It ultimately comes down to the price. The Intel SSD 520 uses 25nm NAND which means that it uses less die and is cheaper to produce than the 34nm NAND drives like the Vertex 3 MAX IOPS. If the retail price for the Intel SSD 520 is competitive enough to the Vertex 3 and cheaper than the Vertex 3 MAX IOPS, it would make it very difficult to choose the Vertex 3 MAX IOPS given to the similar performance between the two under heavy IO situation.
Ultimately, if you want to have the fastest drive available, the Intel SSD 520 is your choice. Intel does have its branding appeal. Additionally, the Intel SSD 520 comes with two extra years of warranty.
| OUR VERDICT: Intel SSD 520 | ||||||||||||||||||
|
||||||||||||||||||
| Summary: The Intel SSD 520 is the fastest SSD on the market. It shows consistent performance across the board. With a 5-year warranty and a good software bundle, the SSD 520 earns the Bjorn3D Golden Bear Award. |
 Bjorn3D.com Bjorn3d.com – Satisfying Your Daily Tech Cravings Since 1996
