Today we look at the new Patriot PYRO SE SSD, a SandForce powered SATA III SSD aimed at the top-end crowd, where speed is all that matters. Read on to see how it performs.
INTRODUCTION
The recent advancements in technology has been advancing at nothing short of a breakneck pace as of recent. Not too long ago, SSD’s with JMicron controllers experienced stuttering issues amongst the many other growing pains that came with the advent of the solid state drive. Needless to say the SSD race has moved far past those issues in a short time and has now moved into a speed war to see who can get the highest read/write speeds. The PYRO SE looks up to the task by spec to take on the top contenders in the category.
The Patriot PYRO SE is a SATA 6Gbps-compatible model based on the Sandforce SF-2281 controller. This in essence is no big change as Patriot already released the PYRO drive with the same chipset but there are differences that make the SE version worth a look. This model comes in option for capacities starting at 60GB, 120GB and 240GB to top it off. Today we have the 240GB model which means every bit of the controller’s memory channels will be populated and used, likely leading to a small performance gain vs the smaller 120GB and 60GB options.
Present market price for this drive is $469.99 directly from Newegg.
PIctures & Impressions


The Pyro SE is standard 2.5″ SSD. The exterior is a solid metal housing which tells us that it should stand upto some abuse. It is also less susceptible to damage than a hard drive due to the lack of mechanical parts. We’ve voided our warranty by opening the drive, in the interest of showing the insides. We recommend users do not do this.


Here we get a look inside. We can see right off the bat the 16 total (8 front/8 rear) Micron sourced synchronous NAND chips, which are supposed to help push the PYRO SE to its rated 550MB/s Read and 520 MB/s Write. Also, as we look under the hood we see the brain to the PYRO SE: the Sandforce SF-2281 controller.
Here are the specs as listed by Patriot themselves:
Features
- SandForce SF-2200 series SSD processor paired with qualified MLC NAND flash for best performance, value and reliability
- SATA 6Gb/s, 3Gb/s and 1.5Gb/s
- TRIM support (O/S dependent)
- DuraClass™ technology
- DuraWrite™ extends the endurance of SSDs
- Intelligent Block Management and Wear Leveling
- Intelligent Read Disturb Management
- Intelligent “Recycling” for advance free space management (Garbage Collection)
- RAISE™ (Redundant Array of Independent Silicon Elements)
- Intelligent Data Retention optimization
- Best-in-class ECC protection for longest data retention and drive life.
- Power/Performance Balancing
- Thermal Threshold Management
- Native Command Queuing (NCQ) Up to 32 commands
- ECC Recovery: Up to 55 bits correctable per 512-byte sector (BCH)
- Sequential Read & Write Transfer:
60GB model; Up to 550MB/s read | 500MB/s Write
240GB & 120GB models; 550MB/s read | 520MB/s Write - Max Random Write IOPS:
60GB model; Up to 80K
240GB & 120GB models; Up to 85,000 (4K aligned) - O/S Support: Windows® XP / Vista / 7 / Mac® OS / Linux
This tells us that this drive is built for the ground up for speed. With a possibility of up to 85K IOPS this drive should shine in any SATA 6Gbps enabled desktop or notebook. The Garbage collection should help keep the drive clean and running well longer. Now let’s take a look at how it performs in some benchmarks against a variety of contenders.
Testing & Methodology

SSD testing can be a bit subjective as alot of times they are not tested on similar components or at different times. We test our drives as the boot drive with a fresh OS image to ensure all the same drivers updates and OS conditions are observed. Testing with the drive as the boot drive with the os residing on it will result in a much more realistic experience for the end user as just using it as a secondary drive and running benches on an empty drive will likely skew results and deliver different performance than you will see when using it in your system.
Every effort has been made to ensure continuity between benchmarks and comparisons though it does need to be noted that the Kingston HyperX drive appears to have developed an issue as it is a Sandforce drive that should perform very close to the PYRO SE drive yet during testing we noticed abnormally low results even after performing a secure erase in an attempt to see if it just needed freshening up but it did not help and the results were the same no matter how many times we would run the test but for comparisons sake we still included it as the write speeds seemed not affected as badly.
For comparison we have lined up a few drives ranging from a high performing SATA II offering to the PYRO SE. This should give us a good scale of what to expect from your drive should you purchase it and how it compares to others in the now very competitive SSD market.
Test Rig
| Test Rig | |
| Case | Thermaltake Level 10 GT |
| CPU |
Intel Core i7-3960X |
| Motherboard | MSI X79-GD65 (8D) |
| Ram | 16GB Gskill RipJaws Z 4x4GB (9-11-10-27) |
| CPU Cooler |
Swiftech H20-220 Edge |
| SSD |
Patriot PYRO SE 240GB Kingston HyperX 120GB Intel 510 series 120GB Kingston V100 120GB |
| Optical | ASUS BD-ROM |
| GPU |
SLI 2x GTX 580 |
| Case Fans |
Front (intake): 200 x 200 x 20 mm ColorShift Fan x 1 (600~800RPM, 13~15dBA) Rear (exhaust): 140 x 140 x 25 mm Turbo Fan (1000PRM, 16 dBA) Top (exhaust): 200 x 200 x 30 mm ColorShift Fan (600~800RPM, 13~15dBA) Side (intake): 200 x 200 x 30 ColorShift Fan (600~800RPM), 13~15dBA) |
| Additional Cards |
N/A |
| PSU |
Thermaltake Toughpower Grand 1200W |
| Mouse | Thermaltake esports Black gaming mouse |
| Keyboard | Thermaltake Meka G1 mechanical gaming keyboard |
Test Suite
We will use the following applications to test the performance of the SSD. Benchmarks
| Benchmarks |
|---|
| PCMark 7 |
| ATTO |
| Crystaldiskmark |
| AS SSD Benchmark |
PCMark 7

PCMark 7 is the newest benchmark in the Futuremark stable for complete system benchmarking. We did not need the whole suite as we were strictly looking for performance differences in storage so we omitted the normal tests in favor of the storage tests.
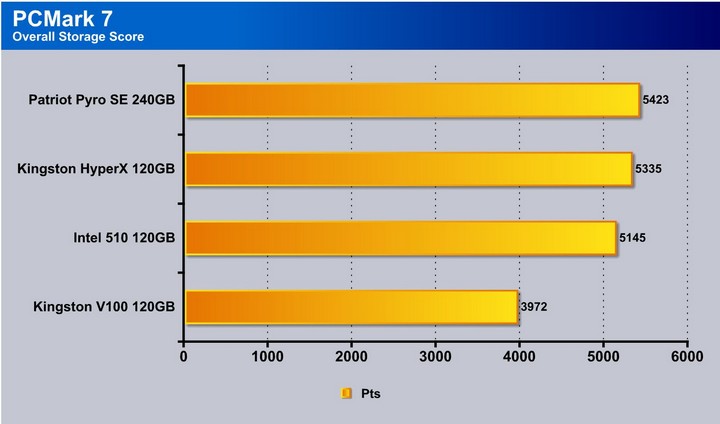
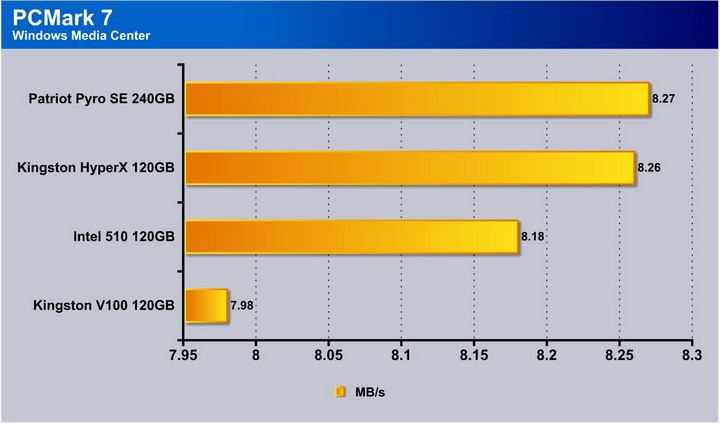
Here is the overall HDD Score which shows that the two SandForce drives are very close to each other, whereas the Marvell powered Intel 510 drive drops a bit behind, and the SATA II powered V100 is even further behind due to the SATA II interface.
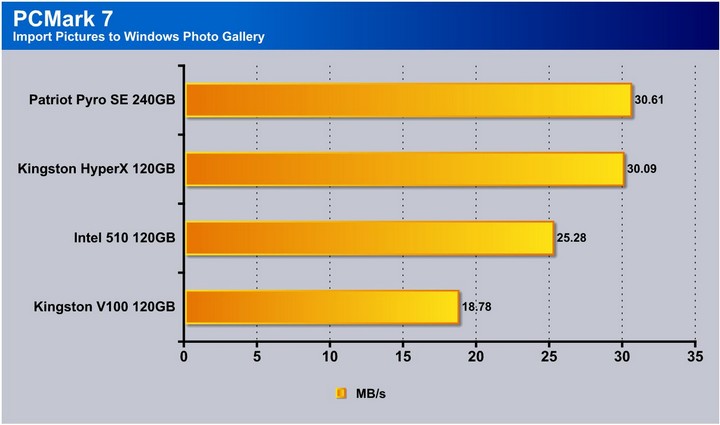
Here on the import pictures test, pictures are varying sizes from quite small to much larger, and the PYRO SE comes out on top and the HyperX is very close behind. The 510 drive is quite a bit behind this time around and the V100 naturally being even further behind that.
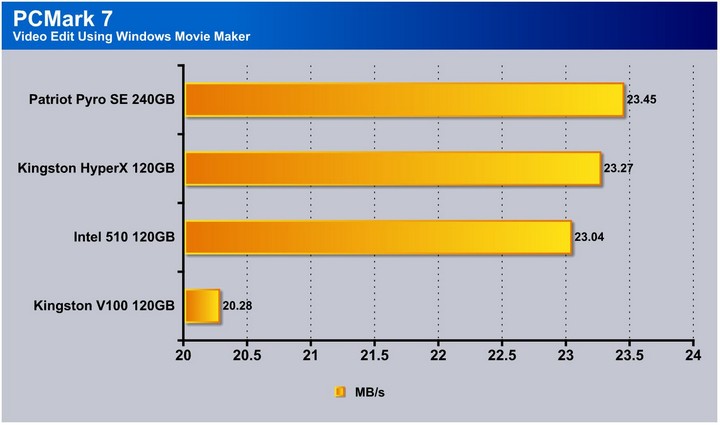
Video Editing usually involves very large files which shows that there is very very little between all of the SATA III models, while even the SATA II models are close but a bit behind the rest.
Here we see the same thing again as the two Sandforce drives are working almost in for speed with the PYRO SE taking the lead by .01 MB/s which is well within margin for error. Here the Intel 510 is once again a bit behind but not by a huge margin, and a little bit ahead of the SATA II drive as well.
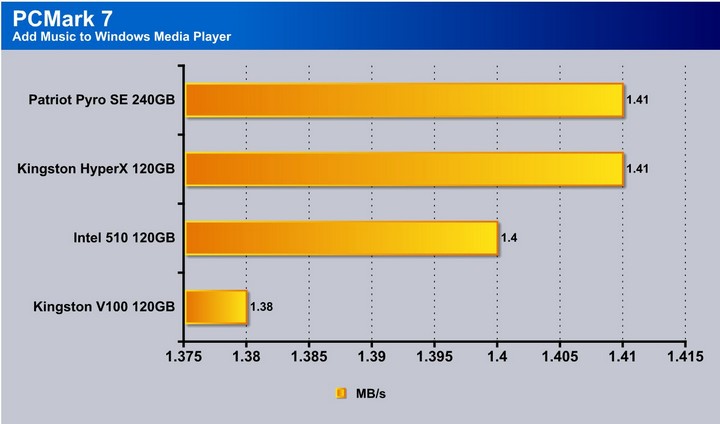
With digital music being so prevalent these days it is only fitting to show a test with adding digital music as it is a good show of real world usage. We see the same trends, though the difference is very narrow.
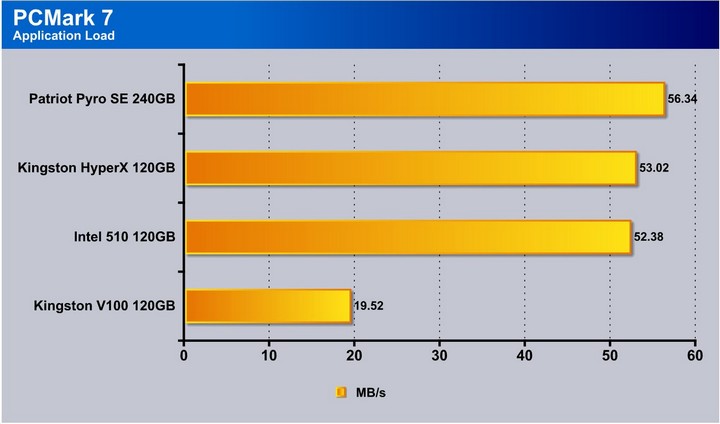
This test involves application loading in the form of MB/s and the PYRO SE takes a pretty commanding lead of over 3MB/s over the HyperX drive which sits back around the Intel drive territory. To no surprise the SATA II drive once again trails behind as the SATA III interface just offers more throughput.
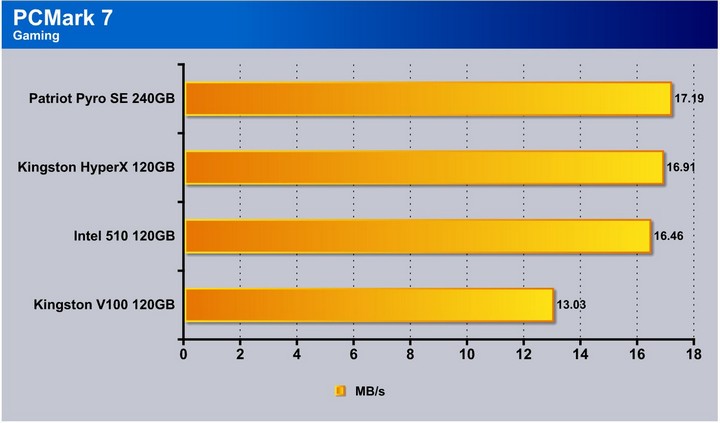
If these SSD’s were employed in a gaming rig they should stack up close to what we see here. The PYRO SE pulls ahead with a slight gain but in real world gaming situations we believe the difference would not be noticeable.
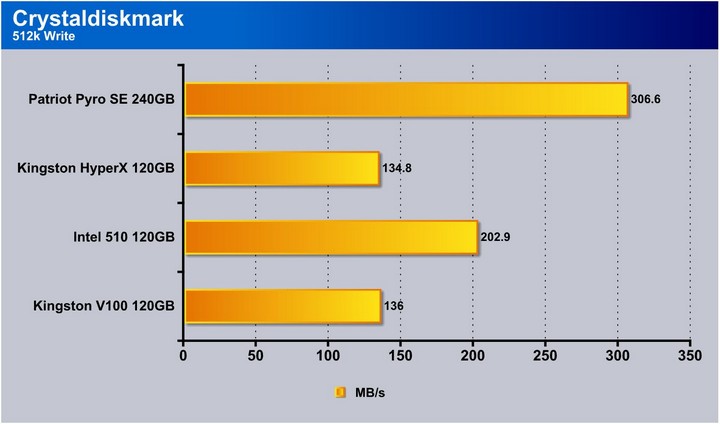
crystaldiskmark benchmark
Crystaldiskmark is a good performance gauge used commonly to check I/O performance for storage drives by testing multiple sizes from 4k and up along with pure sequential speeds as well.

Here we see that the HyperX drive actually tops the PYRO SE, slightly which shows that the SandForce drives being based on the same controller really do perform on par with each other.
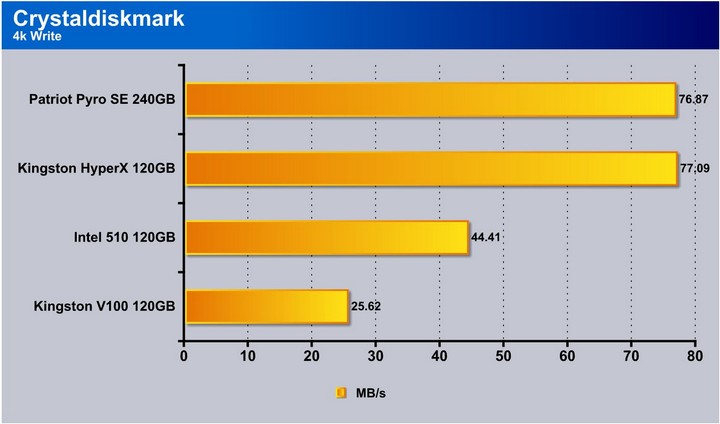
4k writes are the same, the HyperX drive pulls ahead a little which shows that the 4k’s are a strong point for that model. The Intel drive shows a weakness here, with a drop of more than 33MB/s.
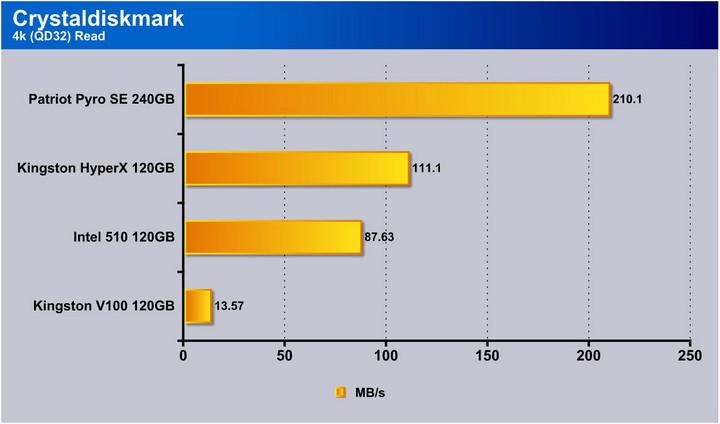
This test shows quite an impressive result for the PYRO SE. However, this result made us question whether there was something wrong with our HyperX drive, as it is also based off the SF-2281 controller, and should not have a performance difference of 100MB/s.
Here we see the same result which is very odd–there is a difference of over 100MB/s between the HyperX and PYRO SE drives. We will secure another HyperX sample to test for defects in that drive.
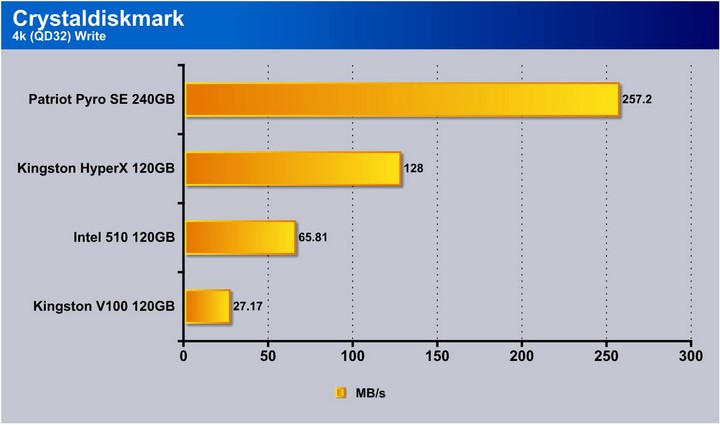
Here, the PYRO SE and HyperX are very close again, a confusing result due to the poor performance in the QD32 tests.
The HyperX drive performance is below all of the other drives, even the SATA II offering. The PYRO SE is leaps and bounds ahead of the Intel 510 drive as well and exhibits excellent performance.
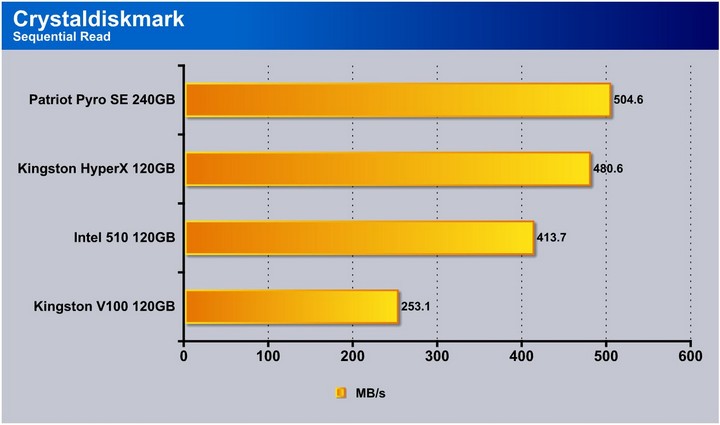
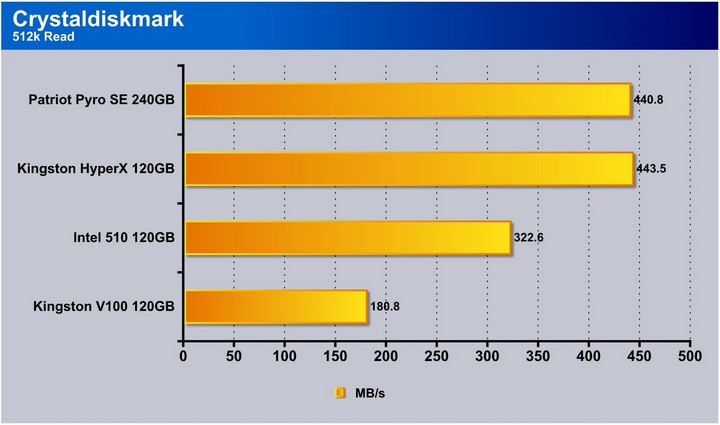
Here in the sequential read test we see the PYRO SE is about 20MB/s above the HyperX drive which tells us that the PYRO SE likely has a few tweaks up its sleeve, including the synchronous NAND helping it give the extra edge in performance.
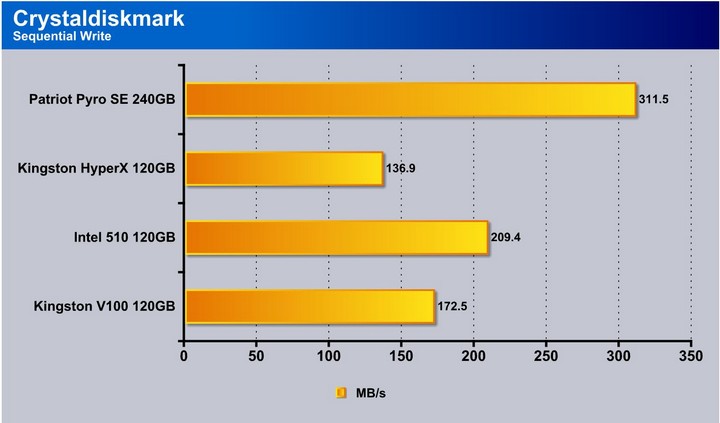
Here we have another good result for the PYRO SE while the HyperX drive shows some issues keeping up at all.
AS ssd benchmark
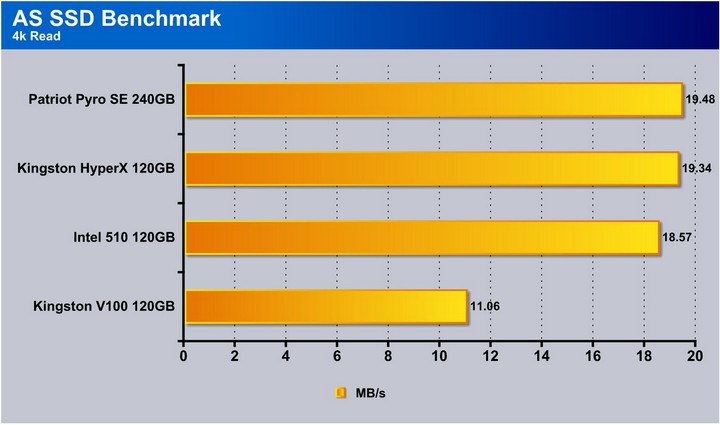
Here in the AS SSD benchmark we see that the PYRO SE pulls a very small gain in the 4k read performance.
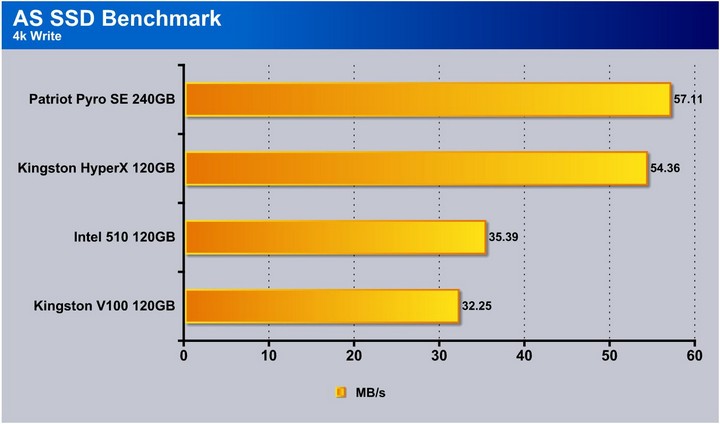
In the 4k write, we see the PYRO SE pulls a bit more of a lead over the HyperX drive and even more over the Intel 510 and SATA II drives.
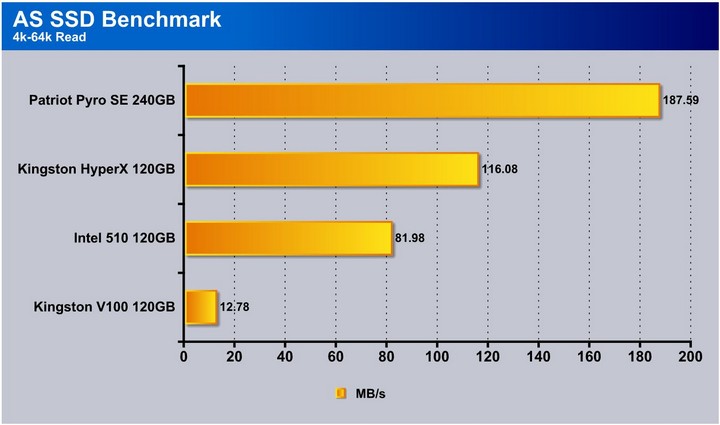
Here we see that the PYRO SE takes a commanding lead in the 4k-64k read category, though the HyperX drive is not experiencing the horrible performance we saw before.
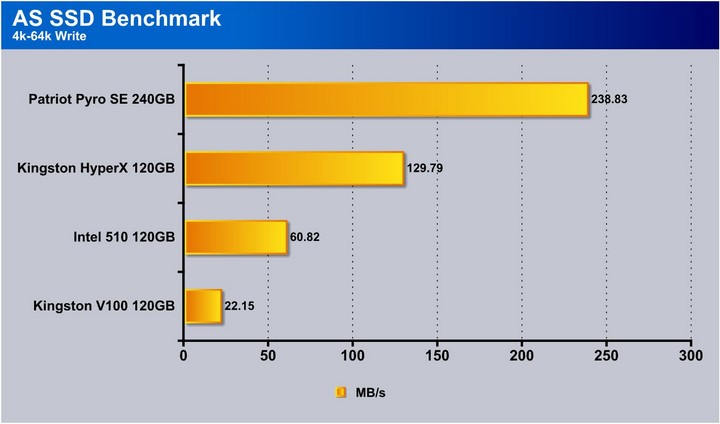
Here we see a similar occurrence where the PYRO SE pulls a large lead over the comparing drives.
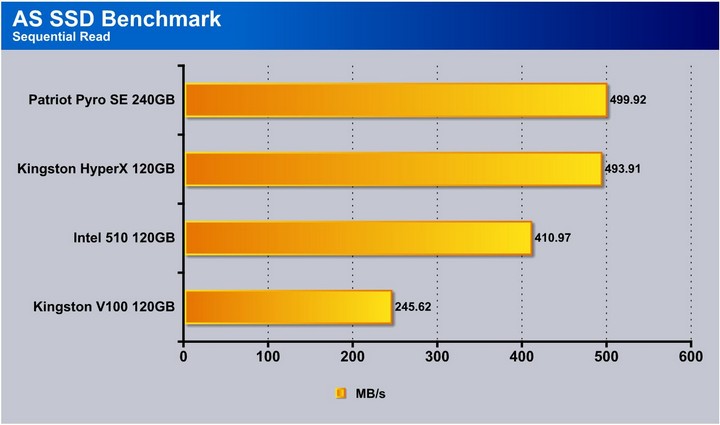
Sequential read tests shows the PYRO SE only a few MB/s ahead of the HyperX drive again which matches our previous testing.
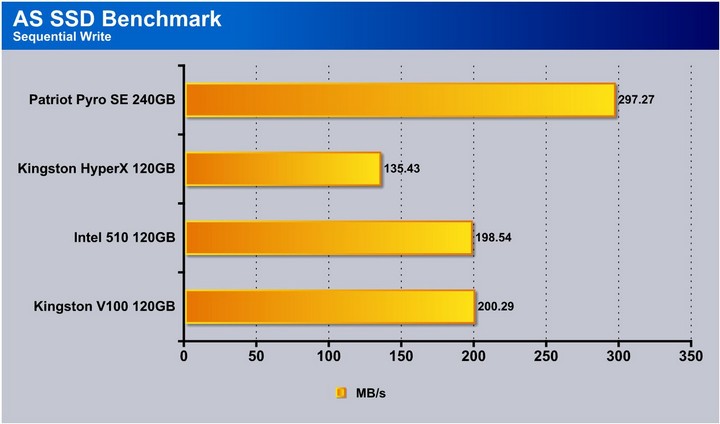
Here in the sequential write tests we see the PYRO SE pulls some good numbers, while the HyperX drive drops dramatically low.
atto drive benchmark
The ATTO Benchmark will show the raw numbers and for this we ran the drives in a secondary state with a 600GB Velociraptor as the boot drive so that the drives could be tested with the full available capacity.
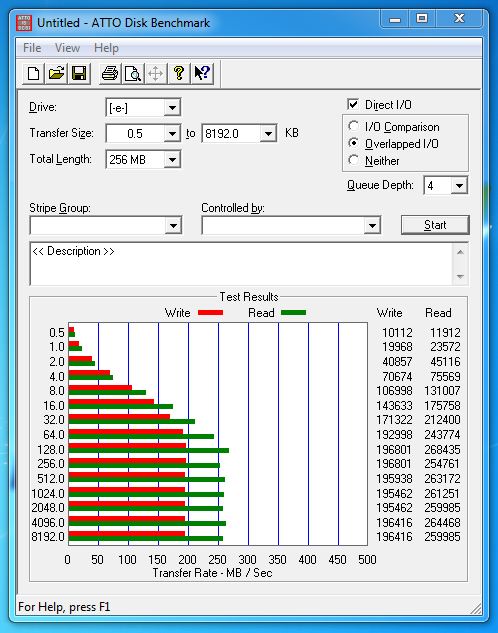
Pyro SE 240GB
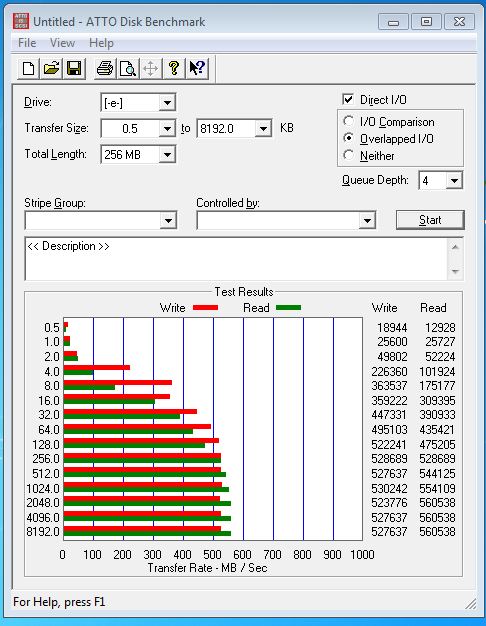
Here we see that the PYRO SE not only meets, but exceeds the spec of 550/520 (read/write) with a result of 560/530. This is very good and should provide more than enough bandwidth for any task users throw at it.
HyperX 120GB
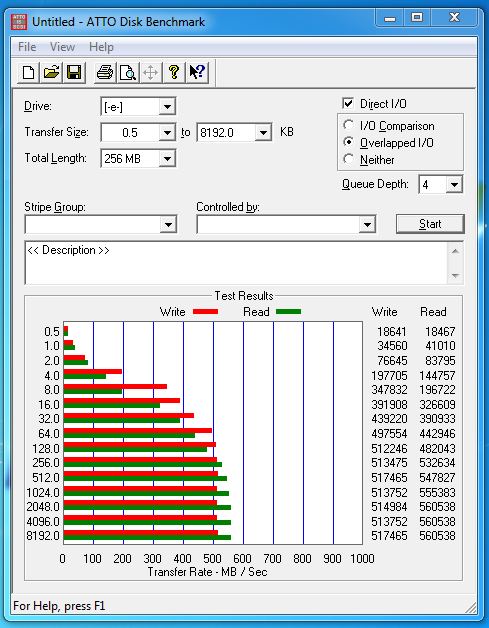
The HyperX drive is an SF-2281 SSD, and shows a result of 560/517 which is not far behind the PYRO SE.
Intel 510 120GB
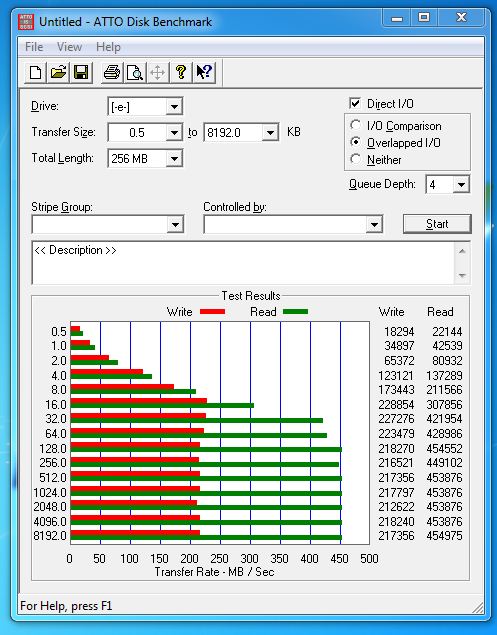
The Intel 510 drive shows its capabilities with a peak of 454/228, which we believe is limited by the Marvell controller it is equipped with.
V100 120GB
The V100 drive seems to have completely saturated the bandwidth for SATA II, as it maxes out at 264/196 which for a SATA II drive is quite good.
CONCLUSION
The Patriot PYRO SE SSD is a great performer with awesome potential for pretty much any app we put in front of it. While it is slightly faster the real world performance increase will likely not be noticed in real world apps compared to other SSD’s in the category. One thing to note is that one of the key advantages of an SSD is the very short seek time, which is why programs can start almost instantly, since it does not have to search a spinning platter for the data. One thing to note is that as SSD’s are used performance can be lost which is why features on this drive such as TRIM and Garbage collection all add up to a much better user experience and better retention of drive performance as well.
As for the price the PYRO SE does come in at a premium above some drives on the market which have very similar performance. Patriot offers a 3 year warranty on this drive which is about standard for the market so nothing lacking there. There are some performance improvements over other models in the category but those are slim and it makes the higher price tag a tough pill to swallow. If Patriot had found a way to make a slightly more competitive price point, this could be an instant sell, but if you are seeking the fastest on the market or bleeding edge performance on a 2.5″ SSD then the price premium is likely not going to be an issue and the PYRO SE will be a lot of fun.
| OUR VERDICT: Patriot PYRO SE 240GB SSD | ||||||||||||||||||
|
||||||||||||||||||
| Summary: The Patriot PYRO SE SSD has excellent performance. Though it is very expensive, for its outstanding performance, it earns the Bjorn3D Silver Bear Award. |