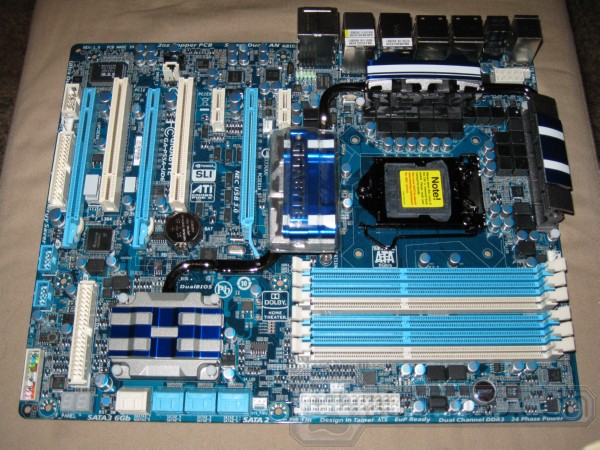
We have the Gigabyte GA-P55A-UD6 on the test bench rocking a Sata 3 Seagate Barracuda XT drive and a Buffalo USB 3.0 1TB drive enclosure.
INTRODUCTION
Gigabyte has gone P55 platform wide with USB 3.0 and SATA 3. Almost every board they offer with the LGA 1156 socket has a version available with SATA 3 and USB 3.0 built in. While SATA 3 and USB 3.0 isn’t designed into the P55 chipset Gigabyte has found a solution to include it in this generations boards that will help mainstream SATA 3 and USB 3.0 faster.
We chose the longer harder road with the Gigabyte GA-P55A-UD6 and waited for a USB 3.0 device to test out on it. We not only have a USB 3.0 External drive to test we have the new Seagate Barracuda XT. It takes a while to test a motherboard by itself but when you add a new SATA 3 interface and drive, and a USB 3.0 drive and interface it gets crazy.
In order to control that craziness we reviewed the Barracuda XT on the GA-P55A-UD6 and our results for the HD section of this review will be pulled from there. Then we ran the Buffalo Drivestation USB 3.0 1TB drive on the P55A-UD6 and the results we post for USB 3.0 here will be used in the Buffalo Drivestation review later.
We told you it was crazy, we didn’t expect (nor get) fantastic speeds from the Barracuda XT hard drive and that’s in no part fault of the Gigabyte GA-P55A-UD6, platter drives can’t saturate the bandwidth that SATA 3 offers and that’s a limitation of hard drives and not the interface. USB 3.0 on the other hand is sweet. Extremely sweet. Previous speeds on USB 2.0 drive enclosures ran in the 25MB/s range just like Flash based USB 2.0 drives. That’s not the case with USB 3.0. USB 2.0 is limited to 480Mb/s which is the theoretical upper speed limit of USB 2.0, theoretical being the keyword. In reality no USB 2.0 interface has ever reached 480Mb/s and the real life speed is much closer to 320Mb/s. The theoretical limit on USB 3.0 is 4.8Gb/s, we don’t expect that USB 3.0 will ever hit the theoretical speed limit of 4.8Gb/s but even half of the theoretical 4.8Gb/s is about 10x the speed of USB 3.0.
A few of you are probably thinking wait a minute this is a motherboard review isn’t it. Yes it is a motherboard review, but we’ve reviewed the GA-P55-UD6 and this is a GA-P55A-UD6 and the big news here is SATA 3 and USB 3.0. We will do a full review on the P55A-UD6 in this review but the big news remains SATA 3 and USB 3.0.
Here’s the crux of the problem, until you know what SATA 3 and USB 3.0 are capable of and the changes in board design you really can’t evaluate the interfaces or speeds. So to that end we toss in a little SATA 3 and USB 3.0 information. There will be plenty of info on the GA-P55A-UD6 along the way. Had you worried there didn’t we?
Now that we are on the track of USB 3.0 lets talk a little about what the interface offers.
- Higher transfer rates (up to 4.8 Gbps)
- Increased maximum bus power and increased device current draw to better accommodate power-hungry devices
- New power management features
- Full-duplex data transfers and support for new transfer types
- New connectors and cables for higher speed data transfer…although they are backwards compatible with USB 2.0 devices and computers
We’ll get a little more in depth later but the quick and dirty of it is that USB 3.0 to most people means more speed. Increased speed means increased voltage the international standard for USB 2.0 is 500Ma and the USB 3.0 standard is 900mA, however Gigabyte doesn’t adhere to that standard GIgabyte exceeds that standard. Gigabyte boards feature 3x USB Power Boost. They provide up to 2700mA hence the 3x power Boost monicker. This voltage standard is for configured devices. Unconfigured devices or devices in standby get 150mA which is up from the 100mA provided by USB 2.0.
How does USB 3.0 achieve the faster speeds? There are a number of technological changes but the most obvious is a new data bus added in paralell to the USB 2.0 bus. What does that geek speak mean, USB 2.0 has 4 wires, (power, ground, and a pair for differential data), USB 3.0 adds 4 more for two pairs of differential signals (receive and transmit) for a combined total of 8 connections in the connectors and cabling.
Why do we need more wires? The two extra pairs of wires were needed to reach USB 3.0 speeds. What do we mean by that? While the USB 3.0 communications is still host directed by design it’s now asynchronous instead of polling. USB 3.0 uses a bi-directional data interface rather than USB 2.0’s half-duplex setup. Data is sent both ways instead of one direction at a time.
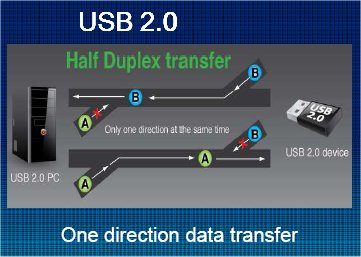
In USB 2.0 communications data travels in both directions but only one direction at a time.
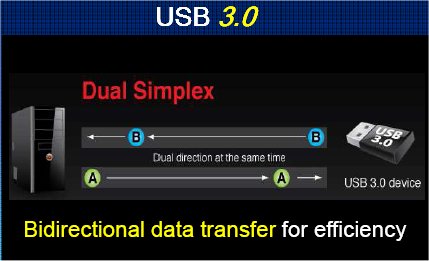
USB 3.0 breaks that limitation by communicating both directions at the same time. So we see faster speeds, more available bus power, and it’s a Universal interface we can expect, over time to trickle down to household devices like USB 2.0 did. What hasn’t changed. Maximum transfer distance (to maintain multi giga-bit transfer speeds) for single cable without hubs to boost the signal about 3 meters. That isn’t spelled out in the USB 3.0 specifications but it’s a reality. Of course you may be able to extend that distance with USB 3.0 hubs when they become available.
Specifications
|
||||||||||||||||||||||||||||||||||||||||
|
Pretty much the same board as the GA-P55-UD6 with a couple of noteworthy exceptions. One of the exceptions is theMarvell 9128 chip which provides 2 x SATA 6Gb/s connectors (GSATA3_6, GSATA3_7) supporting up to 2 SATA 6Gb/s devices and support for SATA RAID 0.
The other noteworthy exception is the NEC chip which supports 2 USB 3.0 (or backwards compatible with USB 2.0) devices.
Ah Sata 3 I feel another page coming on.
The Interface Design & Decision
It’s always fun when you get a new critter in your hand and have to figure out the best way to provide palatable information about it with testing. More fun than one human should have.
We are using the Seagate Barracuda XT SATA 3 drive on the Gigabyte board to test the new SATA 3 interface with and there are a few things specific to the entire line of Giga P55A boards relating to the SATA 3 controller setup. In BIOS you will find a SATA 3 setting with a Turbo designation. This Setting allows the SATA 3 controller to run at SATA 3 speed or 6Gb/s (600MB/s) but if you use SATA 3 Turbo it disables the use of SLI and Crossfire on the P55A lineup. If you disable SATA 3 Turbo then it’s still a SATA 3 interface but limited to 3Gb/s (300MB/s) but you can use multi-GPU setups. Using SATA 3 Turbo will not only limit you to one GPU but it will also cut the bandwidth on the first PCI-E slot, the one you put your video card in, to 8x speed. So you give up SLI/Crossfire and the first slot is limited to 8x speed if you use SATA 3 Turbo, or USB 3.0 Turbo. Here’s the response we got from Gigabyte on the Interface limitations.
According to Colin and engineer team, that is the limitation of the P55 chipset, no native SATA3 support and PCIe 2.0 limited to 1×16 or 2×8. Due to PCI-e Gen 1 bandwidth limitation, we need to use a PCI-e Gen 2 bandwidth (since SATA3 transfer is 6Gb/s (600MB/s), PCIe Gen 1 x1 lane from the P55 has a limitation, as it’s only able to offer 2.5Gb/s (300MB/s), therefore, we need to get a Gen 2 lane, which offers 5Gb/s (600MB/s). As we don’t see much of a performance difference of x16 graphics vs x8 graphics, we use that lane for SATA3 and USB 3.0.
Keep in mind, users are able to turn on and off Turbo SATA and Turbo USB, so if they want to use the full x16, graphics they can, however, it will switch x1 Gen1 lane off the P55, which will limit to 2.5Gb/s. We feel this is a fair trade off, as it means we are able to give users the option to use SATA 3 and USB 3.0 on our entire lineup of P55 motherboards, unlike our competitor who only has support for their very highest end P55.
We like that Gigabyte has incorporated the entire P55 lineup with SATA 3 and USB 3.0 and we know that this is a limitation of the P55 chipset. There are only so many PCI-E lanes available and they have to get the bandwidth from somewhere. Most end users use a single GPU and 8x bandwidth isn’t going to affect performance on single card setups. Since Gigabyte opened the door by responding about the competitors high end boards we felt compelled to contact Asus and this is the response we got from them.
The allocation of the PCI-E lanes comes from the PCH we unified the 1.1 lanes and then supply them to the PLX bridge this in return provides us with our PCI-E 2.0 x 1 Lane which provides 500MB of throughput eliminating any bottleneck. I believe I had previously supplied a breakdown of this information in a previous email I will resend it will all other applicable information. I hope this provides a clearer breakdown of the implementation. Additionally we are currently working with Marvell to have a newer driver supplied to enhance performance for current generation drives ( as most optimization has been done for their SSD prototype controller as well as large file transfers.
Additionally the reason why we did 4 is to ensure sufficient bandwidth for our – E premium refresh models because they need bandwidth for both SATA6G and USB3.0. So to clarify as noted below.
1 PCI-E 1.1 lane provides 250MB 4 equaling 1000MB
We have taken 4 and provided to PLX Bridge.
This way we can provide 500 to USB and 500 to SATA6G.
It is not a perfect implementation but practical efficient and does not limit the throughput need to benefit from the drives connected to those buses.
Yes, as the PLX 8613 controller provides up to 4 PCIex1 2.0 lanes output, we can connect up to 4 devices behind it.
As each PCIex1 2.0 lane takes 5Gb/s bandwidth, and we feed it with 4 lanes of PCIex1 1.1 for it to use, which sums up to 10Gb/s bandwidth, by having only two devices connecting to that controller ensures the full bandwidth without compensation.
We realize that this is a Motherboard review but the hard drive is a SATA 3 interface and currently there are two implementations of the SATA 3 interface out there and you need to know the difference. Especially if, like most of the Bjorn3D staff, you are a multiple GPU user.
The Gigabyte implementation is platform wide and if you are a single GPU user there’s nothing wrong with it given the chipset limitation. If you are a multi-GPU user then Asus probably has the more elegant solution for you. Gigabyte takes the bandwidth it needs from the PCI-E Gen 2 lanes and leaves you with 1 GPU running on an 8X bandwidth slot, Asus, which is offering SATA 3 and USB 3 on it’s premium boards has taken the bandwidth from the PCH (Platform Controller Hub) and unified the PCI-E lanes with a PLX 8613 bridge chip. So the Asus solution is limited to higher end boards and probably more suitable to multi-GPU end users.
However the Asus implementation will not run as fast as the Gigabyte solution for hard drive speed. It’s a little complicated to go into detail over but it has to do with the distance the data has to travel. Gigabyte solution is a shorter data path and just operates marginally faster.
All that being said we are testing on the Gigabyte P55A-UD6 today and have no desire to start an Asus/Gigabyte multi-board comparison of the Gigabyte/Asus SATA 3 implementations. Most of the end users use a single GPU and either solution is suitable for that. Multi-GPU users by the time they migrate away from their current boards this probably won’t even be a decision you have to make. If your on X58 it’s a totally different arrangement. This arrangement is merely to overcome the P55 chipset limitation which didn’t include or plan for SATA 3.
GIGABYTE SPECIAL FEATURES
With all the features packed on some boards, the only way to cover them is to do a special features section by itself. This is one of those feature packed boards.
By far the most interesting overclocking feature on this motherboard is the true 24 phase power. This is the world’s first true 24 phase power board. Then things are made more interesting by the 333 design philosophy. The 333 logo stands for USB 3.0, 3x USB power, and SATA 3. In total 4 industry leading solutions on one single board, that’s an extremely rare thing.
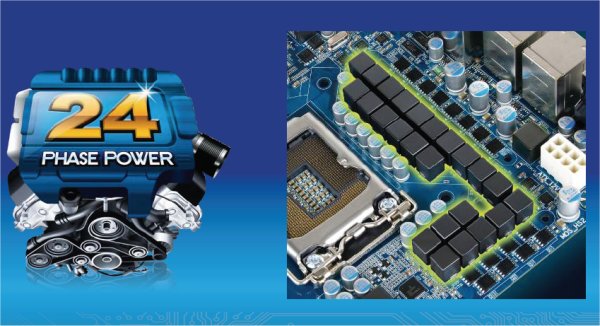
Clustered around the CPU you can see the 24 Ferrite chokes that make the 24 Phase Power possible. Spreading the CPU voltage across 24 phases will result in cleaner power delivered to the CPU, VRM’s (Voltage Regulation Modules) and as a result the Ferrite Chokes will run cooler. Cooler operation means longer life.
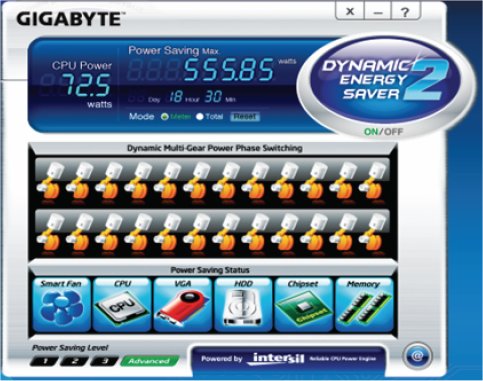
Now that you know about the 24 Phase power, you can make sure that your electric bill doesn’t hit the roof. Gigabyte has you covered with Dynamic Energy Saver 2.
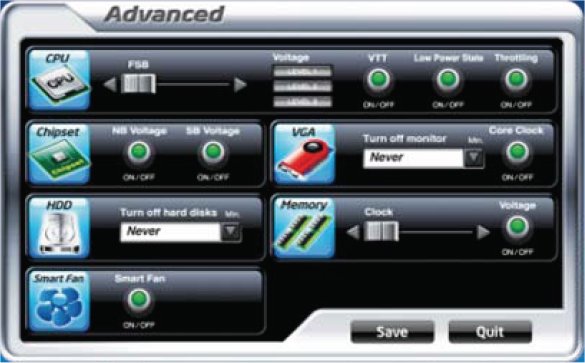
In the Advanced screen of Dynamic Energy Saver 2, you can control CPU, Chipset, hard drive, fan, GPU and memory voltage regulation to set for low power states or leave the board running full out.
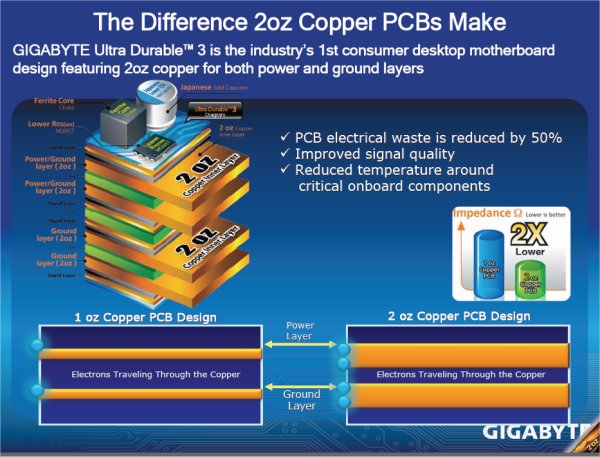
Gigabyte is serious about their 2oz Copper PCB design. Both the ground and power layer contain 2oz of copper.
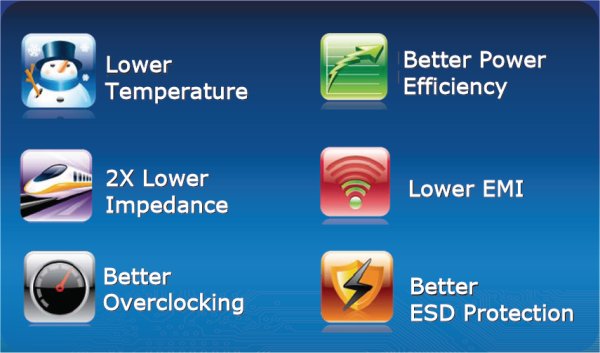
The 2oz Copper PCB on both power and ground layers will result in lower temperatures, half the impedance, better overclocking, better power efficiency, lower EMI (Electromagnetic Interference) and better ESD (Electrostatic Discharge) protection.
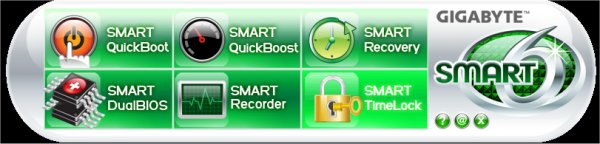
Smart 6 is a collection of software utilities that allow you to control 6 different features from a GUI (Graphical User Interface) inside Windows.
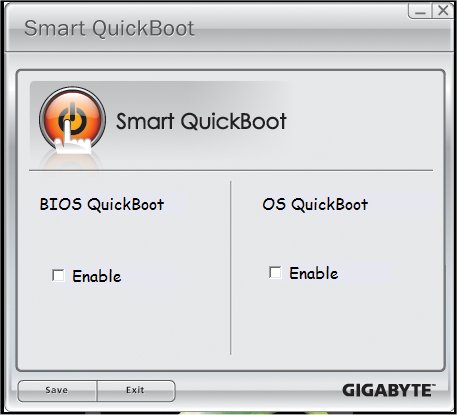
Using Smart Quickboot you can skip some of the BIOS testing prior to entering the OS and streamline the booting procedure by using OS Quickboot. From what we understand, OS QuickBoot is a utilized sleep state. Instead of shutting the computer down it forces a sleep state which results in the PC booting much faster.

We spent a lot of time testing features on the Gigabyte GA-PA55-UD6 and Smart QuickBoost was the only one we had a problem with. It took our high end rig to 3.08 with a Bclk of 140 with no problems but beyond that we got bluescreens. Unlike some boards which have an auto overclocking feature, this is a preset overclock that uses a BIOS Mask. A BIOS Mask is nothing more than a pre-determined set of overclocking frequencies and voltages that worked on a specific setup. The Faster setting Mask worked for us, but Turbo and Twin Turbo caused blue screens. The good news for most overclockers is that the Turbo and Twin Turbo settings were very close to correct so they make a good starting point for stabilizing the overclock.
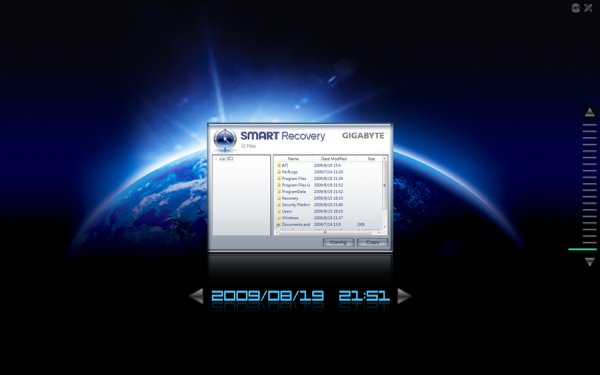
Smart Recovery is a utility that lets you recover a previously working operating system state after having an OS boot failure. Similar to System Restore but more advanced. If nothing else, it provides an extra layer of protection against those little overclocking accidents that happen. We actually corrupted our OS during testing and Smart Restore had us back in Windows in no time at all. We were of course forced to break out our test systems Hard Drive Clone and restore from the clone, but that was only to ensure consistency in testing. The Smart Restore worked just fine.
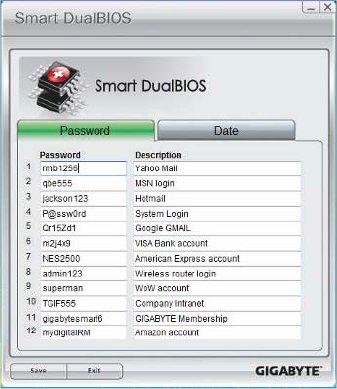
Gigabyte used to have a 8MB dual BIOS for a total of 16MB of BIOS storage. On the GA-PA55-UD6 and other P55 boards they’ve moved to a larger 16MB chip. With Dual BIOS you have a total of 32MB BIOS storage space. Since they have some space left on the BIOS setup they included a password protected storage area within the BIOS. Free from the constraints of an OS crash, the passwords are stored safely in the BIOS and if the system crashes your passwords are safely stored.
You can also store important dates on the BIOS chip which again are safe from OS crash. If you happen to be one of those people that can’t remember birthdays or anniversaries you can store those in your computers BIOS.
Gigabyte hinted at other BIOS features that may utilize the extra storage space on the Chips, but it would be premature to go into any detail.
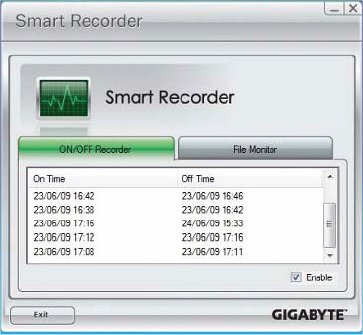
Smart Recorder’s first screen simply keeps track of when the computer was turned on and off. Probably best used to see if the computer is being accessed during times when there should be no activity on the machine. If you happen to see some 2:00AM entries on the computer and happen to have teenage kids in the house, you’ll know if they were up late surfing those dreaded recipe websites.
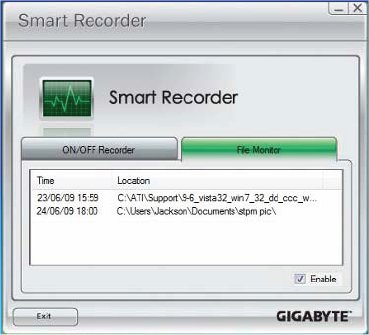
The second portion of Smart Recorder keeps track of files that have changed. While most people would wonder why you would want to do that, one instance we can think of that would be terribly handy is restoring a system after a virus issue. The BIOS will tell you which files have changed and you can clean the virus and restore the affected files without all the guess work or reloading the OS.
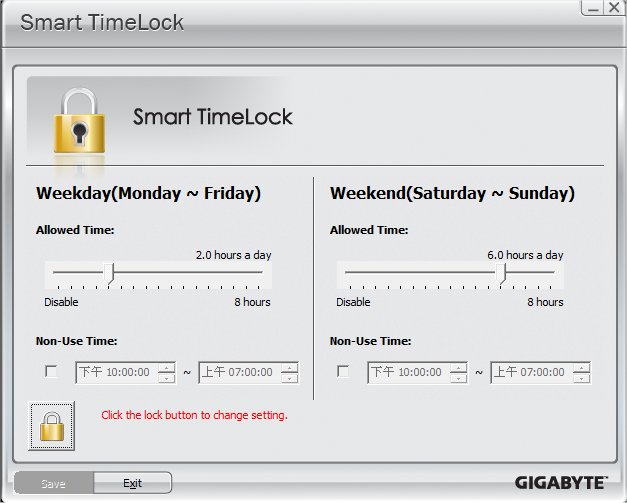
So you accessed Smart Recorder and the kids have been doing some midnight surfing that you don’t approve of. You can use Smart TimeLock to set constraints on when the computer can be used without turning to the OS to set the constraints. There’s a much larger chance of finding a workaround for the OS setting for limiting use of the machine than a direct BIOS lock down. Lock down the BIOS and the only way this puppy is going anywhere is if the password holder allows the machine to be booted.
Ever wondered how nice it would be to increase your hard drive speed without having to lose all the data on the drive? With Extreme Hard Drive, all you have to do is connect another hard drive and Extreme Hard Drive will handle the nuts and bolts of speeding up the system with the additional hard drive.
Smart Dual LAN is two physical LAN chips on the same motherboard. That’s not unusual to see on boards these days, but what is unusual is that the Gigabyte Smart LAN will automatically switch you to the a working chip seamlessly if one fails.
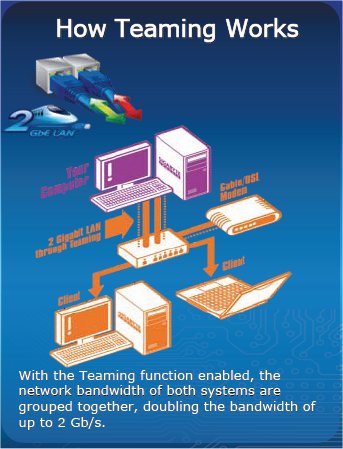
If you need blazing LAN speed you can opt to team your LAN ports. Teaming means connecting both LAN ports to operate as one LAN port but at a much higher speed.
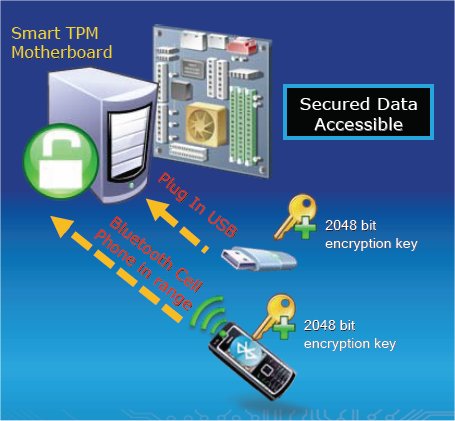
The GA-P55A-UD6 is a Smart TPM motherboard, it has a TPM (Trusted Platform Module) Chip installed, the TPM chip provides seamless 2048 Bit encryption for a portion of your hard drive to secure your sensitive files. Two methods of keying the security system are provided, you can use a USB thumb drive which has to be physically inserted in the machine to access to encrypted partition but then to secure the partition you have to remove the Thumb drive every time you leave the computer. Another method of keying the encryption chip is by a Bluetooth enabled phone. In the case of using the phone for the key, proximity of the phone to the computer is the method of unlocking the encryption. Simply by having your phone close to the rig it unlocks the encryption. We would suggest having a USB key ready for use, then using the phone for the encryption key. That way if you break your phone, or forget to bring it to work you have both methods available for accessing the encrypted files.
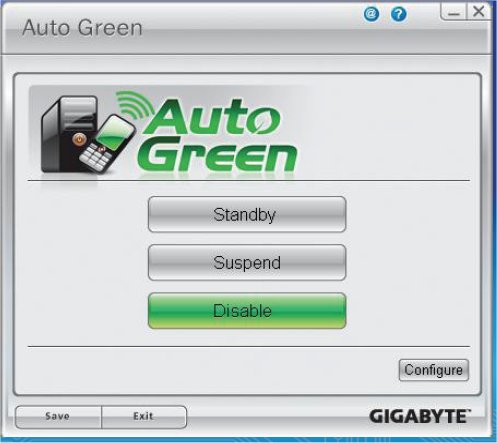
You can also use your Bluetooth phone to set lower power states on the rig if your going to be away from it longer than anticipated.
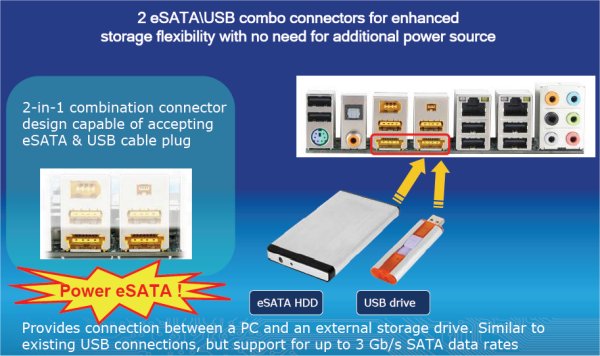
Here’s a feature we’ve been looking forward to. Powered e-Sata ports have been a point of contention with us for some time now. Having a lot of e-Sata devices around the lab and having to plug them into the e-Sata port and using a USB cord to power them has been the big holdup with e-Sata mainstreaming. With powered e-Sata ports the unhandy USB cord goes away and the e-Sata port provides the power to the e-Sata device of choice. If you don’t use e-Sata ports Gigabyte has made the ports USB compatible so you can also hook up normal USB devices. You’ll have 8 native USB ports and that extends to 10 if you don’t use e-Sata.
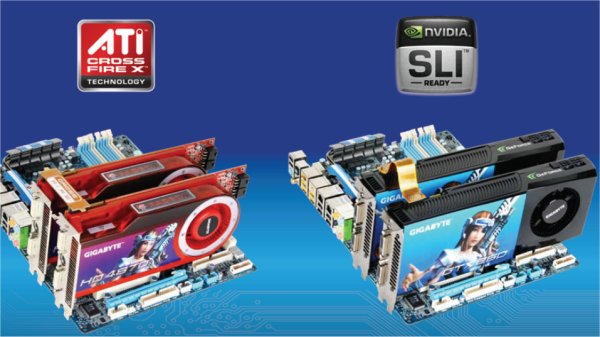
Like the LGA 1366 platform if the motherboard vendor licenses them you can have either Crossfire or SLI on LGA 1156 boards. The GA-PA55-UD6 board supports both Crossfire and SLI so no matter which GPU camp you sit in you can enjoy Multi-GPU goodness.
Did we forget to mention 24 Phase power?
Pictures
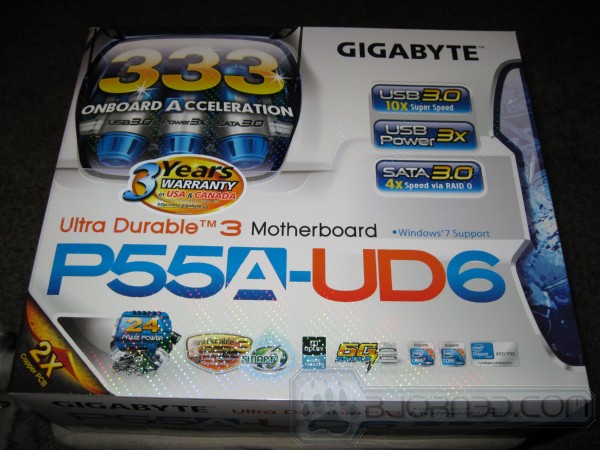
The board itself is about the same as the GA-P55-UD6 box with the exception of the 333 logo. The 333 logo is for USB 3.0, 3x USB power, and SATA 3. The board has the same industry leading 24 phase power and we expect it to be an OCing champ just like the P55-UD6.
Looking at the entire board about all we could see for possible layout complaints is the first PCI-E 1x slot might be obstructed by the heatsink to the left of the CPU socket. If you use a dual slot cooler GPU the second PCI-E 1X slot will be obstructed. Then with six ram slots and 12GB kits appearing from most major manufacutrers the slot closest to the CPU might not accomidate tall ram kits.
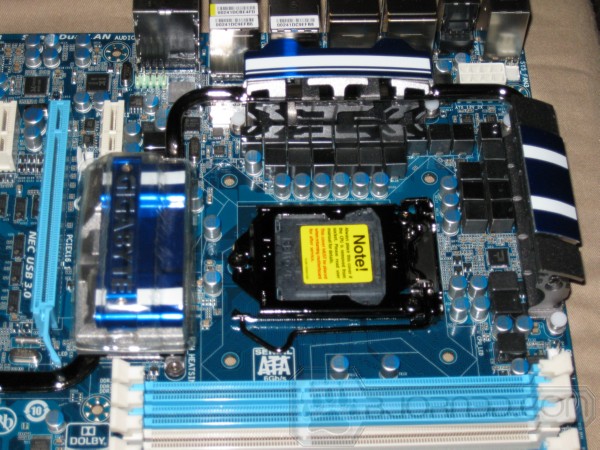
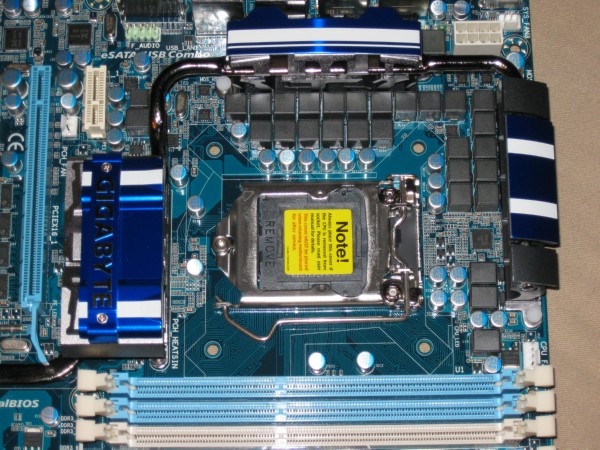
Moving in on the CPU area you can see the 24 phase power design and the honeycombed heatsing design used to regulate heat on the VRM’s.
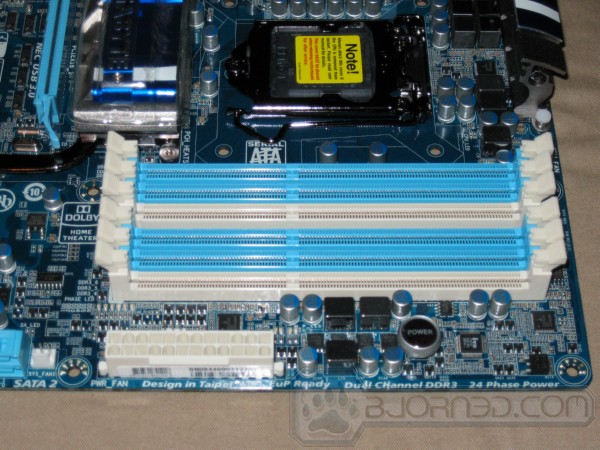
Backing up to the edge of the board you see the 24 pin motherboard power connector but more interesting than that is the oversized power buttom on the edge of the board.
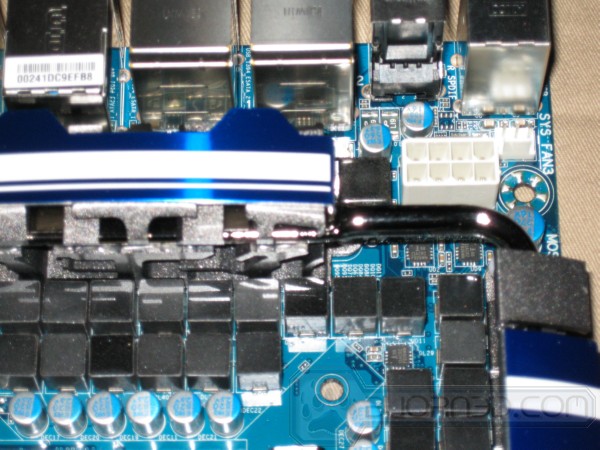
On top the CPU socket you’ll find the 8 ppin CPU power connector and you get a little beter look at the honeycombed heatsink. This might not seem like a big thing to a lot of people but notice how the ferrite chokes line up? Well placed components often show better and tighter quality control on a product.
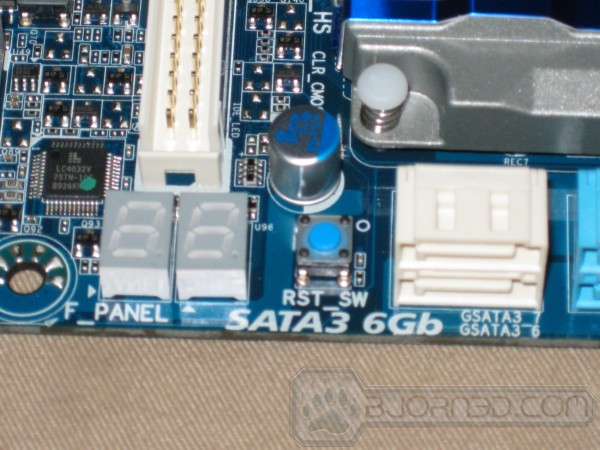
Right between the LED indicator panel and the SATA 3 ports you find a reset switch. It’s not really in a vary handy place but we had no problem reaching it on our install.
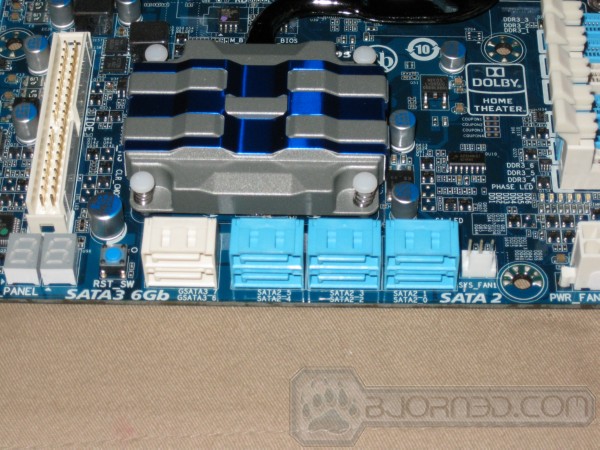
Backing up just a hair you get a look at the 90 degree sata ports, the 6 ports in blue are SATA 3 and the white ports are SATA 3. The long white port to the left is the IDE port. So lets see here currently we have SATA 2, SATA 3, E-Sata, IDE and Floppy ports. While we can understand the wanting to keep the legacy IDE and Floppy ports isn’t it really time to just drop them from enthusiast boards?
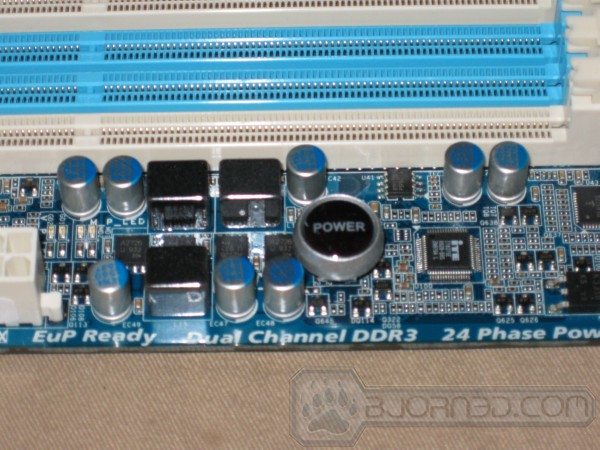
Here’s a closeup of the onboard power button, you should note that it lights up blue when the board is powered on.
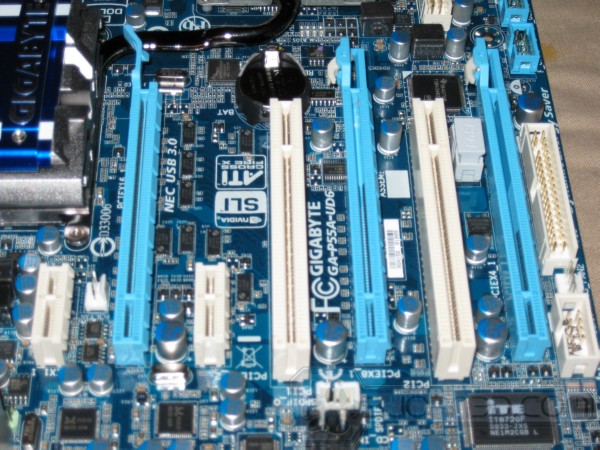
Expansion slots the first slot is the PCI-E 1x slot, Second slot is PCI-E 16x unless you are using SATA 3 or USB 3.0 Turbo then it drops to 8x. Third slot is another PCI-E 1x which will be obstructed by a dual slot cooler GPU. Then a regular PCI slot followed by another PCI-E 16x slot that will run at 8x during multi-GPU operation. Again if you enable SATA 3 or USB 3.0 Turbo you can’t use Multi-GPU so this slot would have to remain unused. If you disable USB 3.0 Turbo and SATA 3 Turbo and run Multi-GPU the first two PCI-E 16x slots run at 8x8x. That’s a limitation of the Intel P55 chipset. Geek Gods forbid that Intel would give us two PCI-E 16x slots running full speed without buying into the LGA 1366 i7 platform. After the second PCI-E slot you get another PCI slot then finally the third PCI-E 16x slot.
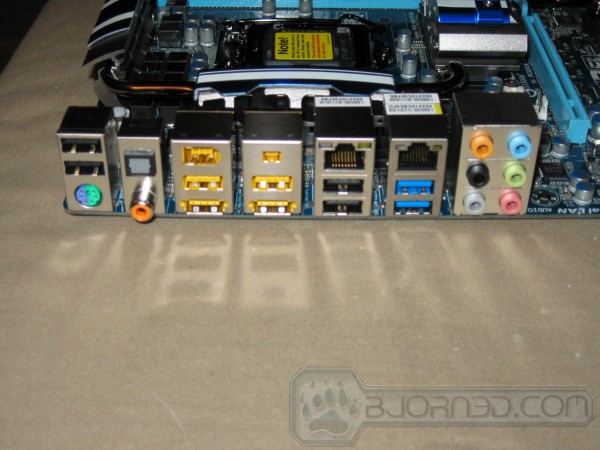
The rear I/O on this board is a thing of beauty. You might say it looks pretty normal, but its definitely not. The two bottom yellow ports are powered eSATA that double as USB ports, just having powered eSATA ports is a luxury in itself. Having them double as USB ports, that’s a thing of beauty.
To the left you get 2 USB ports on top, a combo PS2 port, then an optical S/PDIF and a Digital Coaxial sound out. A Yellow Firewire port, to the right of the firewire port is a mini Firewire port and under those are a couple of USB ports. Moving to the right is a couple of GIgabit LAN ports and two more USB. Under the second Gigabit Lan port you find the two USB 3.0 ports. Then last but not least, the normal sound connector setup.

The hardware portion of the bundle is quite copious. We have an I/O plate, IDE cable, two 90 degree SATA cables, two regular SATA cables, an SLI bridge, a floppy cable, two eSATA Cables, two port eSATA power cable and an expansion port with two USB and a Firewire port.
BIOS
Many modern BIOS’s have upwards of 40 pages and we aren’t going to attempt to cover every page. What we are going to cover are the most interesting pages.
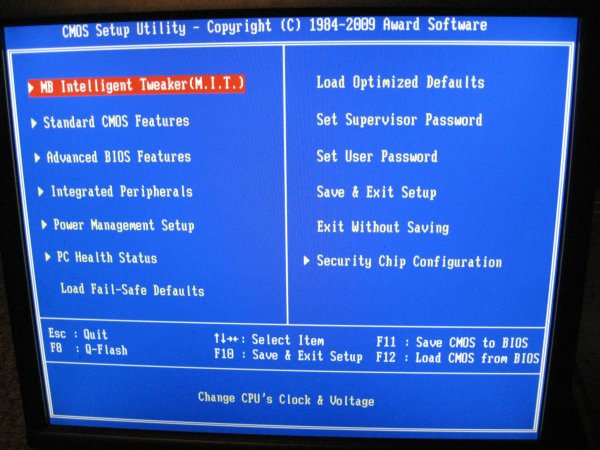
Going into BIOS you get the initial screen and from here you can branch into any screen you want..
Most overclocker end users will want to go directly into the MB Intelligent Tweaker section and get down to business.
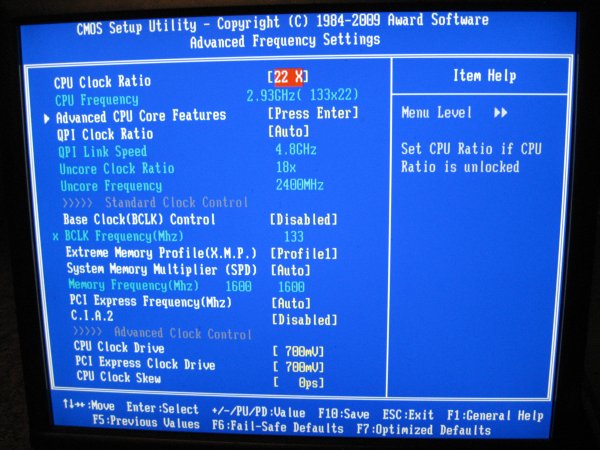
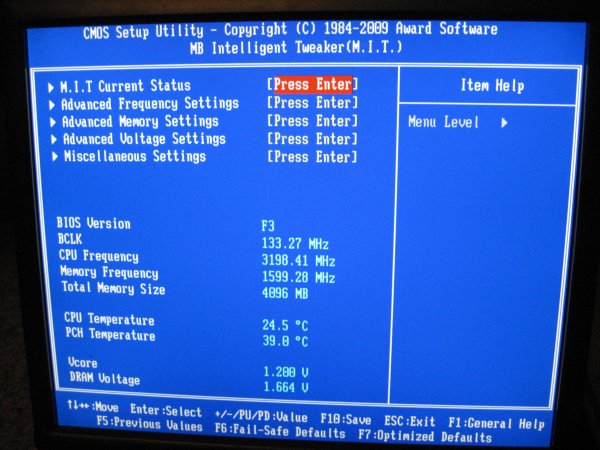
Advanced Frequency settings gets you almost everything you need for overclocking. We tried the P55A-UD6 with a bunch of configurations and this is one of the easiest boards we’ve seen to Overclock. We even left power savings enabled in BIOS and the board overclocked like a champ and we were able to enjoy the power savings and the board shifted to full CPU speed seamlessly. You should note though for charting and benchmarking purposes we turn off power savings lest they skew the numbers while the CPU is powering up to full speed.
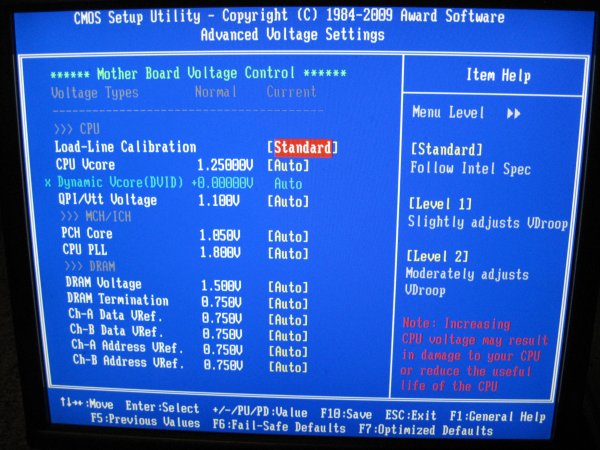
The Advanced Voltage Settings screen is a sub screen of the MIT screen and you have complete control of all the voltages you need for overclocking.
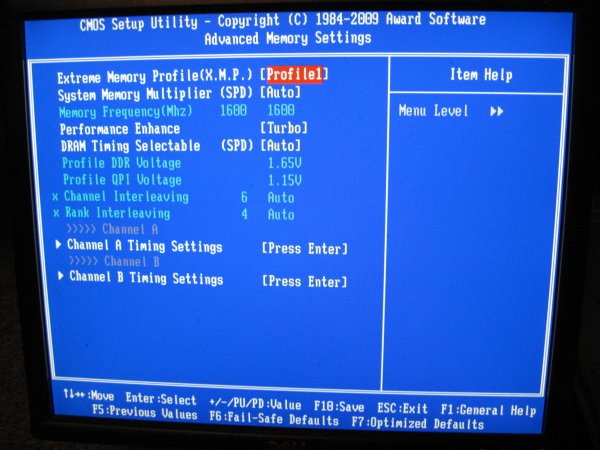
The Advanced Memory Settings screen lets you select the Intel XMP profile or manually set your ram timings. We tested several kits on the board and they all worked with standard XMP settngs. We finally settled on a 8GB kit on Kingston HyperX and the 4 stick 8GB kit worked perfectly so while LGA 775 has always had rumors attached to it concerning the use of 4 memory modules P55(A) is looking good for 4 stick operation. We’ll be testing 12GB on a few boards later on (Drool).
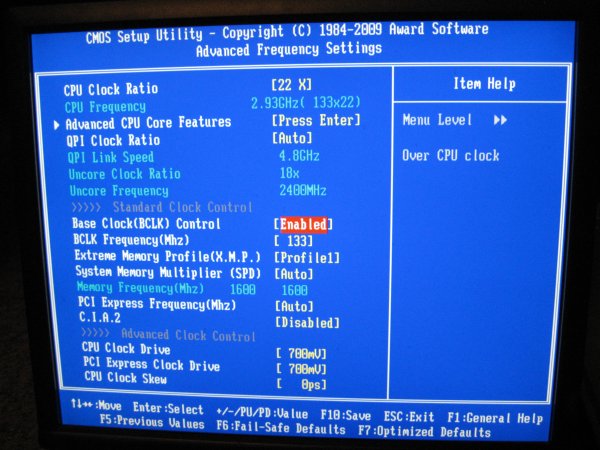
Back to the Advanced Frequency Settings Screen. Once you enable Base Clock (Bclk) Control you will be able to change CPU multiplier and BCLK settings. It might seem a little silly to mention this to most seasoned overclockers but you would be amazed how many emails a week we get asking how to enable Overclocking.
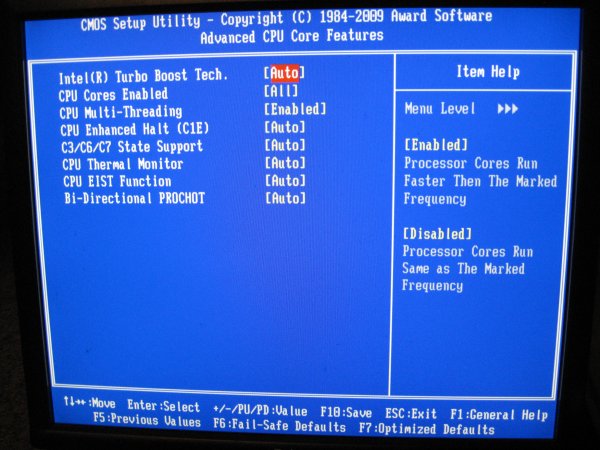
The the Advanced CPU Core Features page. When uding the P55A-UD6 for day to day operation we leave Intel Turbo Boost Technology enabled, because frankly Intel hit a home run with that technology. For benchmarking and hardcore overclocking we disable Turbo Boost. We also leave the power saving and thermal controls intact on a day to day basis. We disable C1E, C3/C6/C7 and CPU EIST but leave CPU thermal monitoring enabled. Toasting CPU’s sounds fun until you have to go out of pocket for a $600 – $1000 CPU. We suggest you leave CPU Thermal Monitor enabled during your adventures.
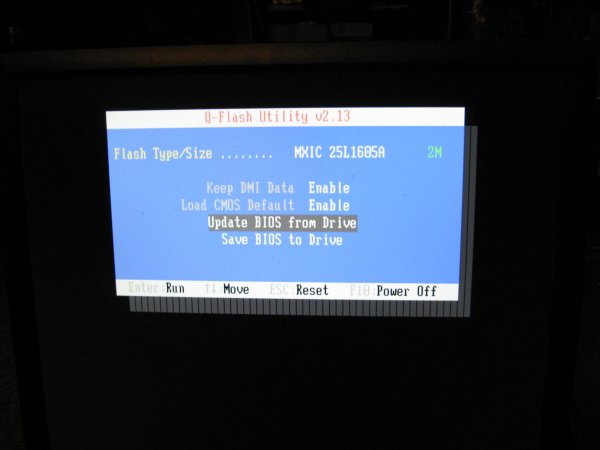
Then last but far from least the -Flash Utility. If you’ve ever suffered a DOS BIOS flash you’ll understand how nice this feature is. Put your BIOS on a Thumb drive and flash away.
Testing & Methodology
To test the Gigabyte GA-P55A-UD6 we used the same components we used in the Intel i5/i7 review. The only component we switched was the motherboard/Hard Drive and did a fresh load of Windows 7 Ultimate on the test rig. To that end, we’ve included the Intel Extreme board results in the Gigabyte GA-P55A-UD6 review for comparison purposes. Keeping the components the same across a variety of boards will ensure a level playing field for all the motherboards tested.
We’ve expanded our testing suite considerably for P55(A) and will continue to use the same tests across most of the motherboards and CPU’s we test. We run each test a total of at least three times minimum, some tests we run more than 3 times. We average the total of all the tests from each benchmark then report the average here.
The OS we use is Windows 7 Ultimate with all patches and updates applied. We also use the latest drivers available for the motherboard and any devices attached to the computer. We don’t disable a bunch of background tasks or particularly tweak the OS or system for bigger numbers. We do turn off drive indexing and daily defragging. We also turn off Prefetch and Superfetch. This is not an attempt to produce bigger benchmark numbers. Drive indexing and defragging can interfere with testing in that one test might occur without defragging going on and the next test defragging might be active, the same thing goes for drive indexing. We can’t control when defragging and indexing occur precisely enough to guarantee that they won’t interfere with testing, so we turn them off.
Prefetch tries to predict what you will load the next time you boot the machine. We disable it because we want to know how the program runs without any of the files being cached, otherwise each test run we’d have to clear pre-fetch to get accurate numbers. Lastly we disable Superfetch, Superfetch loads often used programs into memory and is one of the reasons people consider Vista to be such a memory hog. Vista fills the memory in an attempt to predict what you will load. Having one test run with files cached, and another test run with the files being un-cached would result in skewed numbers. Again since we can’t control it we turn it off. Other than those 4 things which can potentially interfere with benchmarking, and do so out of our control, we leave everything else running.
We went a little different on Hard Drive Testing and we mentioned it earlier. We are including the results from the Seagate Barracuda XT drive review here and reproducing them in their entirety for your convenience.
Test Rig
| Test Rig “Quadzilla i5” |
|
| Case Type | Sunbeam 9 Bay Acrylic Chassis |
| CPU | Core i7 870 |
| Motherboard |
Gigabyte GA-P55A-UD6 |
| RAM | Kingston HyperX DC DDR3 1600MHz 8 GB Kit Cas 8 |
| CPU Cooler | Thermalright Mux 120 (Dual 120mm Fans) |
| Hard Drives | Crucial 128 GB SSD(MLC/Samsung controller) |
| Optical | Sony DVD R/W |
| GPU(s) | BFG GTX-260 Maxcore |
| Case Fans | 120mm Fan cooling the mosfet CPU area |
| Docking Stations | None |
| Testing PSU | Tagan BZ 700w Modular |
| Legacy | None |
| Mouse | Razer Lachesis |
| Keyboard | Razer Lycosa |
| Gaming Ear Buds |
Razer Moray |
| Speakers | None |
| Any Attempt Copy This System Configuration May Lead to Bankruptcy |
|
Test Suite
|
Benchmarks |
|
Excel 2007 |
|
Blender |
|
SiSoft SANDRA XII Professional SP2 |
|
Everest Ultimate Edition v. 5.0 |
|
AutoMKV |
|
Cinebench R10 64 bit |
|
WinRar v. 3.71 |
|
POVRay |
|
Pro Show Gold |
Hard Drive Test Suite
|
Benchmarks |
|
ATTO |
|
HDTach |
|
Crystal DiskMark |
|
HD Tune Pro |
|
AS SSD Benchmark |
|
Sisoft Sandra |
|
Everest Ultimate |
ATTO
ATTO is a little long in the tooth but still provides a good method of checking hard drive performance. Since your comparing results from the same benchmark to other drives benched on the same software it provides a basis for comparison and in most cases provides reliable and reproducible results.
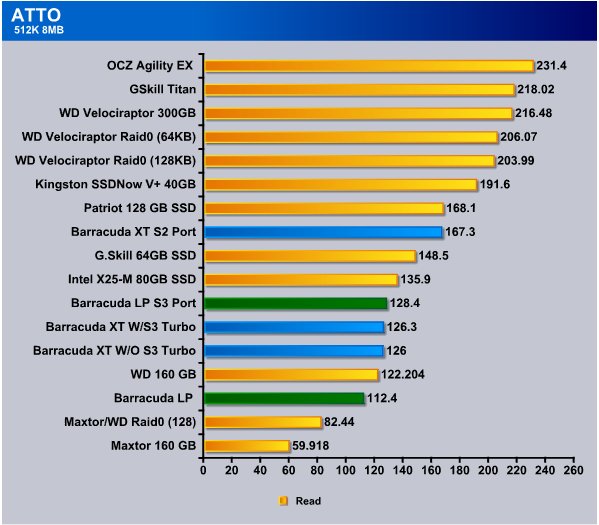
Lets get this out of the way right off the bat. We tested the Seagate Barracuda XT in SATA 3 Turbo, SATA 3 W/O Turbo, and on a S2 port. We also tested the Barracuda LP which has the same platter density on SATA 3 and SATA 2. While testing on SATA 3 we used SATA 3 Turbo. The Seagate Barracuda LP is a 5900 RPM drive and it’s the only drive we had onsite to test that has the same platter density. We would have preferred to have a 7200 RPM drive with the same density per platter but we didn’t have one onsite.
While the SATA 3 port with Turbo produced the most reliable results the SATA 3 without Turbo produced almost mirrored results. Since the drive doesn’t exceed 300MB/s there’s not much difference in transfer speed in this test. we did get a little bit of an amazing result from the Barracuda XT when it was hooked to the SATA 2 port and the transfer speed jumped to 167MB/s which is a jump of about 41MB/s using the older port. We suspect that that will change when the SATA 3 firmware on the drive and the interface has matured.
We were also a little shocked when the Barracuda LP hooked to the SATA 3 port beat the Barracuda XT by 2MB/s but we’ll have to watch the charts as we go to see if that’s a trend that holds up.

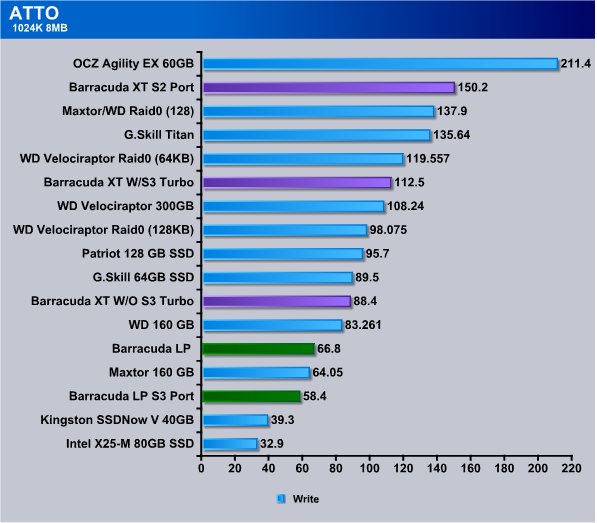
In the Atto write test we saw the best result from the Barracuda XT when hooked to the SATA 2 port and is scores a massive 143.9MB/s, hooking to the SATA 3 port with Turbo on we see 111.8MB/s and without turbo we see 90.02MB/s. The Barracuda LP dropped to 65.8MB/s on the SATA 2 port and 52.8MB/s on the SATA 3 port.
Again the Barracuda XT performed better on the SATA 2 port and it’s early in the game so we aren’t sure what’s up with that.
We can see the mental wheels churning in some readers, so lets cover this again. On Gigabyte boards specifically you have the SATA 3 option for Turbo, it’s not really turbo but lacking a better name they used Turbo because it’s a well understood phrase. SATA 3 Turbo provides the full 600MB/s theoretical speed, turning Turbo off limits the bandwidth to 300MB/s but lets you use SLI or Crossfire at 8x8x on the PCI-E lanes. Using Turbo disables SLI and Crossfire and limits the first PCI-E slot to 8x. We;ll have to study the effects of that in the motherboard review.
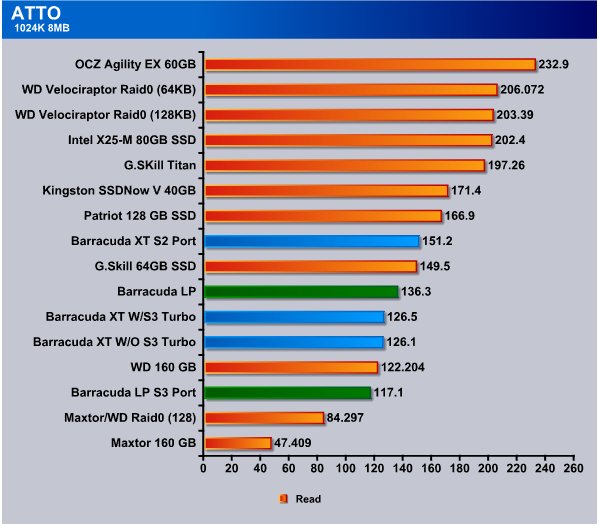
In the first three tests so far the Barracuda XT has performed better on the SATA 2 port by a pretty good margin and this time on the SATA 2 port it got 151.2MB/s and the Barracuda LP hooked to the SATA 2 port got 136.3MB/s which is more than 10MB/s better than the Barracuda XT did hooked to the SATA 3 port. Hooking the Barracuda LP to the S3 port hurt it’s performance and it dropped almost 20MB/s but we can’t hold that against the SATA 3 port or the Barracuda LP because the LP is designed for SATA 2 and we would consider hooking a SATA 2 drive to a SATA 3 port as a last ditch “I’m out of ports” option.
This is the 4th test (All ATTO so far) that shows the Barracuda XT running faster on the SATA 2 port, more than 37MB/s faster. Running SATA 3 with Turbo it hit 112.5MB/s and dropped to 88MB/s without Turbo. The Barracuda LP was running 66.8MB/s SATA 2 and again suffered on SATA 3.
HD TUNE PRO
HD Tune Pro is an extended version of HD Tune which includes many new features such as: write benchmark, secure erasing, AAM setting, folder usage view, disk monitor, command line parameters and file benchmark. HD Tune Pro is a computer benchmarking application that can test the performances of any PC.
Here are some key features of “HD Tune Pro”:
- Benchmark: measures the raw performance
- Transfer Rate
- Access Time
- CPU Usage
- Burst Rate
- Hard Disk information which includes firmware version, serial number, disk capacity, buffer size, transfer mode
- Hard Disk Health
- S.M.A.R.T. Information (Self-Monitoring Analysis and Reporting Technology)
- Temperature
- Power On Time
- Copy text to clipboard
- Copy screenshot to clipboard
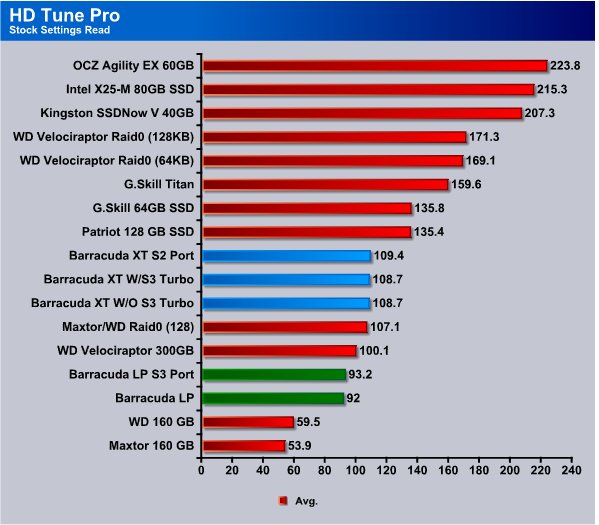
We got a very consistent speed from the Barracuda XT in the average read speed on HD Tune Pro. No Matter what port we hooked it to we were in the 108 – 109MB/s range. The Barracuda LP rabged from 92 – 93MB/s and that shows why we like the LP good performance with a “Green” design. For the most part we like raw speed, and in that case the Barracuda XT is more to our taste in platter drives.
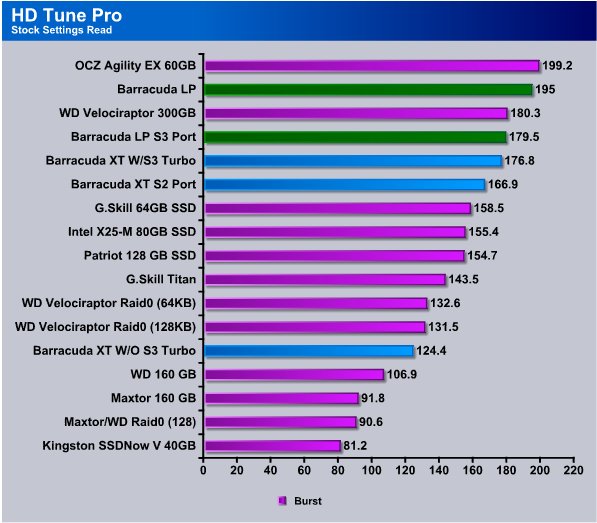
Burst speed which is a Cache hit transfer the Barracuda LP took top honors for platter drives and came in at 195MB/s and the Barracuda XT topped out at 176.8MB/s on the SATA 3 port with Turbo enabled. On the SATA 2 port it gave a respectable 166.9MB/s and on the SATA 3 port without Turbo performance dropped to 124.4MB/s. Despite what we have heard about SATA 3 Turbo/Non-Turbo we can’t help but feel that there is a difference in performance between the two settings on the Gigabyte P55A-UD6, that seems to show up mostly in Burst testing.
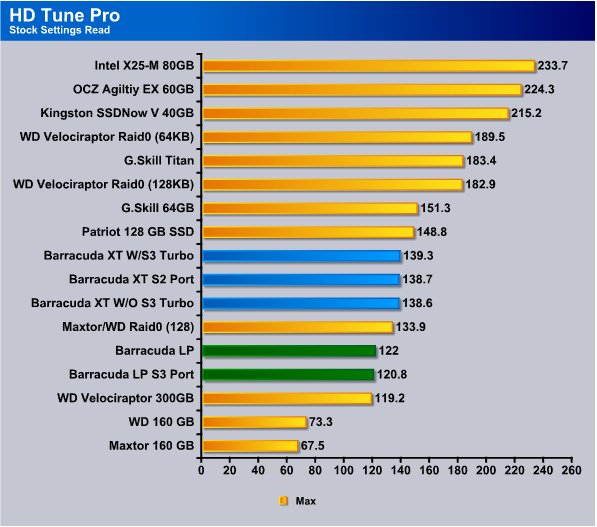
The Maximum speed on the Barracuda XT came in at 139.3MB/s on the SATA 3 port with Turbo enabled but here again we see minimal differences between and port we had the Xt on. Notice the Barracuda XT is turning in 20MB/s more sped than the Velociraptor in this test. We can just imagine what this drive would do if it had the same rotational speed of a Velociraptor. We would suspect that one of the reasons the XT is able to outstrip the Velociraptor is hard drive platter density. The Seagate Barracuda has a higher platter density and the read write head doesn’t have to move as far to read or write the same amount of data.
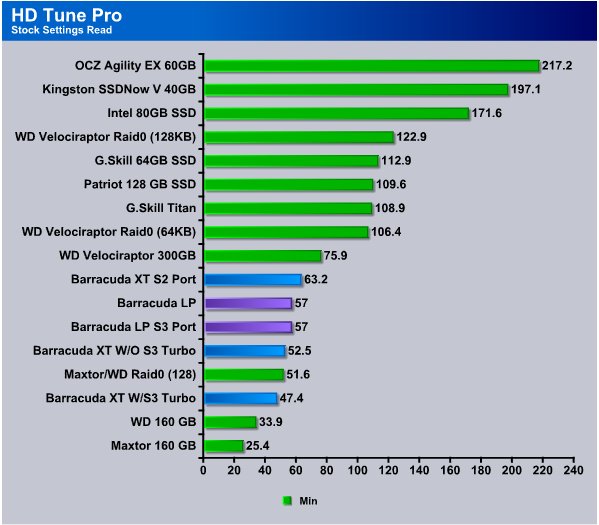
Minimum speeds on the Barracuda XT were a little lackluster but for the most part the drops in speed were so momentary it was merely a blip on the screen. Just a fraction of a second drop in speed that doesn’t affect average speed by more than 1 – 2 MB/s looks bad in the minimum speed test. While 50MB/s isn’t a bad score and 47.4MB/s isn’t something to sneeze at we expected a little better but this early in the interfaces design we can understand little glitches.
HDTach
HD Tach is a physical performance hard drive test which utilizes a special kernel mode VXD in order to get maximum accuracy by bypassing the file system. A similar mechanism is used in Windows NT/2000.
The HD Tach sequential read test is a little bit different from other benchmarks. Most benchmarks create a file on the hard drive and test within that file.
The problem is that modern hard drives use a zone bit recording technique that allows different read speeds depending on where the data is located. Data on the outside of the drive is much faster than data recorded on the inside. SSD’s are freed from this limitation due to their Nans Flash technology.
HD Tach reads from areas all over the hard drive and reports an average speed. It also logs the read speeds to a text file that you can load into a spreadsheet and graph to visually read the results of the test.
In addition to sequential read, HD Tach tests the drive’s random access time. Random access is the true measure of seek speed. Many drives advertise sub 10 millisecond seek speeds, but seek speeds are misleading.
Finally, HD Tach tests the drive burst speed. The burst speed is the speed that data can be accessed from the drive’s on-board read-ahead memory. This measures the speed of the drive and controller interface.
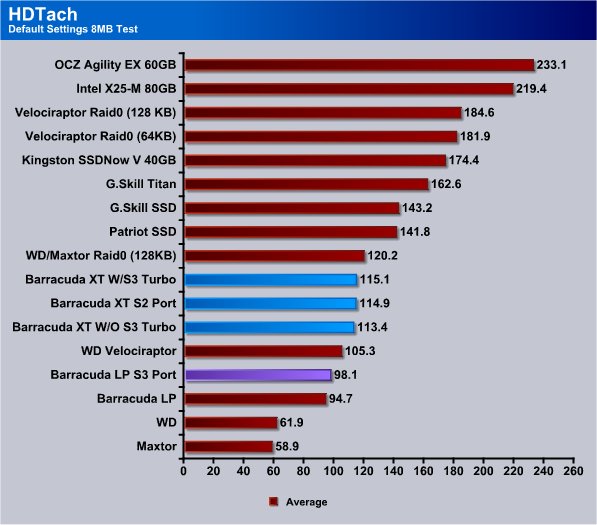
HDTach sees a much closer performance from the Barracuda XT and we suspect that HDTach is more well equipped than the now long in the tooth ATTO. The Barracuda XT hit 115.1MB/s with Turbo, and 113.4MB.s without Turbo, and 114.9MB/s on the SATA 2 port. For the first time the Barracuda LP did better on the SATA 3 port but the speed is down in the sub 100MB/s speed which is to be expected from a 5900 RPM Green drive.

Burst testing shows the Barracuda XT’s massive 64MB cache has an advantage. Burst testing is typically cache only transfer speed and the massive 64MB cache on the XT gave us a 296.6MB/s. Burst testing on the XT without SATA 3 Turbo dropped it to 182.3MB/s so there is a significant difference there. The Barracuda LP which has 32 MB cache ran in the 220(ish)MB/s range.
Crystal Disk Mark
Crystal DiskMark is a simple hard disk benchmarking software that can perform sequential or random read/write tests on a selected drive. You can select the number of read/write operations as well as the size of the data sample. The program presents you with easy to read MP/s results for each test. Standalone software, no installation required.
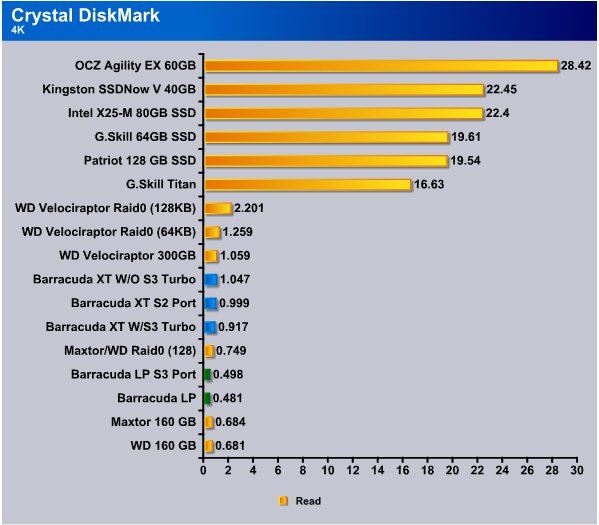
Getting to the 4K read test in CDM, and we’ve said this many times, the 4k test is brutal and typically on platter drives you see 1MB/s and under and that’s completely normal for 4k continually repeated writes. It’s a brutal test. The Baracuda XT barely breaks the 1MB/s (Sata 3 No Turbo) barrier and previously the only platter drive (Sata) to do that, that we’ve tested was the Velociraptor. Shifting the drive to SATA 3 with Turbo we got .917MB/s and on the SATA 2 port we got .999MB/s. The 4K test wasn’t nearly as kind to the Barracuda LP but it’s a 5900 RPM drive and designed for Green operation while still providing good performance.
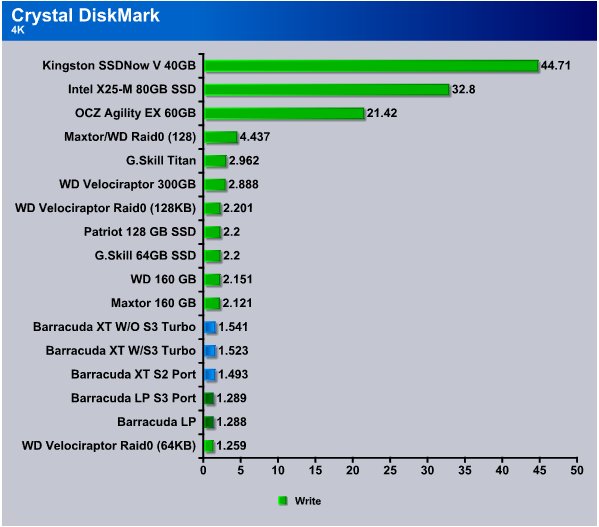
The Barracuda XT did a little better in the 4k write test and turned in a 1.541MB/s non-turbo SATA 3, SATA 3 with Turbo it slipped a little but not much and turned in a 1.523MB/s and on SATA 2 a respectable 1.493MB/s. The Seagate Barracuda LP was in the 1.28 MB/s range.
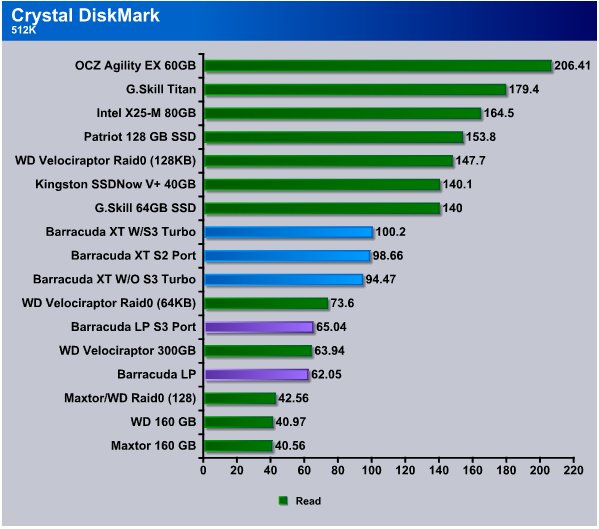
The 512k read test gives us an idea of larger but still reasonable sized writes and comes in at 100.2MB/s using SATA 3 Turbo mode, on the SATA 2 port we got 98.66MB/s and SATA 3 without Turbo 94.47MB/s. The Barracuda LP came in at 65.04MB/s on SATA 3 and 62.05MB/s on SATA 2. Again keep in mind the Barracuda LP is designed for a different role but it was the only platter drive we had available with the same platter density.

Sequential 512K write we see that the Seagate Barracuda LP hits 65.76MB/s without Turbo and 65.63MB/s with Turbo and 65.04MB/s on SATA 2. Throughout CDM testing we haven’t seen much difference between SATA 3, SATA 3 non-Turbo and SATA 2. Since SATA 3 drives won’t saturate the available bandwidth of the interface at this time we expected this to be the case. What you have to keep in mind it that this is the first generation of SATA 3 drives and interfaces and SATA 3 might be challenged by Solid State Drives in RAID configurations but the interface is designed for future needs and as platter density on drives increases (and rotational speed) the platter drives will consume more of the bandwidth. So SATA 3 while in it’s infancy isn’t utilizing the bandwidth this is just the baby step portion of development and yet we may get some benifit from soon to be released SATA 3 SSD’s.
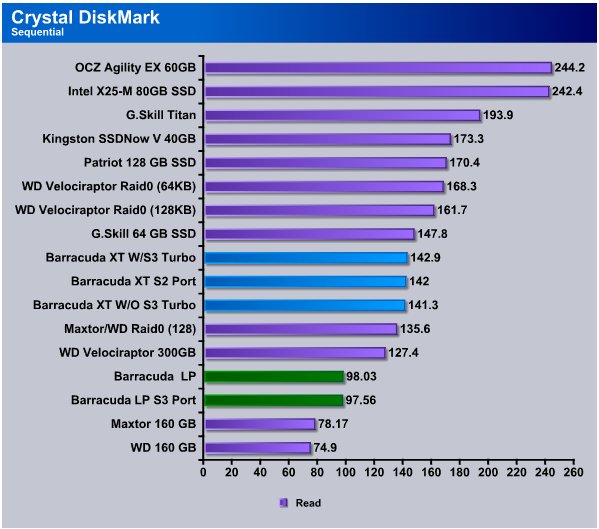
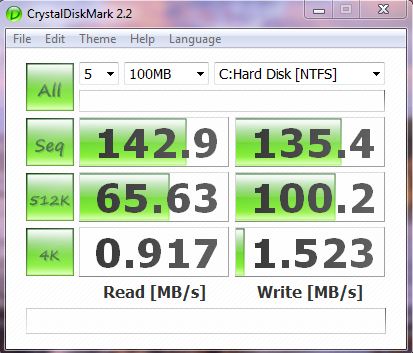
Here’s where CDM gets interesting, the Barracuda XT with SATA 3 Turbo hits 142.9MB/s and on the SATA 2 port 142MB/s and finally on the SATA 3 without Turbo 141.3MB/s. Notice the mighty Velociraptor setting down there at 127.4MB/s. The Barracuda XT isn’t what you might call a slacker in sequential reads.
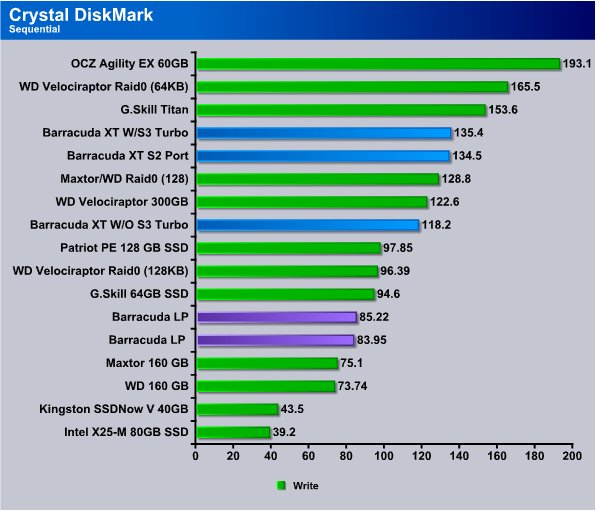
Here again we see the Barracuda XT hitting stride at 135.4MB/s in SATA 3 Turbo, and once again it’s looking down at the Velociraptor. With the XT on the SATA 2 port we see 134.5MB/s and SATA 3 without Turbo 118.2MB/s which frankly is more than we expected from the information we got from Gigabyte.
PCMark Vantage
This new version of PCMark shifts its focus away from only providing pure hardware performance-analysis results, to generating accurate performance ratings based on popular Windows Vista Consumer Scenarios ranging from media and entertainment to productivity and communication. PCMark Vantage incorporates an updated interface with easier access to test details and selections, results, system info and other features for 32 and 64-bit computers.
In this case we are primarily looking at the HD suite in PCMark Vantage and since we run the professional version we can select just that Suite. Since PCMark Vantage is based on Windows Vista workloads, and Windows 7 is (forgive us oh Microsoft deities) very similar to Vista it should provide some interesting non-synthetic drive transfer results.
Be warned that non-synthetic drive transfer rate results are often shocking when compared to standard synthetic benchmarks which tend to shoot for top end performance numbers.
HD Suite Overall Results

We realize that the overall score doesn’t do much for us when it comes to what speeds the drive actually achieved but it’s good for comparison to it’s slower spindle sped brother the 5900RPM LP. Top end score for the Barracuda XT on SATA 3 Turbo is 5503 while non-Turbo drops to 5326, and SATA 2 which fared well in synthetic benchmarks dropped even farther to 5078. The Barracuda LP comes in at 3866 SATA 2 and 3845 SATA 3 which confirms the performance hit from using a SATA 2 drive on a SATA 3 port on Gigabyte boards.
Application Loading
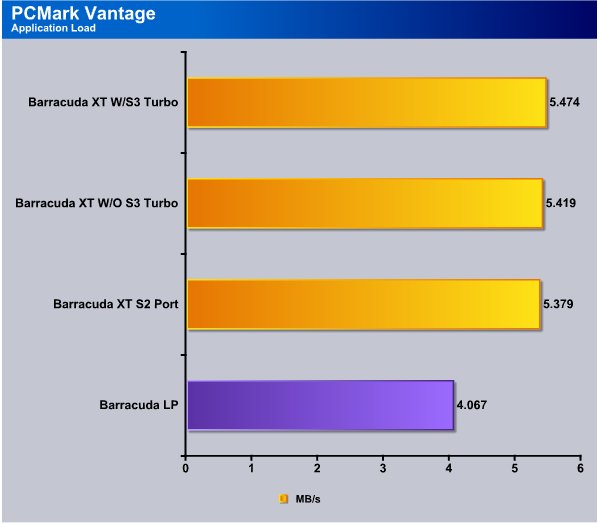
Here’s where the shock sets in, while synthetic benchmarks show speeds in excess of 100MB/s on a lot of drives the Application load test shows that we are getting 5.474MB/s in SATA 3 Turbo with non-turbo SATA 3 coming in at 5.419MB/s and on SATA 2 the Barracuda XT turned in a 5.379MB/s. We just ran the Barracuda LP on a SATA 2 port for this series of tests to confirm the transfer rates and it turned in a 4.067MB/s.
Gaming
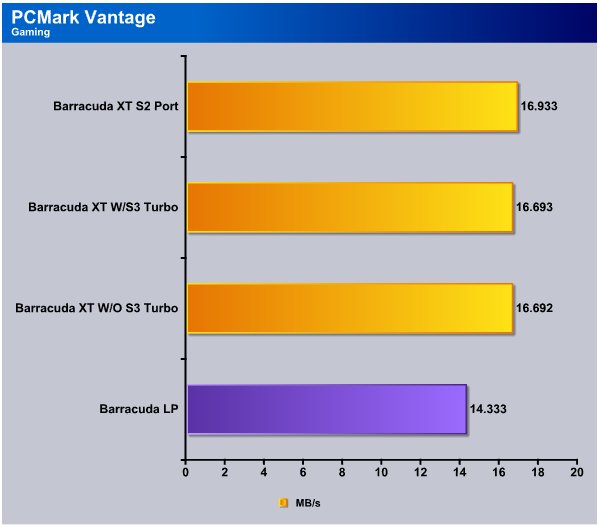
Gaming tests in Vantage show a little improvement and gave the advantage to the Barracuda XT while on the SATA 2 port, closely followed by the XT with SATA 3 Turbo, and then SATA 3 without turbo The difference between turbo and non-turbo was almost non-existent. The Barracuda LP turned in 14.333MB/s which is great considering it’s a low power consumption Green drive.
Media Player
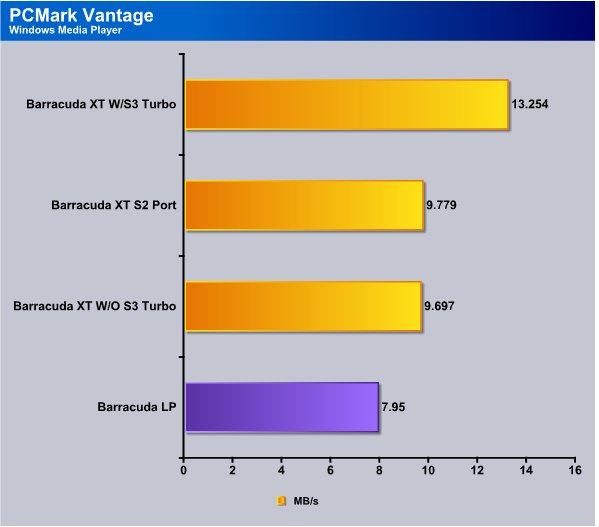
Windows Media Player sees the Barracuda XT running at 13.254MB/s with Turbo enabled and we get a serious drop to 9.779MB/s on the SATA 2 port, and a slight drop to 9.697MB/s without SATA 3 Turbo. The LP version (Sata 2 LP drive) comes in at 7.95MB/s.
Photo Gallery

Vantage sees importing pictures to Windows Photo Gallery giving advantage to the Barracuda XT while running on the SATA 2 port, and it’s neck and neck for non-Turbo and Turbo SATA 3. The Barracuda LP is still turning in respectable numbers for a Green Drive.
Vista Startup
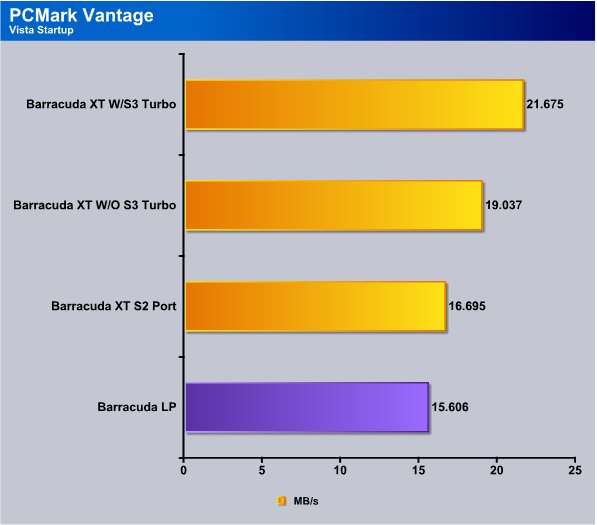
The Vista Startup portion of Vantage shows the Barracuda XT hitting 21.675MB/s in SATA 3 Turbo Mode, and SATA 3 without Turbo 19.037MB/s. While attached to the SATA 2 port the XT drive runs at 16.695MB/s and the Barracuda LP drive hits 15.606MB/s.
Windows Defender
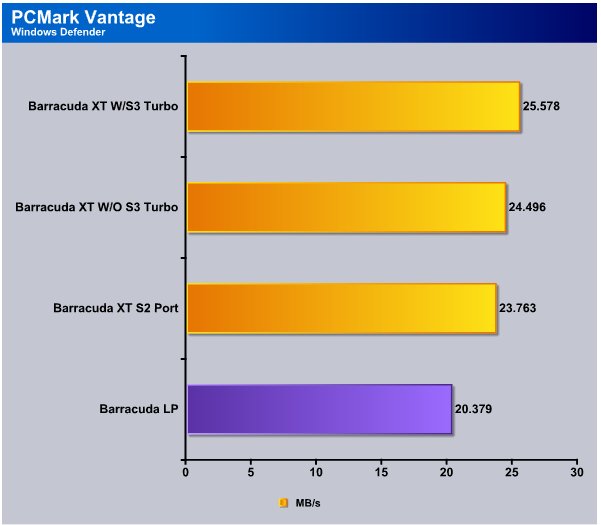
Vantages Windows Defender test shows the Barracuda XT with Turbo hitting 25.578MB/s and without Turbo 24.496MB/s. On the SATA 2 port the XT turned in a 23.763MB/s and the LP drive turned in a 20.378MB/s and of course it was on the SATA 2 port.
Media Center
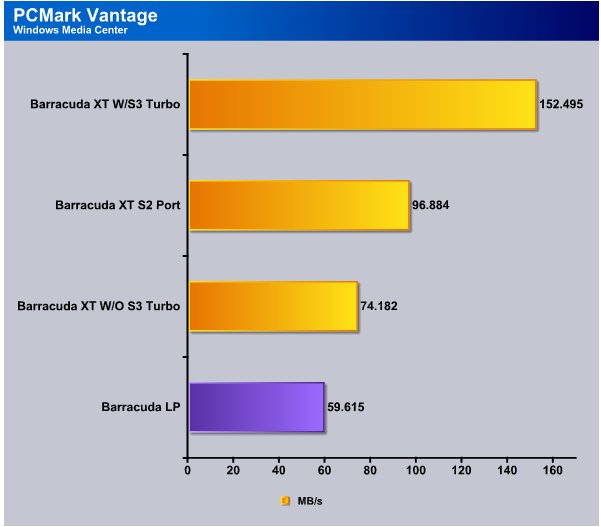
We aren’t sure about the Media Center results and we may be seeing a cache hit on the SATA 3 Barracuda XT but with such high numbers on all the drives we suspect that this result is accurate. We ran it a total of six times to make sure the results were consistent.
Movie Maker
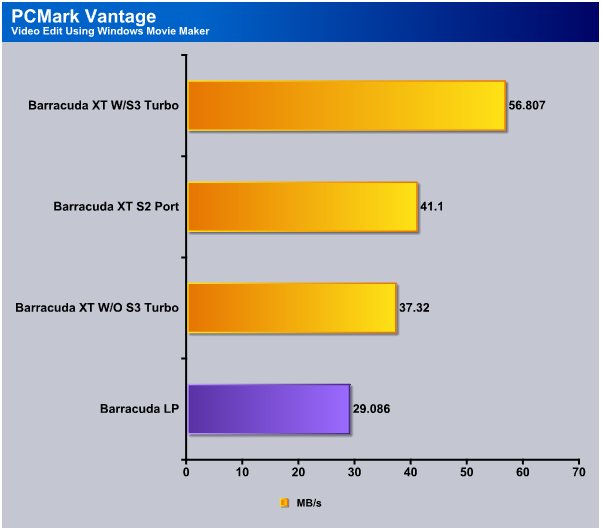
Video Editing using Windows Movie Maker shows the Barracuda XT with SATA 3 Turbo hitting 56.807MB/s and on the SATA 2 port only 41.1MB/s. Without Turbo but still on the SATA 3 port we got 37.32MB/s and the LP drive hit 29.086MB/s. We checked our settings a bunch of times and we don’t understand why we got such large differences between SATA 3 non-turbo and SATA 3 Turbo but the settings were consistent across testing.
Benchmark Screen Shots
We took a few screen shots of the Barracuda XT we wanted to put out there. Some of the HD testing utilities produce transfer rate graphs that provide extended information beyond what a Bar chart can convey in a palatable manner.
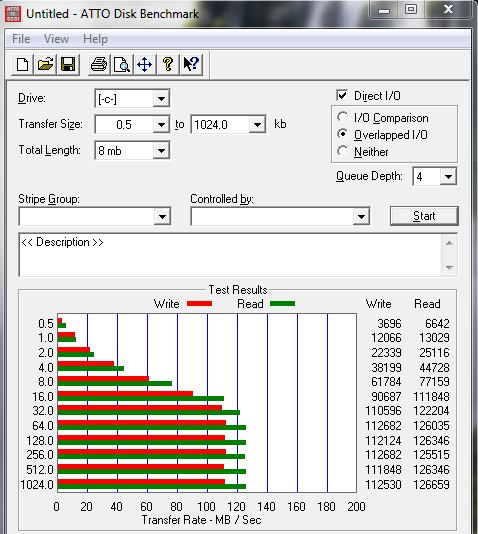
ATTO is a little long in the tooth but we found it interesting that the Seagate Barracuda XT leveled out transfer speeds on relatively small transfers. Notice that in this shot of the XT running on the SATA 3 port with Turbo enabled that at 16kb it hits 90.687MB/s Write and 111.848MB/s Read, then levels out at 32kb and transfer speeds don’t vary much from that point on.
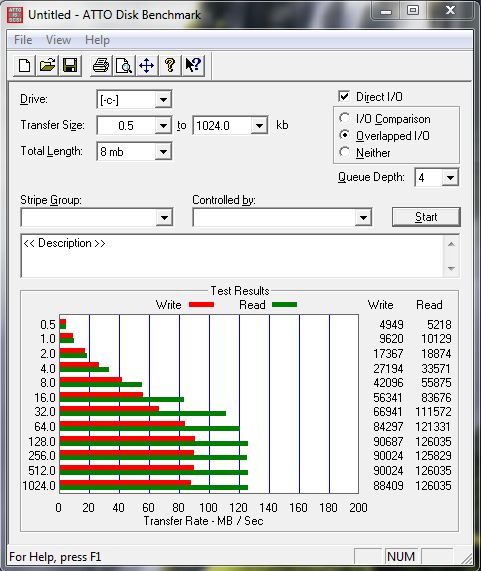
Now this is the sister shot to the previous shot and all we’ve done is go into BIOS and disable SATA 3 Turbo so it’s still running on the SATA 3 port but turning off turbo had an effect on the drive. Please note that Turbo is a function of the Gigabyte P55A-UD6 and not specific to the HD itself.
At 16kb on the previous screen shot we were reading 118.848MB/s and writing at 90.687MB/s and here with Turbo off we are reading 83.676MB/s and writing at 56.341MB/s so turning Turbo off on the P55A-UD6 is reducing bandwidth on the drive.
Here it is again, With Turbo on SATA 3 enabled on the P55A-UD6 it takes 8x PCI-E lanes from the first PCI-E slot and your GPU runs at 8x and SLI/Crossfire are disabled. With Turbo off you get SLI/Crossfire running at 8x8x or single card at 16x. Single card 8x isn’t going to hurt performance, but turning Turbo on you lose SLI/Crossfire. Here’s the bug in the pile, we ran the Turbo/Non-Turbo test probably 15 times in Atto and each time we got a performance decrease on the Barracuda XT when using Non-Turbo mode. So for all intents and purposes to get the optimal transfer rate on that board you need Turbo enabled, at least in this test.
We got tired of playing with ATTO and moved to CDM, in this shot we are running in SATA 3 mode with Turbo enabled, and we got pretty good results.
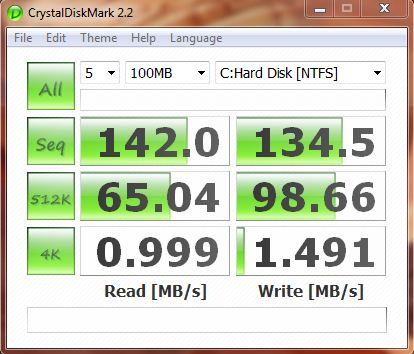
Then we hooked to the SATA 2 port and with the same drive got almost identical results as when the Barracuda XT was hooked to the SATA 3 port with Turbo Enabled. Sure there are minor speed differences but not enough to say the XT performed any better on SATA 3 than it did on SATA 3.
Then all this checking graphs and similar speeds on the SATA 3 port prompted a thought in our under caffeinated brains. HDTach graphs performance with a line graph so let’s screen shot that.
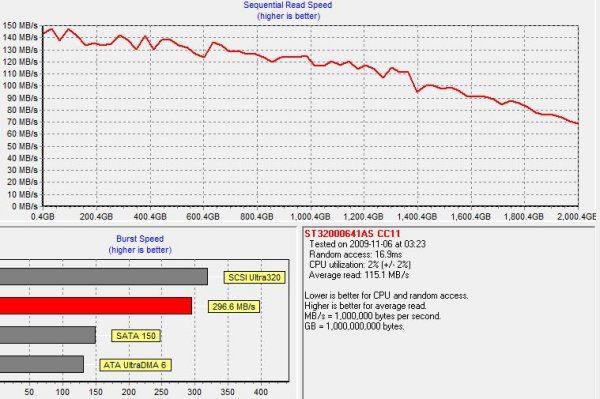
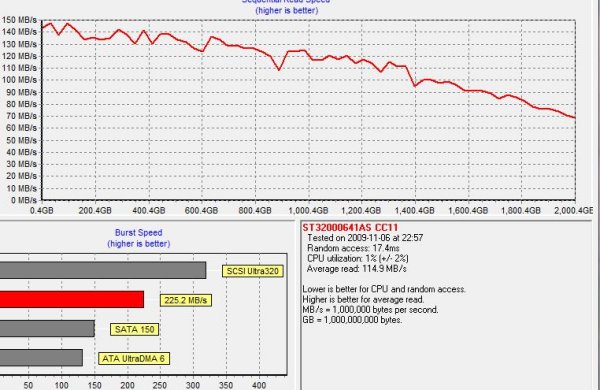
This shot above is on the SATA 3 port with Turbo enabled, and the shot below is on the SATA 2 port. The portion we are most interested in is the line graph. With the exception of the small valley on the screen shot below, that occurs between 800 4GB and 1,000 4GB (right below the word “Higher” in higher is better). As close as we can tell the line graph is identical with that one exception.
SATA 3 W/Turbo the burst rate was higher so if the data you were seeking was a cache only hit SATA 3 would be better in that instance. SATA 3 average read speed was 115.1MB/s and SATA 2 average read speed was 114.9MB/s and average read speed is where the money is at so to speak.
We don’t mention this to say anything bad about the Barracuda XT, not by any means but rather to show that Seagate has done an exceptional job optimizing the Barracuda XT for both SATA 3 and SATA 2. In some cases like ATTO the benchmark showed a preference for SATA 3, but in Vantage we saw almost no difference between SATA 2 and SATA 3 so if you want to pick up one of the SATA 3 drives and use it on your existing SATA 2 board in anticipation of a future upgrade your not going to get hurt by picking this SATA 3 implementation.
Everest Ultimate

“EVEREST Ultimate Edition is an industry leading system diagnostics and benchmarking solution for enthusiasts PC users, based on the award-winning EVEREST Technology. During system optimizations and tweaking it provides essential system and overclock information, advanced hardware monitoring and diagnostics capabilities to check the effects of the applied settings. CPU, FPU and memory benchmarks are available to measure the actual system performance and compare it to previous states or other systems. Furthermore, complete software, operating system and security information makes EVEREST Ultimate Edition a comprehensive system diagnostics tool that offers a total of 100 pages of information about your PC.”
CPU AES
This integer benchmark measures CPU performance using AES (a.k.a. Rijndael) data encryption. It utilizes Vincent Rijmen, Antoon Bosselaers and Paulo Barreto’s public domain C code in ECB mode.
CPU AES test uses only the basic x86 instructions, the test consumes 48 MB memory, and it is Hyper Threading, multi-processor (SMP) and multi-core (CMP) aware.
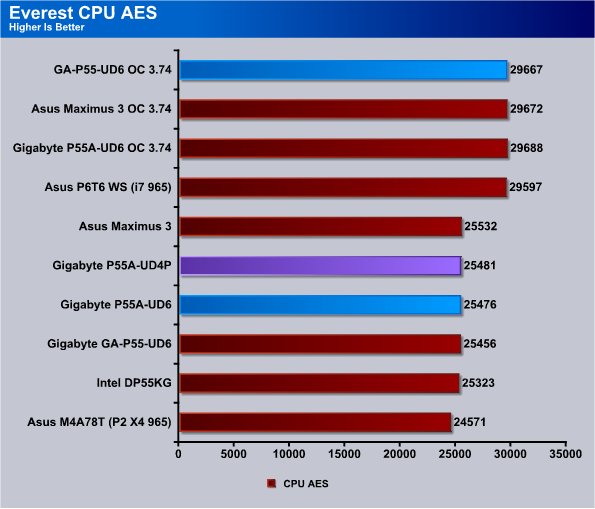
In the Everest CPU AES test we see the original P55A-UD6 slightly in the lead with a 29688 the difference between the overclocked boards is pretty minimal. Running stock speed the Maximus 3 came out ahead but the spread between the boards is less than 100 points and you’ll see very close scores between the top contenders all the way through the review. The difference between the UD4P and UD6 boards was almost non-existent in this test.
CPU PhotoWorxx
This integer benchmark performs different common tasks used during digital photo processing.
It performs the following tasks on a very large RGB image:
• Fill
• Flip
• Rotate90R (rotate 90 degrees CW)
• Rotate90L (rotate 90 degrees CCW)
• Random (fill the image with random colored pixels)
• RGB2BW (color to black & white conversion)
• Difference
• Crop
This benchmark stresses the integer arithmetic and multiplication execution units of the CPU and also the memory subsystem.
CPU PhotoWorxx test uses only the basic x86 instructions, and it is Hyper Threading, multi-processor (SMP) and multi-core (CMP) aware.
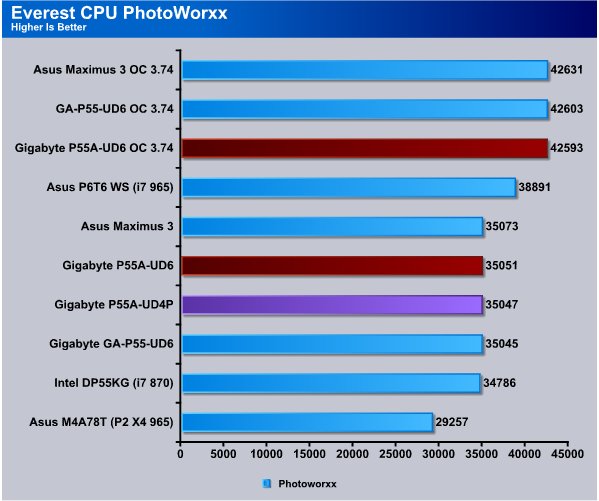
PhotoWorxx sees the Maximus, P55-UD6 and P55A-UD6 all scoring within a narrow range and so close together that the differences might be no more than minute changes in the benchmark runs. The P55 motherboards all use the same basic P55 chipset designed by Intel and so far performance across boards has been phenomenally close. From the Intel DP55KG up to the Maximus 3 we see less than 300 points differentiating boards.
CPU Queen
This simple integer benchmark focuses on the branch prediction capabilities and the misprediction penalties of the CPU. It finds the solutions for the classic “Queens problem” on a 10 by 10 sized chessboard.
CPU Queen test uses integer MMX, SSE2 and SSSE3 optimizations. It consumes less than 1 MB system memory and it is Hyper Threading, multi-processor (SMP) and multi-core (CMP) aware.
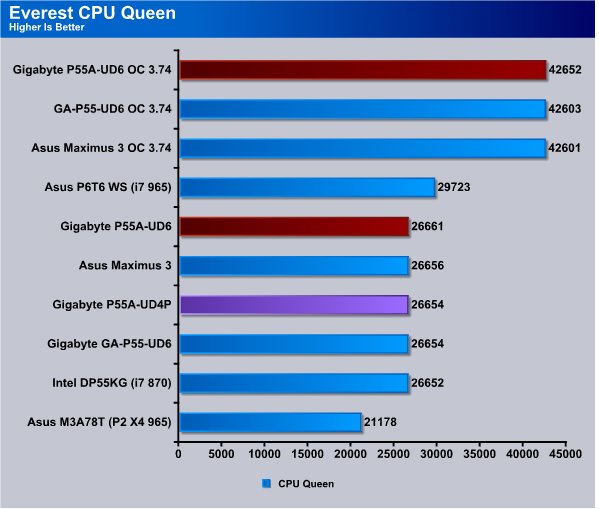
The CPU Queen test seemed to like the P55A-UD6 and it sneaks out in the front by a few points. Top to bottom the P55 boards only have a point spread of 19 points. Keeping the equipment on the boards as close as possible across a range of boards shows us just how vanilla performance has really become among same chipset boards.
CPU ZLib
This integer benchmark measures combined CPU and memory subsystem performance through the public ZLib compression library Version 1.2.3 (http://www.zlib.net).
CPU ZLib test uses only the basic x86 instructions, and it is Hyper Threading, multi-processor (SMP) and multi-core (CMP) aware.
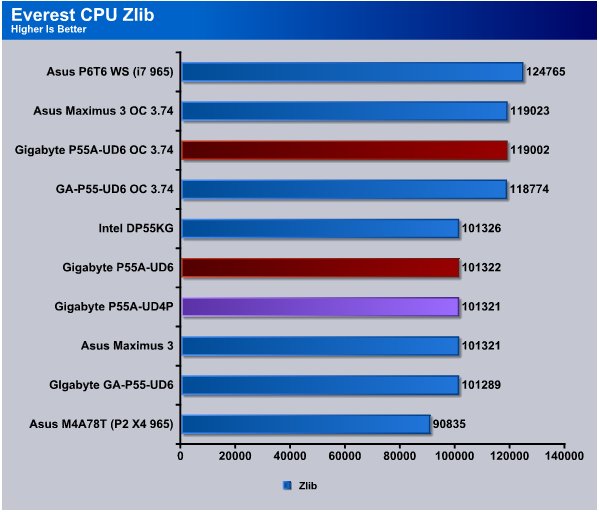
Here again in CPU ZLib the spread between boards is so minimal it would be a photo finish. More and more as boards homogenize it’s the features, ease of operation, ease of overclocking that set them apart. Motherboards have become almost like gasoline, all the brands well make the cars engine combustion, but some have additives that others don’t. In our case the additives are merely board features and stable, functional, easy to use BIOS setups.
Everest Memory
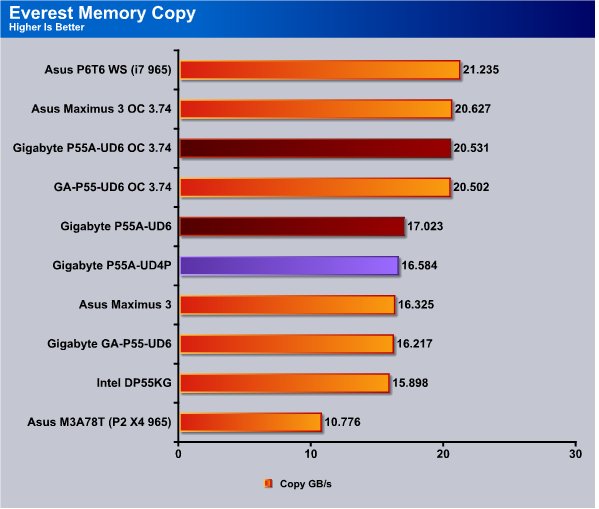
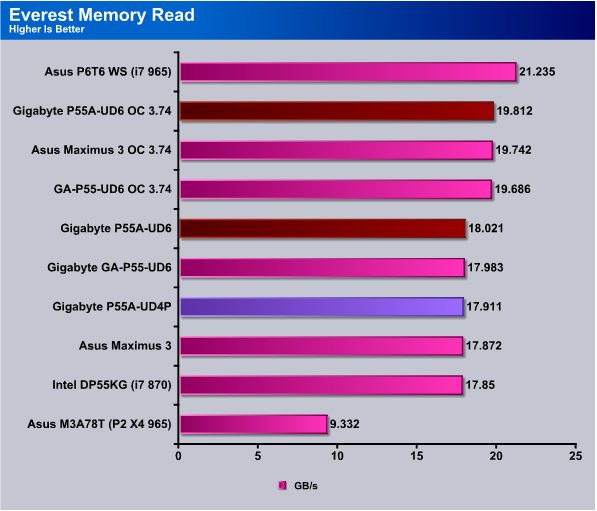
Memory testing is a little more hit and miss but among boards running the same chipsets given the same kit of ram, all things being equal we seldom see more than 400 – 600MB/s difference. That’s the case here, the Gigabyte P55A-UD6 barely tops 18GB/s and the low board (P55) on the chart hit’s 17.85GB/s. Overclocked we see the same thing but keep in mind we tune the boards to a razers sharpness to ensure they operate at peak efficiency during testing. A Sloppy tweak job will net you different results.

The Memory write test sees no relief in the desert like sameness of the performance we got from all the P55 chipset boards. While it makes it a little boring for us that’s really a good thing that shows just how far motherboard manufacturing has really come. When performance across the board is similar it shows that the boards are well built on a solid chipset.
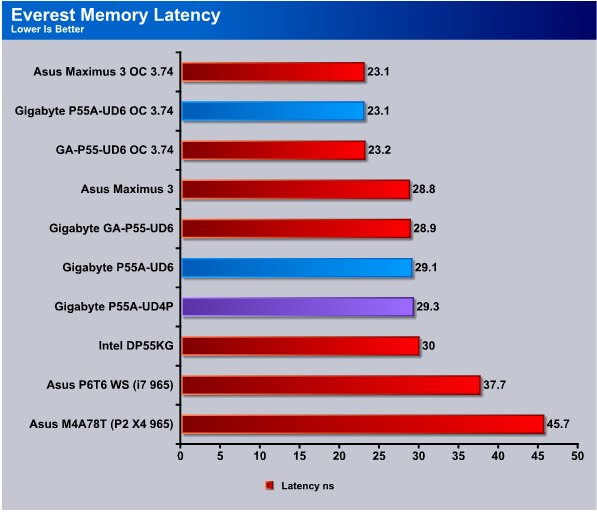
Memory Latency will vary kit to kit but we used the same 1600 MHz kit for all the P55 boards and we see that differences are measured in tenths of nano-seconds.
Cinebench

“CINEBENCH is a real-world test suite that assesses your computer’s performance capabilities. MAXON CINEBENCH is based on MAXON’s award-winning animation software, CINEMA 4D, which is used extensively by studios and production houses worldwide for 3D content creation. MAXON software has been used in blockbuster movies such as Spider-Man, Star Wars, The Chronicles of Narnia and many more. MAXON CINEBENCH runs several tests on your computer to measure the performance of the main processor and the graphics card under real world circumstances. The benchmark application makes use of up to 16 CPUs or CPU cores and is available for Windows (32-bit and 64-Bit) and Macintosh (PPC and Intel-based). The resulting values among different operating systems are 100% comparable and therefore very useful with regard to purchasing decision-making. It can also be used as a marketing tool for hardware vendors or simply to compare hardware among colleagues or friends.”
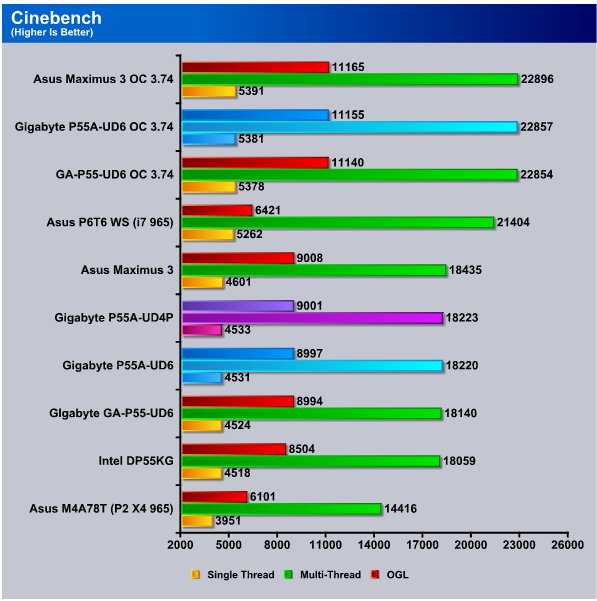
In Cinebench which is sensitive to hardware changes we see the Maximus 3 pulling out a few hundred points on the Multi-threaded test but again there’s a very narrow point spread top to bottom and it’s a trend you’ll likely continue to see with P55 boards.
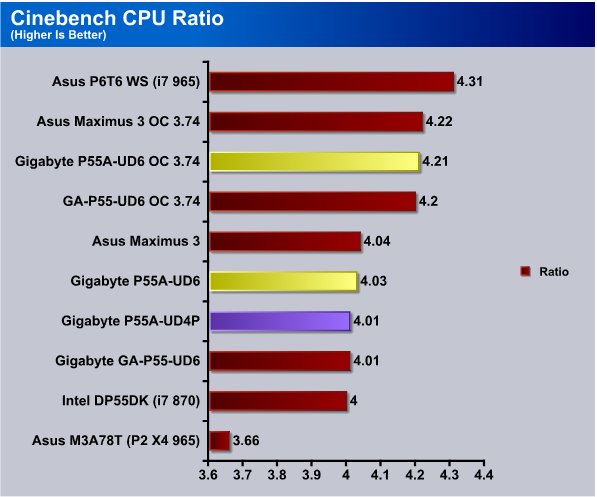
Even the CPU ratio on the P55 boards only varies by .04 from top to bottom on the chart and that might be one reason why the scores are all so homogeneous.
WinRar v. 3.71

This module in WinRar generates random data, which contains specially introduced redundancy, increasing the load to both the processor and memory. Data is then passed through RAR compression and decompression algorithms, and the output of the decompression algorithm is compared to the source data. If any differences are found, WinRar then reports “Errors found – Yes” in the command window. WinRar displays a size of processed data and compression speed, current and resulting, in kilobytes per second.
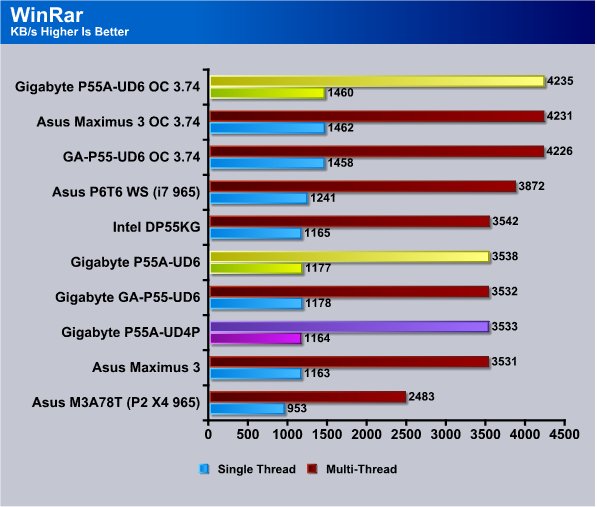
In Winrar we got a drastic difference between the spread of boards, top to bottom we got a whopping 11KB/s difference.
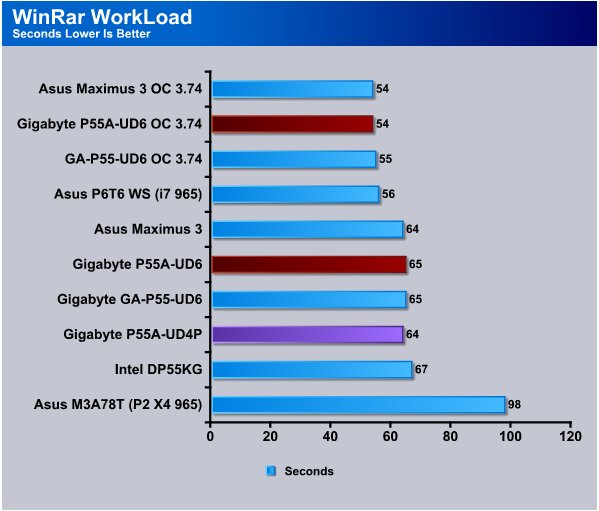
The Winrar Workload test doesn’t show us anything new, the slowest board the Intel DP55KG which uses liquid capacitors ran 2 seconds behind the pack and the rest of the P55 boards ran 54 – 55 seconds.
Sisoft Sandra
“SiSoftware Sandra (the System Analyser, Diagnostic and Reporting Assistant) is an information & diagnostic utility. It should provide most of the information (including undocumented) you need to know about your hardware, software and other devices whether hardware or software. It works along the lines of other Windows utilities, however it tries to go beyond them and show you more of what’s really going on. Giving the user the ability to draw comparisons at both a high and low-level. You can get information about the CPU, chipset, video adapter, ports, printers, sound card, memory, network, Windows internals, AGP, PCI, PCI-X, PCIe (PCI Express), database, USB, USB2, 1394/Firewire, etc.”
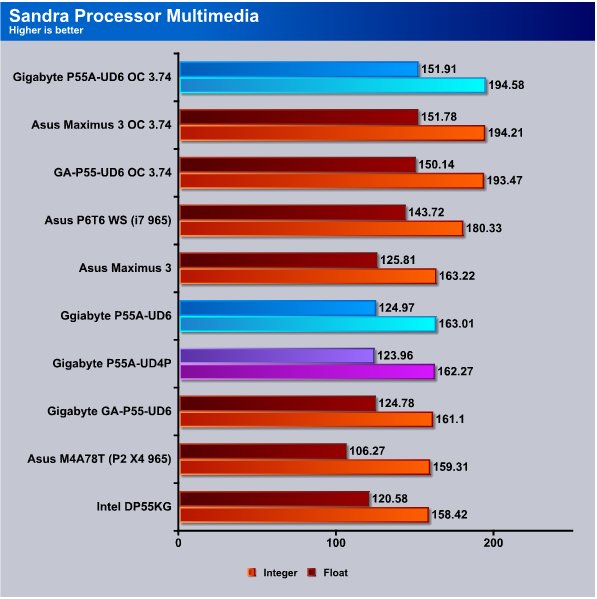
Sandra, like the other benchmark utilities, isn’t fooled by the different names silkscreened on the boards, it knows that under the silk screen their all brothers. Starting with the Intel DP55KG which came in at 158.42 the highest scoring board hit 163.22 so we have a point spread of under 5. Like we mentioned earlier the P55 boards selling points are going to be overall Quality construction and features.
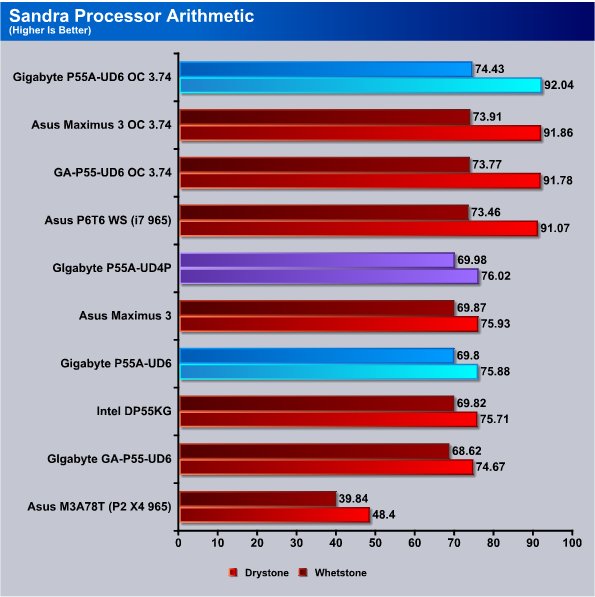
The Sandra Processor Arithmetic test shows us about the same result, lowest score to highest score about 2 points. We’re impressed with the P55 boards consistent performance but once in a while we’d like to see a real performance leader or a real turkey.
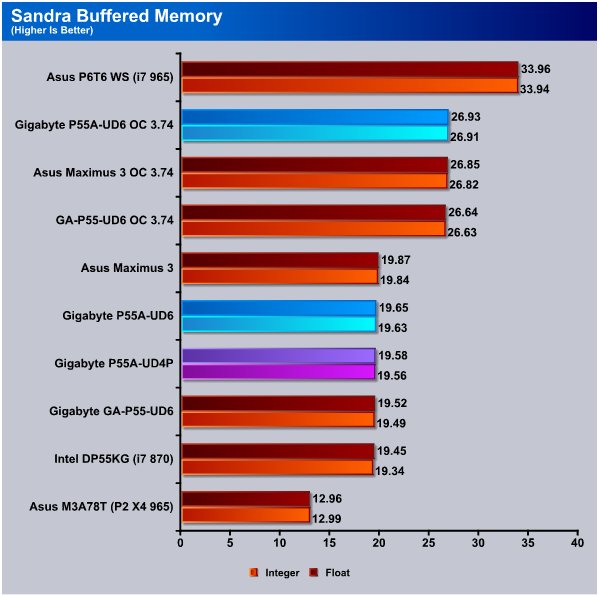
The Sandra Buffered Memory test shows the Gigabyte GA-P55A-UD6 hitting 19,65GB/s and all the boards topped 19GB/s. So overall we see nothing more than maybe a couple of hundred MB/s difference between any board.
POV-Ray 3.7 Beta 25

The Persistence of Vision Ray-Tracer was developed from DKBTrace 2.12 (written by David K. Buck and Aaron A. Collins) by a bunch of people (called the POV-Team) in their spare time. It is a high-quality, totally free tool for creating stunning three-dimensional graphics. It is available in official versions for Windows, Mac OS/Mac OS X and i86 Linux. The POV-Ray package includes detailed instructions on using the ray-tracer and creating scenes. Many stunning scenes are included with POV-Ray so you can start creating images immediately when you get the package. These scenes can be modified so you do not have to start from scratch. In addition to the pre-defined scenes, a large library of pre-defined shapes and materials is provided. You can include these shapes and materials in your own scenes by just including the library file name at the top of your scene file, and by using the shape or material name in your scene. Since this is free software feel free to download this version and try it out on your own.
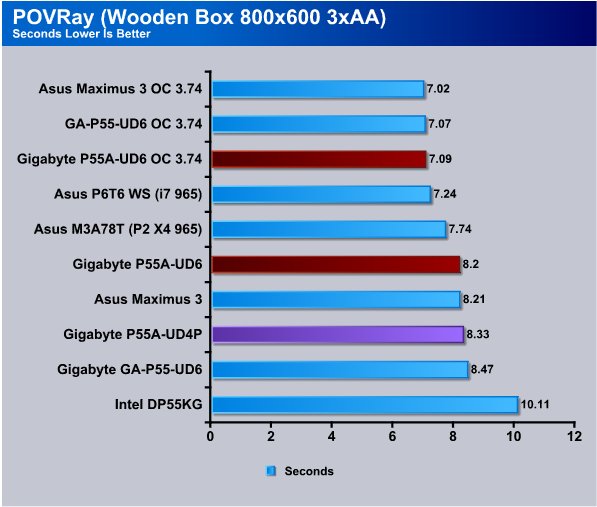
POVRay runs like greased lightning on the P55 chipset with our Intel I7 870 CPU and top to bottom we see differences of about 0.2 seconds. THe Gigabyte GA-P55A-UD6 tops the charts at stock speeds but only by 0.01 seconds.
Microsoft Excel 2007
Monte Carlo Black-Scholes Option Pricing Test
Microsoft Excel is the widely known and most used spreadsheet application for the manipulation and calculation for number crunching. With Excel you can analyze and share information on small scale or the largest scale you can imagine. We’ve seen spreadsheets in every day use that contain literally tens of thousands of numbers and hundreds of equations. Bjorn3D uses two tests in Excel to determine CPU and Motherboard performance.

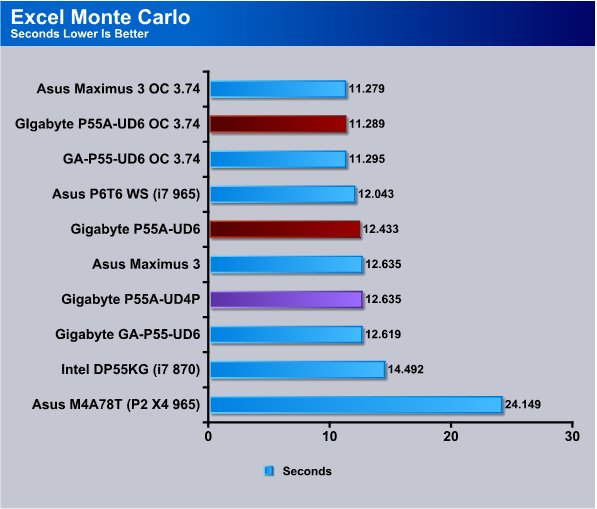
We did see a little difference between the boards in Excel. The Intel board which is the only board we'[ve seen with electrolytic capacitors came in about 2 seconds behind all the boards with solid capacitors. The Solid cap boards had just under 0.2 seconds difference between them.
Big Number Crunch
This workload is from a 6.2 MB spreadsheet and executes about 28,000 sets of calculations. It uses the most common calculations in Excel, addition, subtraction, division, rounding and Square Root. It also analyzes statistical functions such as Min, Max Median, and Average. The calculations are done after the spreadsheet with a large data set is updated with new values and must recalculate a large number of data points.
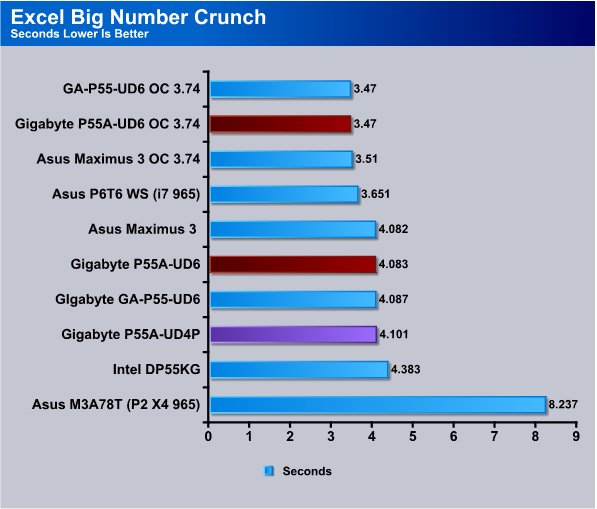
So far the differences we’ve seen between boards is much like looking out at a snow covered Kansas field. The only variation in the landscape we can see is a rabbits footprint and the homogeneous scores find us longing for the days when there were a variety of chipsets with real differences in performance. The differences here are in features and that’s what makes the Gigabyte GA-P55A-UD6 a real winner. The other boards all perform on about the same level but their USB 2.0 will never exceed 25 – 28MB/s and the USB 3.0 on the GA-P55A-UD6 will kill that speed every time. By the same token the SATA 2 on the other boards will never exceed 300MB/s, and yes we’ve had drive combination’s limited by that, while the SATA 3 interface can theoretically reach 600MB/s. Those are real and measurable differences and will make a difference in the boards final score.
Photodex ProShow Gold 3.2
ProShow Gold allows you to combine videos and photos and music to create slide shows, depending on the end user results can be spectacular. The application allows the end user to share photos and memories with friends in a unique and spectacular way, the different formats supported are, DVD, PC and Web. Still Photos are brought to life by adding motion effects. Supported effects include, Pan, Zoom, and rotate. You can also add captions and over 280 transition effects.

The workload we use consists of 29 high resolution images in JPG format and converts them to MPEG2 wide-screen DVD quality. The end result is a 3 minute 9 second video file in slide show format. The images are in 3872×2592 resolution and have a combined total size of about 170 MB.
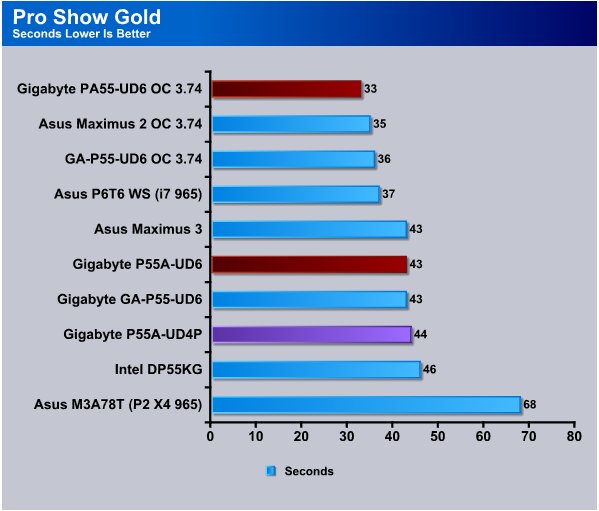
Pro Show Gold scores are given in seconds it takes to complete the assigned task. The Intel board comes in with 46 seconds, the P55-UD6, P55A-UD6 and Asus Maximus all come in at 43 seconds.
AutoMKV 0.95c
AutoMKV is an application aiming for easy media conversion between various media formats using various third party codecs. With improved internet speed and enhanced computing power, more users are interested in encoding to different media formats for their various multimedia needs. With AutoMKV and x264 codec, a freeware H.264 encoder, users can easily create media files. For more information and to obtain AutoMKV 0.95c and AviSynth* 2.5.7, please visit (http://forum.doom9.org/showthread.php?t=134478). We create a media file using AutoMKV and x264 codec. The input file used in the document is a raw 416 MB 720×480 DV file and the output is a 253MB H.264 media file.
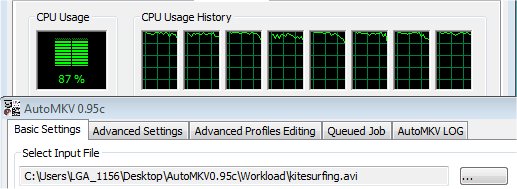
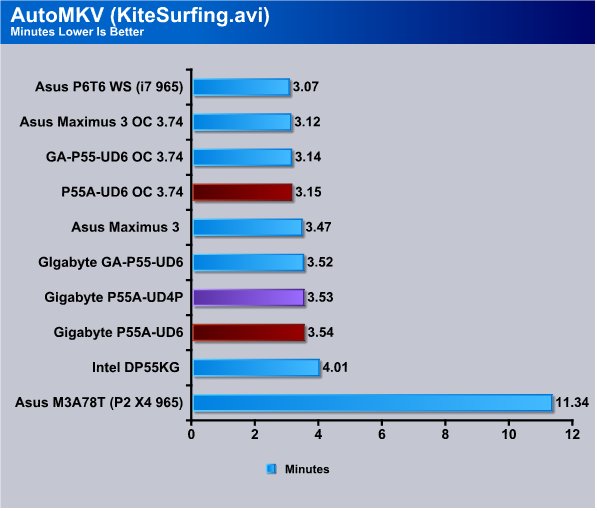
AutoMKV takes minutes to complete it’s operations on KiteSurfing.avi and even across those minutes on the solid Cap boards we see 0.07 minutes difference. The GA-P55A-UD6 hit 3.54 Minutes and again the scores are so close together it would be a photo finish if it were a horse race.
Blender
Blender is a free open source 3D content creation suite that is available for various operating systems. The application is popular among many independent animation studios and game makers. For more information, please visit http://www.blender.org/.
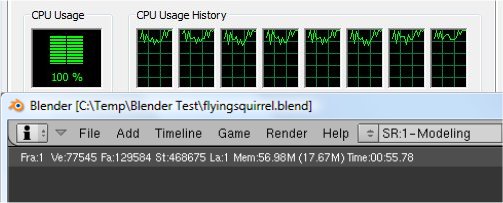
The workload consists of a ~6.9 MB character model of a flying squirrel. Due to time constraints we didn’t render the entire image which would be time consuming and rather pointless except to yield larger benchmark numbers. A portion of the image, the right arm is what we render. it’s a large enough portion to show differences in CPU performance, yet small enough that we don’t have to grind through a 45 minute Render waiting for a single result.
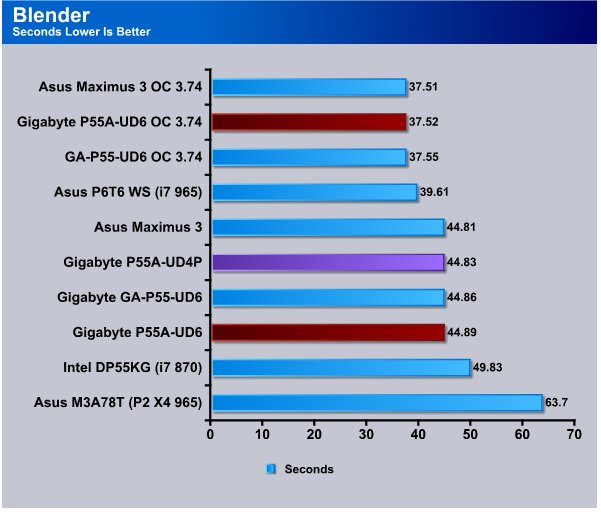
Blender isn’t going to give us any relief from the score sameness we’ve been seeing across every test. The Solid Cap boards all beat the Intel DP55KG board but then there’s less than 1 second separating all the P55 Boards.
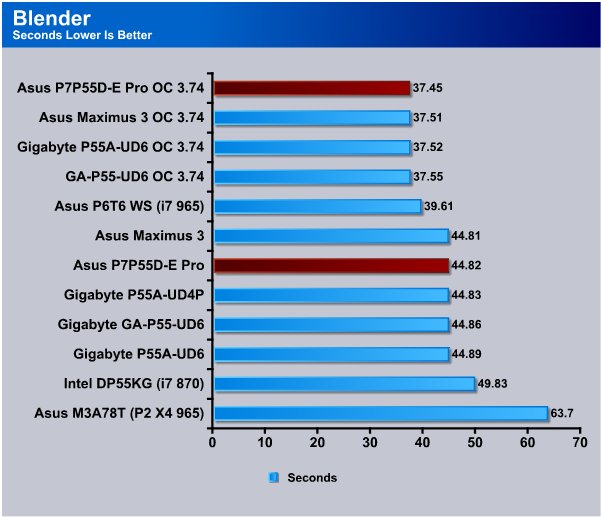
Blender is a little shorter test but it gives us a chance to look at the rendering capabilities of Board and CPU and the P7P55D-E Pro is no slouch here. It came in 0.01 seconds behind the Maximus 3 at stock speed and 0.06 seconds when overclocked.
CPU-Z
For the CPU-Z portion we have our usual 4 pane CPU-Z shot showing the whole system setup from Motherboard, to CPU and Memory Speed.
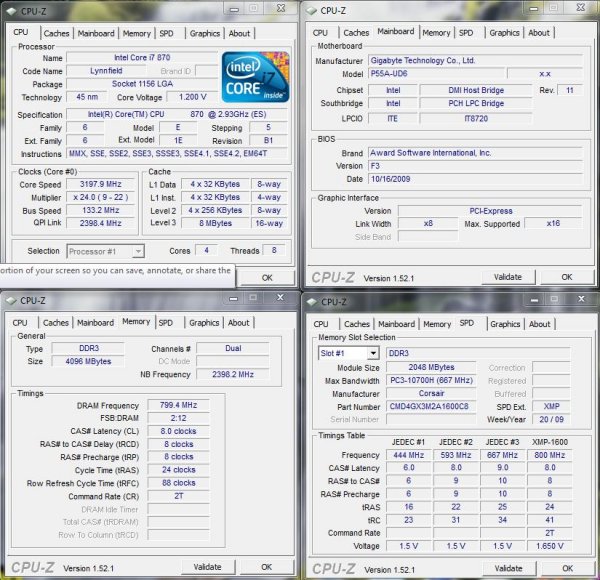
Here’s our stock shot of the Gigabyte P55A-UD6 with our I7 870 LGA 1156 CPU and the ram running at 1600MHz with Cas 8 timings. We’ve got faster ram kits but this about average speed for most end users. Now that Windows 7 is out when you move to the new operrating system you should be focusing on larger ram kits in the 8GB and 12GB range and less on smaller faster kits. We’ve seen nice performance boosts from going to a 8GB kit that runs at 1600MHz over faster kits in the 4GB range.
Overclocking
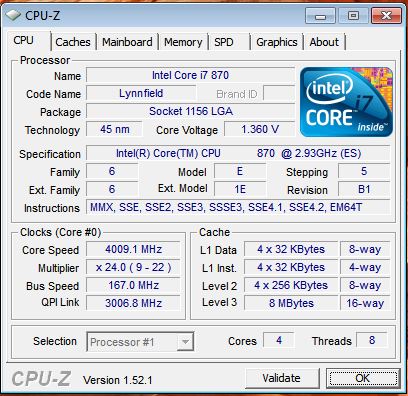
This isn’t the maximum OC we hit on the Gigabyte GA-P55A-UD6 with some tweaking your CPU is more of a limitation than than the board. We felt like 4GHz is enough to demonstrate the overclocking ability of the P55A-UD6 but we’ve hit 4.2GHz and higher since then, Please note that anything beyond 3.8(ish) on the best aircooling is rather insane.
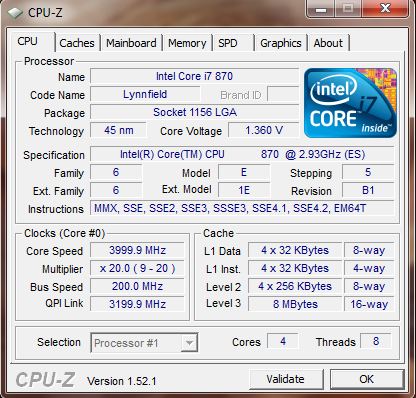
We started out searching for a good Bclk and easily hit 4GHz with a Bclk of 200 and it was an almost no-brainer overclock.
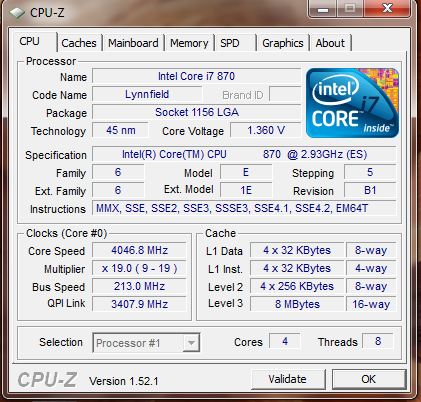
Once we hit 200Bclk we pushed it a little farther and got 213Bclk without much more effort but lets face it this is as much a limitation of th time we had to utilize as anything. We’ve gotten the board to 225Bclk and seen higher but as you go up in Bclk you’ll need to lower the CPU multiplier to reach stability. After 3.8ish on aircooling it’s all brag anyway. We would think 4.2(ish) on good watercooling.
P55A-UD6 & USB 3.0
We actually did the whole benchmarking thing on the Gigabyte GA-P55A-UD6 then a Buffalo USB 3.0 External hard drive showed up courtesy of Gigabyte. The simple fact that Gigabyte cared enough to send a USB 3.0 External drive to be tested with their USB 3.0 capable boards should tell you that they have a great amount of faith in their USB 3.0 interface solution. Currently USB 3.0 devices are scarce and this is the only one we’ve seen commercially available right now and the box itself is in an Asian language so we suspect that it’s not even available Stateside. We expect USB 3.0 to be all the rage at CES (that and the CES Booth Girls). We don’t know if it’s going to happen but with the early success and fantastic speeds we have gotten from the Buffalo External Drive it wouldn’t surprise us if USB 3.0 mainstreamed very quickly. It took a while for USB 1 and when we first saw UBS 1 it was back in the Pentium socket 478 days when motherboards had 2 ports and you needed a driver to make USB work on Windows 98. That was about the time that mysterious white expansion ports appeared (PCI) and we knew that we were seeing the early evolution of computing going from it’s infancy to early childhood. Now you can find USB 2.0 ports on DVR’s, home appliances, and a wide variety of hand held devices. USB 3.0 is just a much needed evolution of the now trusted interface.
We would expect USB (And SATA 3) expansion cards start to appear early after CES with prices in the “To Expensive” range with prices dropping dramatically the first 12 months. These are off the hip numbers so we are sure to hear from a few readers, almost all motherboards currently in use are USB 2.0, we would hazard a guess that more than 99% of all boards in use are USB 2.0. People are more likely to adopt a USB 3.0 Expansion card at first to use faster devices then when they eventually upgrade look for a board with USB 3.0 native to the board.
We’ve heard some uninformed criticism of the Gigabyte implementation of SATA 3 and USB 3.0 on the P55 platform. Ranging from “At least it has SATA 3 and USB 3.0 onboard”, to “Oh my god the first PCI-E slot drops to 8x from 16x if you use SATA 3 or USB 3.0 Turbo”. Mostly we hear it from people that have never benched a top end GPU at 16x and 8x to see the difference. To that end we’ve tested SATA 3 extensively in Turbo and Non-Turbo. We’ve also extensively tested USB 3.0 in Turbo and Non-Turbo. There’s little to no difference running the devices we’ve had hands on in Turbo or Non-Turbo. Current devices don’t saturate the bandwidth offered in non-Turbo mode. There might be a case or two where high end SATA 3 SSD’s (Not available at this time) saturate non-Turbo SATA 3. Look at it this way though; when you stick that USB or SATA 3 expansion card into the motherboard where do you think the bandwidth for that expansion card is coming from? The same PCI-E bus your running your GPU on. Since all the P55 solutions we’ve seen use 16x when a single PCI-E 16x slot is used and move to 8x8x when two cards are in use on P55 it doesn’t matter if you use SATA 3 or USB 3.0 Turbo or use an expansion card the effect is the same. Except the Gigabyte boards offer you the option to turn Turbo off and have full 16x bandwidth. As we’ve stated, in testing, we haven seen much difference at all in devices running in Turbo or non-Turbo so if your a performance monitoring enthusiast on P55 the Gigabyte P55A is probably the better choice.
Now that we’ve cleared our minds from the “Oh my gosh I’m losing PCI-E bandwidth” rant lets look at some screenshots of the USB 3.0 testing we did.
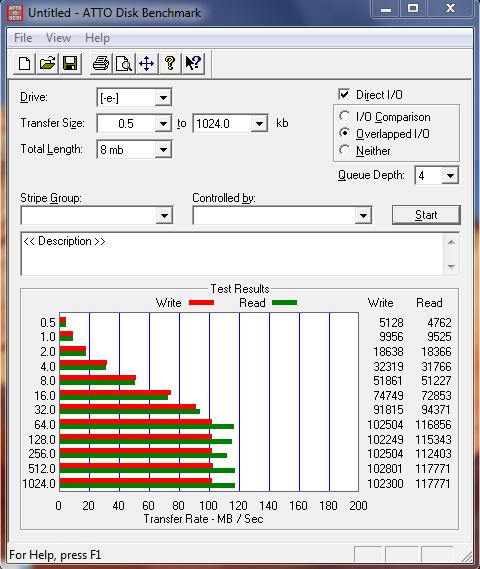
We’ve benched plenty of USB 2.0 external enclosures and Thumb drives, they tend to run in the 25MB/s range with top end devices possibly hitting 28 – 30MB/s. The new USB 3.0 external drive we have on hand topped that when it hit the 4Kb test and thee it was already at 32MB/s write and 31MB/s read. The speed continued to increase until the USB 3.0 external drive hit 64Kb/s and it leveled out there at 102MB/s write, the read speeds ranged a little from 112MB/s to 117MB/s. What we are seeing is a more than 4x performance increase over traditional USB 2.0 devices. There’s plenty of bandwidth left on USB 3.0 even with the external drive running flat out. Even if USB 3.0 only runs at half the theoretical speed the standard is set for it would take about 300MB/s to saturate (half) the bandwidth. Now imagine a top end SSD in an external USB 3.0 device, or Raidable platter drive USB 3.0 solutions. Boggles the mind doesn’t it. Internal HD speeds running externally. With speeds like this you could effectively run the OS from an External drive.
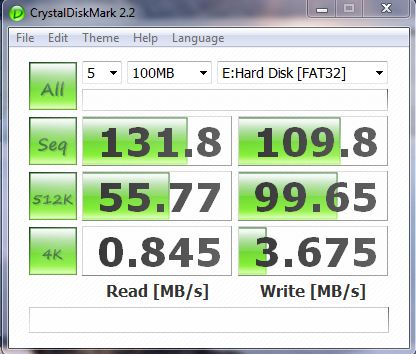
In Crystal DiskMark the Sequential read was fantastic at 131MB/s and the write hit 109.8MB/s so transferring large Blu-Ray or DVD files to external devices is going to be much faster. When the Buffalo external drive hit 512k testing the read slowed down to 55.77MB/s but the write speed barely skipped a beat and hit 99.65MB/s. Smaller writes in the 4k range show typical platter drive (internal platter drive) speeds. In other words little to no disadvantage running a HD from a USB 3.0 device. Backups of hard drives and cloning hard drives to external USB 3.0 devices will reach unheard of speeds.
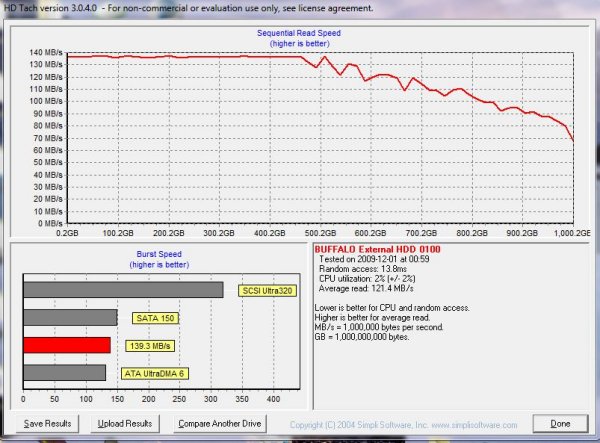
HDTach we went with the Seagate Barracuda SATA 3 drive attached and the USB 3.0 external device both running. The Barracuda drive was used as the primary boot drive but wasn’t doing anything more than running the OS and it had no extra bandwidth intensive tasks running. The drive was set to non-Turbo and USB 3.0 was set to non-Turbo. So this would represent a good test for those afraid that moving from 16x on their expensive GPU to 8x was going to hurt their gaming performance (it doesn’t but there’s no convincing some people). Burst speed we see 139.3MB/s and average speed we see 121.4MB/s and like we said not much difference between turbo on the other tests and non-Turbo in this test. It might help if you think about the Turbo setting as extra insurance against faster drives that aren’t likely to exist (except SSD’s in RAID0) for some time to come. Face it platter drives have hit a point where they are working on density but more dense platter drives are still a drawing board dream, increasing platter speed from 7200RPM to 10K RPM gets you a much more expensive drive with (at best) marginal gains in speed but nicer access times (which run in the 9 – 14ms range anyway). So unless your spending mega bucks on SSD raid configurations (in which case the GA-X58A-UD7 and LGA 1366 i7 platform is probably a better solution) non-Turbo is going to work great. If you insist on running a couple of high end USB 3.0 drives simultaneously (why you would is beyond us) then there might be a case where USB 3.0 Turbo would be needed.
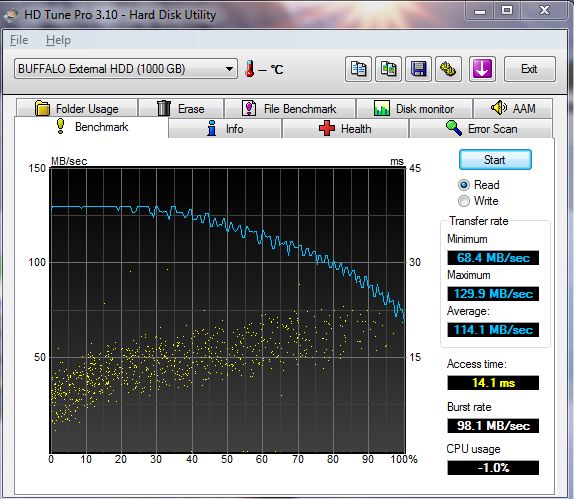
In this test we are still running the Barracuda SATA 3 drive in non-Turbo and the USB 3.0 Drive in non-Turbo and we get 68.4MB/s minimum, 129.9MB/s Maximum, and 114.1MB/s average. That’s far better than any USB 2.0 Device we’ve ever seen and we are thoroughly impressed with the USB 3.0 speed on the Gigabyte GA-P55A-UD6. Now we hear the wheels turning in some readers heads so we went ahead and ran this test again in USB 3 Turbo.
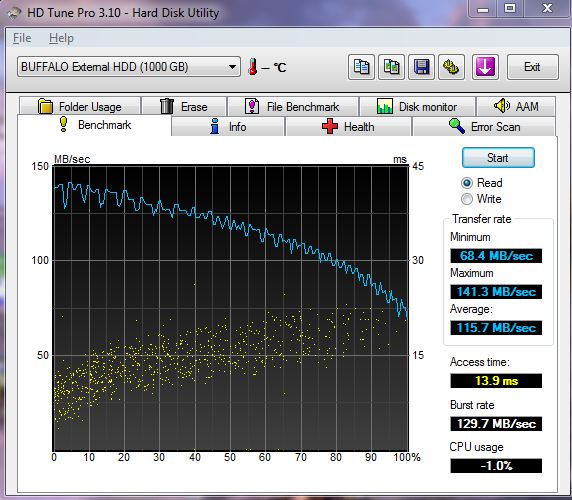
Notice in Turbo the minimum speed is exactly the same. Maximum speed was higher but Maximum speeds happen at the very beginning of the drives platter and start dropping pretty quickly after getting past the first 20% of the platter. Average speed overall 1.6MB/s faster than non-Turbo which fully supports our saying “There’s not much difference between Turbo and non-Turbo given the limitations of current drive technology.
That’s pretty much all the time we had for USB 3.0 testing because we held this review 4 additional days waiting on the USB 3.0 external drive to arrive. We are impressed with USB 3.0 far more than we are with what we’ve seen with SATA 3 so far. We say so far because we know SATA 3 SSD’s are right around the corner so we are hedging our bets at this point. SATA 2 SSD’s are still far to expensive for most end users tastes, SATA 3 SSD’s are likely to be viewed as an upgrade from SATA 2 SSD’s and command an even more premium price so they don’t figure into most end users plans YET.
In all we like USB 3.0 a lot. We like SATA 3 but we like it for it’s potential right now than it’s actual performance. USB 3.0 we see dramatic performance gains right now. Finally we can back up our benchmark drives to external sources without having to wait hours before we bench.
CONCLUSION
Well 22 pages later, 3 complete reviews (Motherboard, Seagate Barracuda XT, and Buffalo USB 3.0 Drive enclosure) and several weeks later we like the Gigabyte P55A-UD6 motherboard a lot. It features 24 Phase power, SATA 3, USB 3.0 and is a really easy overclocker.
We aren’t seeing much speed increase from the new SATA 3 drives but SATA 3 SSD’s will hit the market soon and with those blazing speeds SATA 3 will be a welcome addition to the test rigs. Gigabyte has an X58 variant out with SATA 3 and USB 3.0 and the X58A-UD7 is beckoning us from the review parts storage shelf so you’ll be seeing it reviewed soon. Well as soon as we recover from this review. The shrinks say that could be as soon as 3 months (Joke).
We loved the USB 3.0 capabilities of the board and if we hadn’t waited on a USB 3.0 drive to test with our conclusion about the GA-P55A-UD6 might have been different. With speeds ranging from 112 – 140MB/s USB 3.0 is a major advantage. USB 2.0 devices have served us well over the years, and E-Sata never really took off like USB did. USB 3.0 when it mainstreams could easily be the death of E-Sata. RIP E-Sata is all we can say, while we have E-Sata Devices around the ease of setup and speed of USB 3.0 just about kills any use we had for E-Sata.
The downside of the P55A-UD6 is that if you use SATA 3 or USB 3.0 Turbo you will be limited to a Single GPU running at 8x. Single GPU users you should know that the PCI-E bandwidth offered by 8x isn’t going to affect your GPU performance in the least. Multi-GPU users well that’s why we wrote the design and decision page. Gigabyte has implemented the SATA 3 and USB 3.0 interfaces P55 platform wide and made it easily and inexpensively available earlier in the game than any previous evolution of new interfaces we’ve ever seen. We are not going to knock the implementation because it’s more a limitation of the P55 chipset designed by Intel than anything. Gigabyte found a reasonable solution to a hard interface implementation and offers it from $130 to $240 platform wide. That’s almost unheard of and if it helps mainstream SATA 3 and USB 3.0 we are all for it. If you happen to have $1500 worth of GPU’s in your rig you might want to consider using another solution like the Gigabyte GA-X58A-UD7 which doesn’t have bandwidth limitations on the PCI-E slots. However the other 95% of end users with a single GPU looking for high end features without high end prices, sitting on the P55 platform, this is a more than reasonable solution. That’s just the way we feel about it. Intel set the limitation of the P55 chipset and the vendors have to find ways to get us the features we want, Gigabyte did just that.
Performance wise we tested the heck out of the Gigabyte GA-P55A-UD6 and the performance was as high as the GA-P55-UD6 and GA-P55A-UD4P and rivals any board we’ve had our hands on. With motherboards all sporting the same basic chipset performance is going to be a neck and neck thing. Features are waht differentiate boards now. On top the great performance we got from the Gigabyte P55A-UD6 the features are top notch. SATA 3 will grow to maturity and boards without SATA 3 will be yesterdays news, boards without USB 3.0 will feel crippled, the Gigabyte GA-P55A-UD6 won’t have any of those growing pains and we expect that most end users would enjoy both the overclocking and new interfaces knowing that their future technology needs are covered for the next few years.
| OUR VERDICT: Gigabyte GA-P55A-UD6 |
||||||||||||||||||
|
||||||||||||||||||
|
Summary: The Gigabyte GA-P55A-UD6 has a lot of features packed on it. Given the limitation of the Intel P55 chipset Gigabyte has done an outstanding job of implementing USB 3.0 and SATA 3 and not breaking the bank. Performance was very high, the board was easy to work with and a dream to overclock. The technology implimented on the board is very forward looking and any measure of futureproofing is a big plus. |