I thought it might be fun to do a short addition to the first review as since writing it I have made some rather significant upgrades to my test rig and also added a second XFX 8800 GTX running in SLI. Now that I have your attention, just a few words on what to expect. First, this addendum will only contain the outline for testing the SLI configuration and the test results as anything more would be a rewrite of the article I’ve already published.
INTRODUCTION
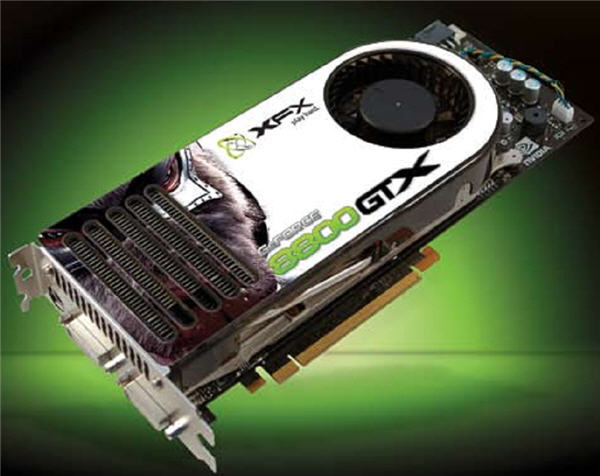
Just over three weeks ago Bjorn3d released an unprecedented four reviews and one fact filled article that covered the launch of the new NVIDIA 8800 series of graphics cards in its entirety. In our coverage we reviewed three (3) 8800 GTX graphic cards and one (1) 8800 GTS card. I reviewed the XFX 8800 GTX which was one of the most impressive graphics cards that I have ever had the pleasure to review, so much so that it received one of the very few perfect scores I’ve ever given a product. I know its old news! Where am I headed?
Let’s cut to the chase, as those of you that have read my reviews know is my style: I thought it might be fun to do a short addition to the first review as since writing it I have made some rather significant upgrades to my test rig and also added a second XFX 8800 GTX running in SLI. Now that I have your attention, just a few words on what to expect. First, this addendum will only contain the outline for testing the SLI configuration and the test results as anything more would be a rewrite of the article I’ve already published.
TESTING
Test System
|
Test Platform |
|
|
Processor |
Intel E6700 Core 2 Duo |
|
Motherboard |
EVGA NVIDIA 680I Motherboard |
|
Memory |
4 – 1GB sticks of Corsair DDR-2 Dominator 9136 |
|
Drive(s) |
4 – Seagate 7200.10 320GB SATA drives in RAID 0+1 |
|
Optical Drive(s) |
LiteOn Dual Layer 16X DVD-RW with Light Scribe |
|
Graphics |
2 – XFX 8800GTX running in SLI configuration |
|
Power Supply |
PC Power and Cooling 1KW-SR, 1 KW Power Supply |
|
Case |
Lian-LI V2000 Case |
|
Input Devices |
Logitech Gaming Keyboard |
|
Operating System |
Windows XP Pro SP2 |
| Synthetic Benchmarks & Games | |
|
3Dmark06
|
Default |
|
FEAR 1.08
|
Everything maxed out Soft shadows off, 4xAA, 8xAF, 1920 x 1200 |
|
Company of Heroes 1.03
|
Everything maxed out, 4xAA, 8xAF, 1920 x 1200 |
|
Counter-Strike: Source VST
|
Everything maxed out, 4xAA, 8xAF, 1920 x 1200 |
|
Half-Life 2
|
Everything maxed out, 4xAA, 8xAF, 1920 x 1200 |
TESTING
Test Methodology
We will be testing the XFX 8800 GTX which is by far “King of the Hill” when it comes to single GPU graphics solutions in both single configuration and also running in SLI. We will run the above captioned benchmarks on both systems with each GPU/VPU set at default speed. Our synthetic benchmark 3DMark06 will be run in default mode with both set at a resolution of 1280 x 1024. All other gaming tests will be run at 1920 x 1200 resolutions with Anti-Aliasing set to 4X and Anisotropic Filtering set to 8X. Each of the tests will be run individually and in succession three times and an average of the three results calculated and reported. F.E.A.R. benchmarks were also run with soft shadows disabled.
TEST RESULTS
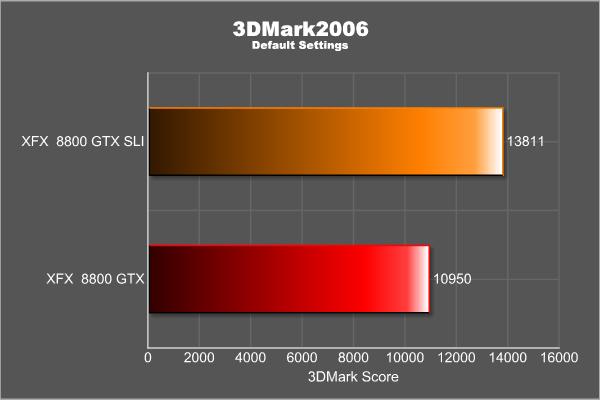
3DMark06
3DMark06 developed by Futuremark is a synthetic benchmark used for universal testing of all graphics solutions. 3DMark06 features HDR rendering, complex HDR post processing, dynamic soft shadows for all objects, water shader with HDR refraction, HDR reflection, depth fog and Gerstner wave functions, realistic sky model with cloud blending, and approximately 5.4 million triangles and 8.8 million vertices; to name just a few. The measurement unit “3DMark” is intended to give a normalized mean for comparing different GPU/VPUs. It has been accepted as both a standard and a mandatory benchmark throughout the gaming world for measuring performance.
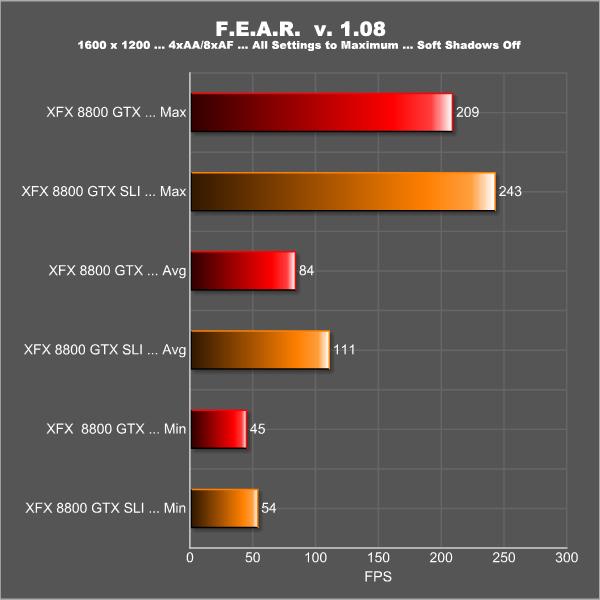
F.E.A.R
F.E.A.R. (First Encounter Assault Recon) is a first-person shooter game developed by Monolith Productions and released in October, 2005 for Windows. F.E.A.R. is one of the most resource intensive games in the FPS genre of games ever to be released. The game contains an integrated performance test that can be run to determine your system’s performance based on the graphical options you have chosen. The beauty of the performance test is that it gives maximum, average, and minimum frames per second rates and also the percentage of each of those categorical rates your system performed. F.E.A.R. rocks both as a game and as a benchmark!
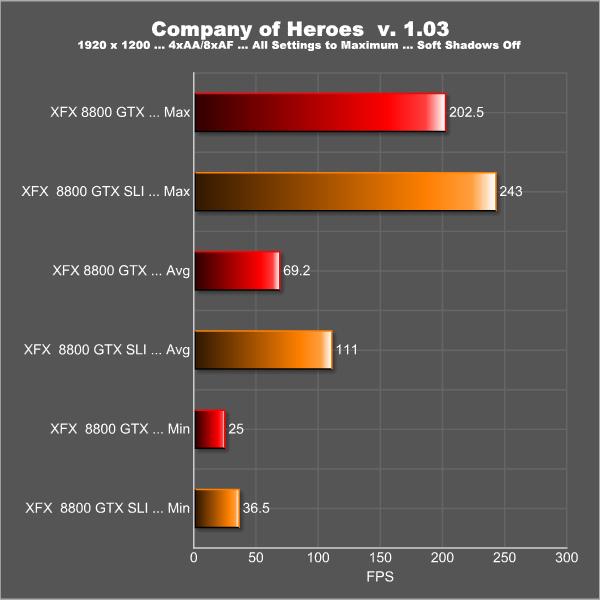
Company of Heroes
Company of Heroes(COH) is a Real Time Strategy(RTS) game for the PC, announced on April, 2005. It is developed by the Canadian based company, Relic Entertainment, and published by THQ. We gladly changed from the first-person shooter based genres of the rest of our gaming benchmarks to this game which is RTS. Why? COH is an excellent game that is incredibly demanding on system resources thus making it an excellent benchmark. Like F.E.A.R. the game contains an integrated performance test that can be run to determine your system’s performance based on the graphical options you have chosen. It uses the same multi-staged performance ratings as does the F.E.A.R. test. We salute you Relic Entertainment!
TEST RESULTS
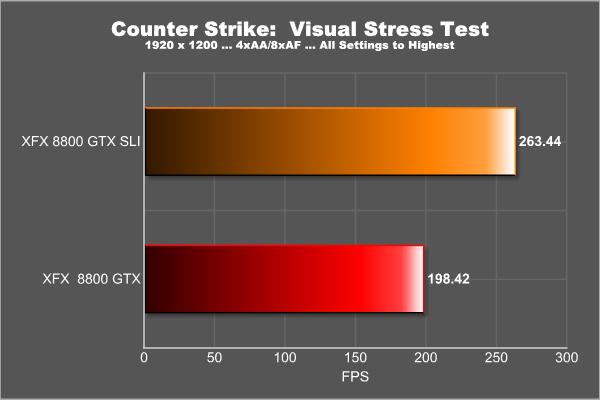
Counter-Strike: Source VST
In August 2004, a beta version of Counter-Strike based on the new Source game engine became available. Counter-Strike: Source, was essentially an updated version of the extremely popular online shooter game, but with the addition of the same engine as Half-Life 2. It has gone through many revisions since it’s releases and still to this day remains very popular with the team oriented FPS gamers. It is essential to remember that Counter-Strike: Source VST is not a benchmark of either Counter-Strike or Half Life, it’s simply a synthetic benchmark using the Half-Life 2 engine incorporated into CSS. We feel it’s quite good and that’s why we continue to use it.
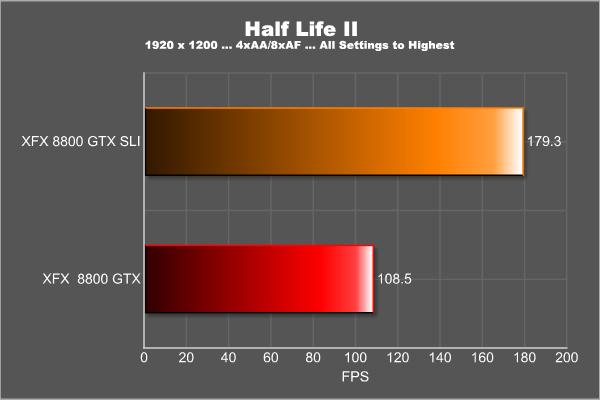
Half-Life 2
Half-Life 2 certainly needs no real introduction as it’s on of the top three FPS games of all time. We use HOC’s automated benchmarking software to simplify and standardize this test.
CONCLUSION
As previously stated this is nothing more than a short addendum to my previous XFX 8800 GTX Review. Our intent was to share with you the additional power that these cards can generate when run in SLI configuration. We saw improvements in the testing ranging from just over 30% to just under 60% depending on the benchmark we used. While we would have like to have seen performance closer to a 100% increase we know that’s not realistic, and feel the benchmarks generated were a fair representation of what you can expect running the 8800 GTX in SLI.
There will be no scores with this addendum as that was done in my original review and nothing that I’ve seen or done with this graphics card has made me want to change what I’ve already published. If anything it’s made me more certain that the current 8800 series of graphics cards in general and the XFX 8800 GTX in specific are the closest thing(s) to perfection in the way of a graphics solution available today! Now take the NVIDIA 680I system board and a pair of 8800GTX’s and you have the ultimate gaming platform without doubt.


