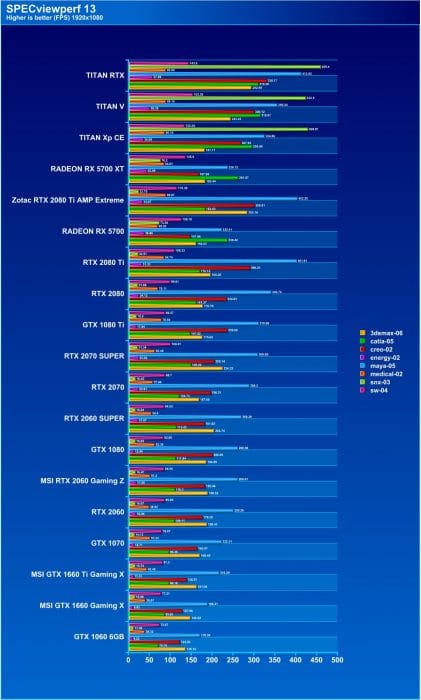
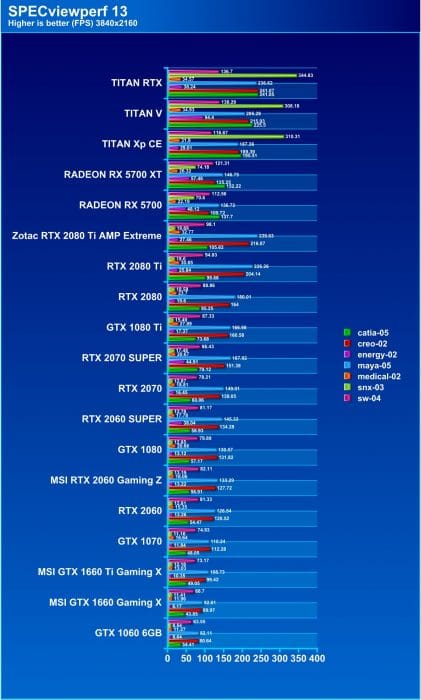
SPEC makes this benchmark to allow professionals to benchmark combinations of components so you can learn how well a specific component will work for a professional deployment. The following description is for each of the tests and is pulled directly from their page to avoid any issues or misunderstandings. These benchmarks are GPU targeted to see how your Graphics accelerator can render heavy professional workflows.
3ds Max viewset (3dsmax-06)
The 3dsmax-06 viewset was created from traces of the graphics workload generated by 3ds Max 2016 using the default Nitrous DX11 driver.
The models for this viewset came from the SPECapc for 3ds Max 2015 benchmark and other sources. In order to best approximate real-world use cases, several tests incorporate multiple viewsets on screen, each using a different rendering method. The styles of rendering in the viewset reflect those most commonly used in major markets, including realistic, shaded and wireframe. Some lesser-used but interesting rendering modes such as facets, graphite and clay are also incorporated. The animations in the viewset are a combination of model spin and camera fly-through, depending on the model.
Note: 3DStudioMax does not support 2160p so you will notice it is absent from the 4K results.
CATIA viewset (catia-05)
The catia-05 viewset was created from traces of the graphics workload generated by the CATIA V6 R2012 application from Dassault Systemes. Model sizes range from 5.1 to 21 million vertices.
The viewset includes numerous rendering modes supported by the application, including wireframe, anti-aliasing, shaded, shaded with edges, depth of field, and ambient occlusion.
Creo viewset (creo-02)
The creo-02 viewset was created from traces of the graphics workload generated by the Creo 3™ and Creo 4™ applications from PTC. Model sizes range from 20 to 48 million vertices.
The viewsets include numerous rendering modes supported by the application. Order-independent transparency is enabled for all models with transparent components.
Energy viewset (energy-02)
The energy-02 viewset is based on rendering techniques used by the open-source OpendTect seismic visualization application. Similar to medical imaging such as MRI or CT, geophysical surveys generate image slices through the subsurface that are built into a 3D grid. Volume rendering provides a 2D projection of this 3D volumetric grid for further analysis and interpretation.
At every frame, the bounding cube faces of the volume are tessellated and rendered with a fragment shader that performance a ray-cast from the eye position through the volume, accumulating transparent lit, color-mapped values until either the pixel becomes fully opaque or the volume is exited.
The voxel in the 3D grid is a single scalar value. A transfer function — simply a 1D lookup table — maps the 3D density value to color and alpha values. For lighting calculations, the gradients are computed on the fly using the central differences at each voxel. These state changes exercise various parts of the graphics subsystem. This viewset makes use of hardware support for 3D textures and therefore trilinear interpolation.
In addition to the volume rendering, the test includes both inline and crossline planes (slices in the X and Y planes). Also, for some subtests, “horizons” are present – these are geological strata boundaries of interest, generated by exploration geophysicists, and are rendered using textured triangle strips.
The 3D datasets used in this viewset are real-world seismic datasets found at https://wiki.seg.org/wiki/Open_data . They were translated from their native SEG-Y format and compressed using JPEG-2000.
Maya viewset (maya-05)
The maya-05 viewset was created from traces of the graphics workload generated by the Maya 2017 application from Autodesk.
The viewset includes numerous rendering modes supported by the application, including shaded mode, ambient occlusion, multi-sample antialiasing, and transparency. All tests are rendered using Viewport 2.0.
Medical viewset (medical-02)
The medical-02 viewset uses the Tuvok rendering core of the ImageVis3D (http://www.sci.utah.edu/software/imagevis3d.html) volume visualization program. It renders a 2D projection of a 3D volumetric grid. A typical 3D grid in this viewset is a group of 3D slices acquired by a scanner (such as CT or MRI).
Two rendering modes are represented – slice-based rendering and ray-casting.
For slice-based rendering, a series of coplanar slices aligned with the current viewing angle are computed on the CPU and then sent to the graphics hardware for texturing and further calculations, such as transfer function lookup, lighting and clipping to reveal internal structures. Finally, the slices are blended together before the image is displayed.
For ray-casting, rays are cast through the volume, accumulating transparently lit, colored pixels until full opacity or the bounds of the volume are reached.
For both slice-based and ray-cast rendering, the volumes are potentially subdivided into 512x512x512 3D volumes. This technique is known as “bricking” and typically results in better rendering performance on a wider range of GPU hardware.
The voxel in the 3D grid is a single scalar value. A transfer function — either a 1D or a 2D lookup table — maps the 3D density value to color and alpha values. For 2D tables, the second axis is defined as the magnitude of the gradient at each sample. For lighting calculations, the gradients are computed on the fly using the central differences at each voxel. These state changes exercise various parts of the graphics subsystem. This viewset makes use of hardware support for 3D textures and therefore trilinear interpolation.
Siemens NX (snx-03)
The snx-03 viewset was created from traces of the graphics workload generated by the NX 8.0 application from Siemens PLM. Model sizes range from 7.15 to 8.45 million vertices.
The viewset includes numerous rendering modes supported by the application, including wireframe, anti-aliasing, shaded, shaded with edges, and studio mode.
Solidworks viewset (sw-04)
The sw-04 viewset was created from traces of Dassault Systemes’ SolidWorks 2013 SP1 application. Models used in the viewset range in size from 2.1 to 21 million vertices.
The viewset includes numerous rendering modes supported by the application, including shaded mode, shaded with edges, ambient occlusion, shaders, and environment maps.
These charts are in dire need of splitting up and when we are not in the middle of a hellish launch schedule I will be dissecting them to make it much better for you guys.
Now to the performance, I can say I am pleased to see that AMD still enables more precision performance as evidenced by the higher Catia and Snx performance along with smaller gains on other tests. This tells me that AMD leaves very little on the table with their GPUs whereas certain tasks can be severely hamstrung on Nvidia end as some of the performance on mixed precision and different floating point and integer precision levels can be very limited which is why you see in some tests such as Catia the RX 5700 series GPUs are right up there with TITAN series GPUs or at least closer to them than to the desktop variants.
 Bjorn3D.com Bjorn3d.com – Satisfying Your Daily Tech Cravings Since 1996


Hot and loud and performance is ok but not great.
It was truly not very hot or loud in my experience. I have seen some who have reported that issue but my card under gaming loading never got anywhere above expected GPU temps. I do wish it had more headroom, but we will find out as WATTMAN was still pretty sketchy when we got a last-minute driver to test it.