Testing & Methodology
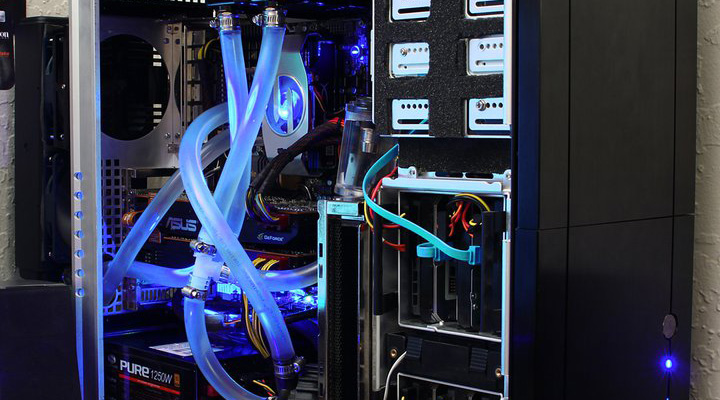
We’ve expanded our testing suite considerably since the X79 chipset release, and will continue to use the same methods for most of the motherboards and CPU’s we test. In the interests of thoroughness and accurate results, we run each test at least three times, and some tests more than that. We average the total of all the tests from each benchmark then report the average here.
The OS we use is Windows 7 Pro 64bit with all patches and updates applied. We also use the latest drivers available for the motherboard and any devices attached to the computer. We do not disable background tasks or tweak the OS or system in any way. We turn off drive indexing and daily defragging. We also turn off Prefetch and Superfetch. This is not an attempt to produce bigger benchmark numbers. Drive indexing and defragging can interfere with testing and produce confusing numbers. If a test were to be run while a drive was being indexed or defragged, and then the same test was later run when these processes were off, the two results would be contradictory and erroneous. As we cannot control when defragging and indexing occur precisely enough to guarantee that they won’t interfere with testing, we opt to disable the features entirely.
Prefetch tries to predict what users will load the next time they boot the machine by caching the relevant files and storing them for later use. We want to learn how the program runs without any of the files being cached, and we disable it so that each test run we do not have to clear pre-fetch to get accurate numbers. Lastly we disable Superfetch. Superfetch loads often-used programs into the memory. It is one of the reasons that Windows occupies so much memory. Vista fills the memory in an attempt to predict what users will load. Having one test run with files cached, and another test run with the files un-cached would result in inaccurate numbers. Again, since we can’t control its timings so precisely, it we turn it off. Because these four features can potentially interfere with benchmarking, and and are out of our control, we disable them. We do not disable anything else.
One thing to note is that we are revamping our testing method in order to better represent motherboard performance and offering to you guys the consumer. Also we want to make it an easier read for you without miles of endless charts. Please feel free to provide feedback on what you think as many benchmarks will be shuffled or removed completely.
Test Rig
| Test Rig | |
| Case | Open Test Bench |
| CPUs |
|
| Motherboards |
|
| Ram | GSkill TridentX 2666MHz |
| CPU Cooler | Swiftech 240mm rad custom loop |
| Hard Drives | Western Digital Velociraptor 1TB 10000RPM 6Gb/s Hard Drive |
| SSD | 1x Kingston HyperX 240GB SATA III 6Gb/s SSD |
| Optical | ASUS DVD-Burner |
| GPU | Intel iGPU or Nvidia GTX 680 |
| PSU | Thermaltake Toughpower XT 1475W Gold |
| Mouse | Tt eSPORTS Black Gaming Mouse |
| Keyboard | Tt eSPORTS Meka G1 Mechanical Gaming Keyboard |
Test Suite
We will use the following applications to test the performance of the MSI Z87I Gaming AC Motherboard.
| Benchmarks |
|---|
| SuperPi Mod 1.5 |
| Wprime 1.55 |
| PCMark 7 |
| 3DMark 11 |
| Cinebench R11.5 |
| X264HD |
| Truecrypt 7.1 |
| Unigine Heaven 4.0 |
| Metro 2033 |
| Batman Arkham City |
| Sniper Elite V2 |
PCmark 7

In PCMark we can see that the little ITX gaming board does quite well improving performance in many aspects especially when overclocked.
3DMark 11

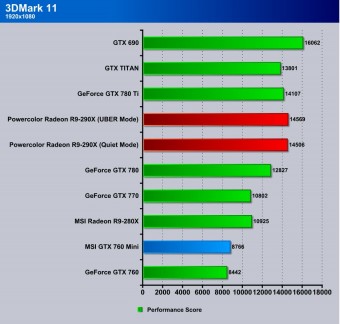
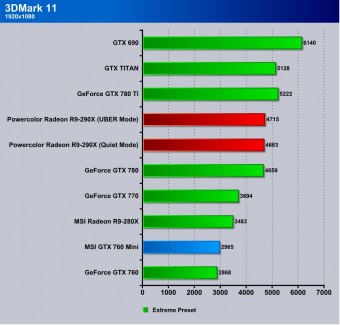
here we focus on the Physics side of things in the 3DMark 11 test and as you can see the mini Gaming board when combined with the 760 makes a potent player for a small build although if you need more punch and are not space constrained there is room to grow.
SuperPi
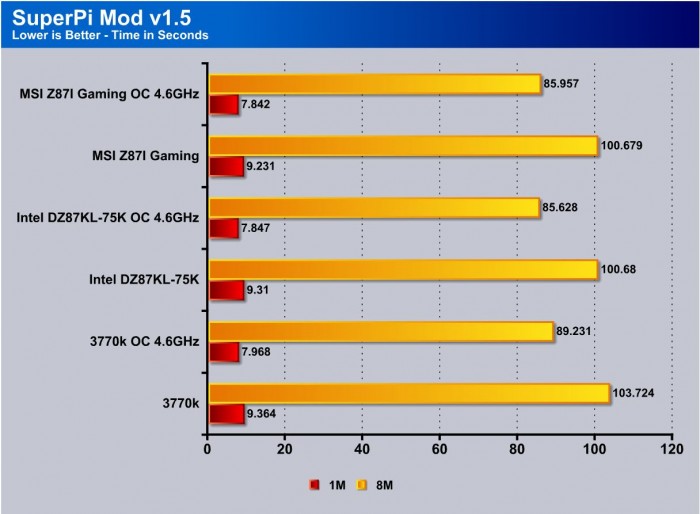
This tests single threaded performance and clock efficiency by processing digits of the number pi. Going from the previous gen Z77 to Z87 yields a nice efficiency jump clock for clock, and here we can see that as time has gone on the BIOS optimizations have paid off as efficiency has gotten better and here you can see that even similar configured and clocked the gaming mini board surpasses the original Intel board.
Wprime
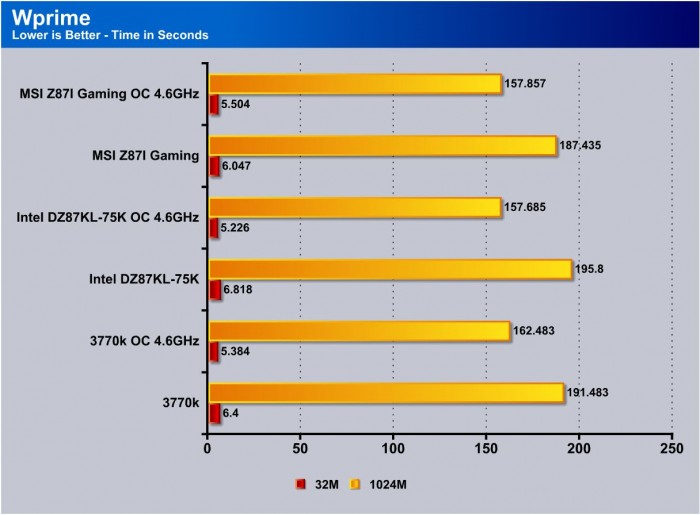
WPrime is similar to Superpi, but is multi core aware and you can set the core count. We used 8 threads to take advantage of the 4770K’s HyperThreading ability. Here you can see that the efficiency in multi core processing improves as you can see a pretty nice gain going from Z77 to Z87, and even more so when overclocked. We are quite excited to see what this platform can do as we get our hands on more boards to test real world performance.
On the Mini ITX Gaming board once again we are just about right on par with the reference Intel setup and who knows with a little bit of time to improve the BIOS a touch we could see it be a top contender.
X264HD

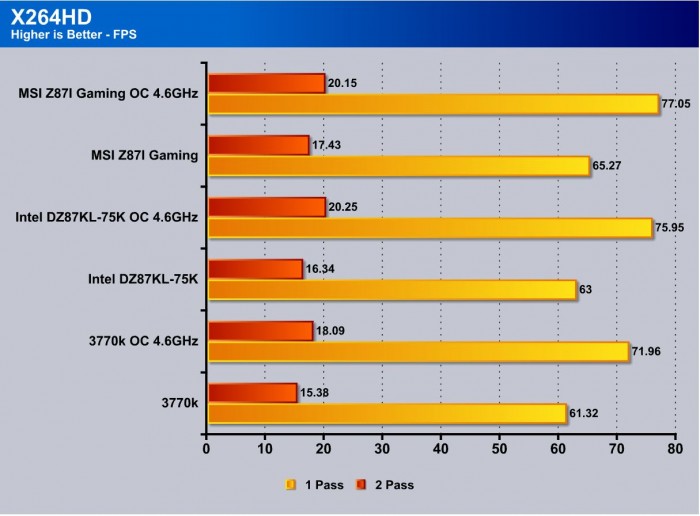
Transcoding has become more popular now and the latest Sandy Bridge processor added support for AVX instruction for faster video transcoding. With that you can see that going from Ivy Bridge to Haswell can net you some very good gains, especially a 2FPS gain on 2 Pass. This tells us that overall optimizations to the new platform are present and working very well. This shows well on the Mini ITX Gaming board as it once again shows results mirroring the reference Intel setup.
Truecrypt 7.1

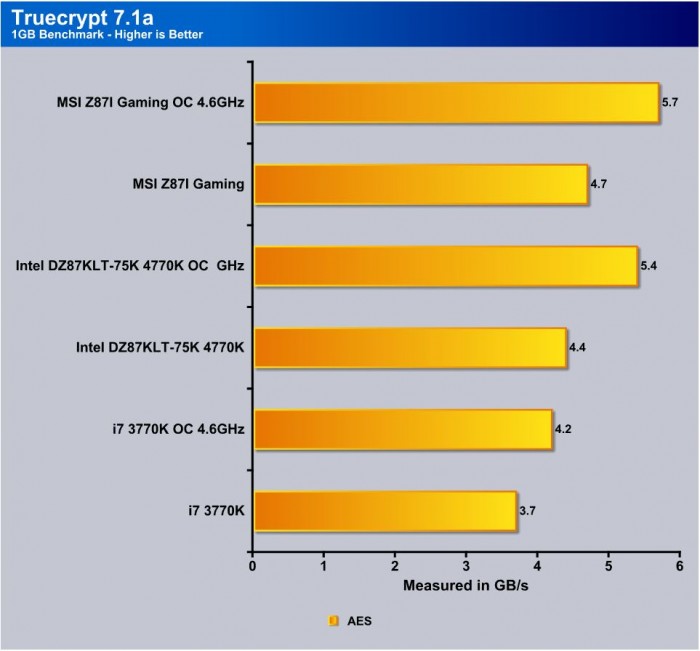
TrueCrypt is a real world application that gives a good indication of the true performance of our latest processor. Here the new Core i7 4770K puts some definite room between itself and the outgoing 3770K with over a 22% performance increase, which means in the same time you can get a lot more work done. Here with the MSI board you see a small performance improvement at stock but also at overclock as well.
Unigine Heaven 4.0

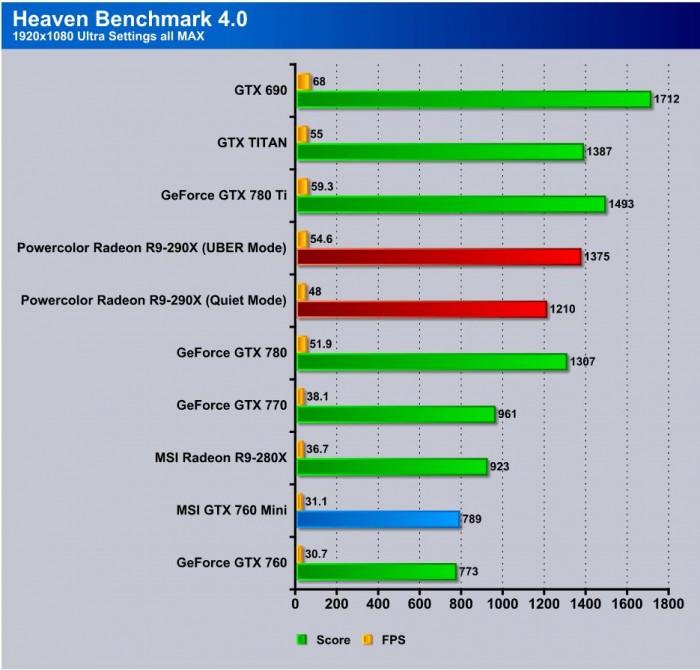
Unigine Heaven is a benchmark program based on Unigine Corp’s latest engine, Unigine. The engine features DirectX 11, Hardware tessellation, DirectCompute, and Shader Model 5.0. All of these new technologies combined with the ability to run each card through the same exact test means this benchmark should be in our arsenal for a long time.
Unigine Heaven with the ITX 760 model does well with a .4FPS increase in Heaven which is not huge but with such a stressful test it actually is pretty significant.
Metro 2033

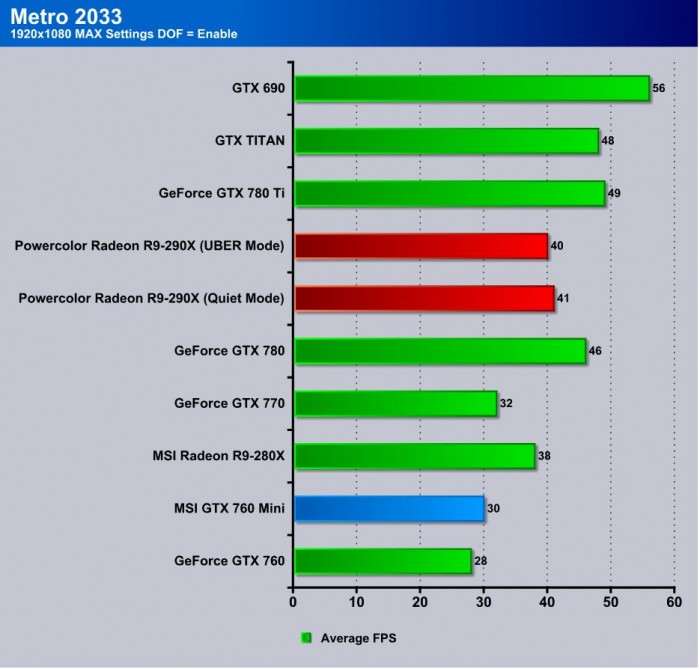
Metro 2033 shows a average FPS of 2 Higher than the reference Nvidia 760 card which shows that even the mini card can promise some big results.
Batman Arkham City
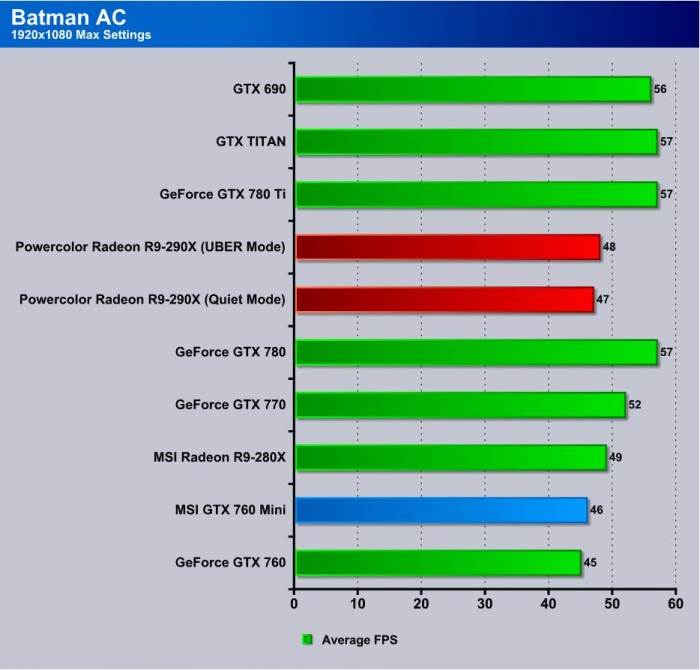
The results for Batman Arkham City show that a 1FPS increase are capable from the reference model.
Sniper Elite V2
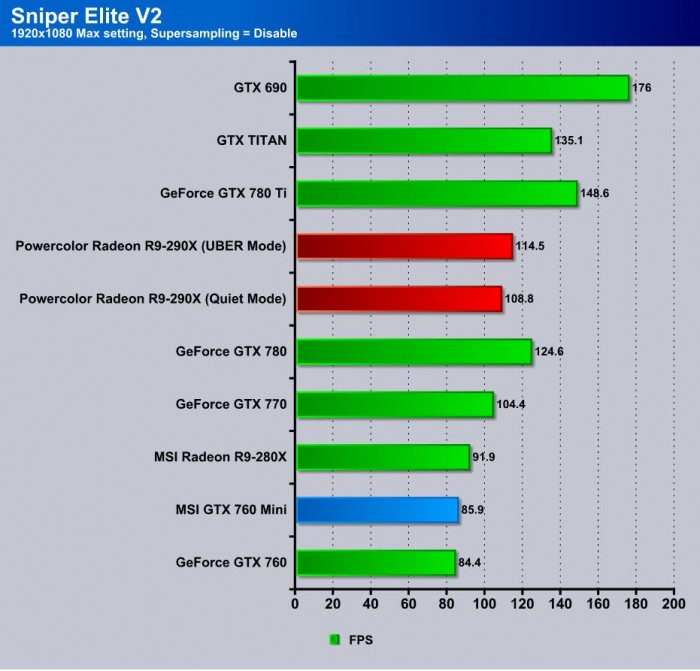
Sniper Elite V2 with this pair is very capable with FPS levels exceeding 80 FPS which means that there should be no stutters or issues in the mini ITX configuration.
Review Overview
Performance - 9
Value - 9
Quality - 9
Features - 9.5
Innovation - 9
9.1
MSI stepped into the Mini ITX game ready to run with both a capable motherboard with good feature set and even a mini card to ensure you have the whole package.
 Bjorn3D.com Bjorn3d.com – Satisfying Your Daily Tech Cravings Since 1996






Clearly sponsored by MSI when you could of got a mini itx 970 😉