Testing Methodology
The OS we use is Windows 8 Pro 64bit with all patches and updates applied. We also use the latest drivers available for the motherboard and any devices attached to the computer. We do not disable background tasks or tweak the OS or system in any way. We turn off drive indexing and daily defragging. We also turn off Prefetch and Superfetch. This is not an attempt to produce bigger benchmark numbers. Drive indexing and defragging can interfere with testing and produce confusing numbers. If a test were to be run while a drive was being indexed or defragged, and then the same test was later run when these processes were off, the two results would be contradictory and erroneous. As we cannot control when defragging and indexing occur precisely enough to guarantee that they won’t interfere with testing, we opt to disable the features entirely.
Prefetch tries to predict what users will load the next time they boot the machine by caching the relevant files and storing them for later use. We want to learn how the program runs without any of the files being cached, and we disable it so that each test run we do not have to clear pre-fetch to get accurate numbers. Lastly we disable Superfetch. Superfetch loads often-used programs into the memory. It is one of the reasons that Windows Vista occupies so much memory. Vista fills the memory in an attempt to predict what users will load. Having one test run with files cached, and another test run with the files un-cached would result in inaccurate numbers. Again, since we can’t control its timings so precisely, it we turn it off. Because these four features can potentially interfere with benchmarking, and and are out of our control, we disable them. We do not disable anything else.
We ran each test a total of 3 times, and reported the average score from all three scores. Benchmark screenshots are of the median result. Anomalous results were discounted and the benchmarks were rerun.
Test Rig
| Case | Thermaltake Level 10 |
| CPUs | Intel Core i7-3930 @3.2 Ghz |
| Motherboards | ASUS P79X Deluxe |
| Ram | 32 GB |
| CPU Cooler | Corsair H100 |
| GPU |
R9 280X Crossfire HIS R9 280X IceQ X2 Turbo HIS R9 270X IceQ X2 Turbo Gigabyte GTX 770 2 GB Zotac GeForce GTX 760 AMP! Zotac GeForce GTX 770 Zotac GeForce GTX 780 Asus GeForce GTX Titan Zotac GeForce GTX Titan AMP! Zotac GeForce GTX 680 |
| AMD |
Catalyst 13.11 Beta 3 |
| GeForce Drivers |
331.40 (Gigabyte GTX 770) 320.14 (GTX 680, 690 and TITAN) 320.18 (GTX 780, GTX760 AMP!) 320.08 (GTX 770) – This is the version included on the CD, none of the downloadable worked. |
Synthetic Benchmarks
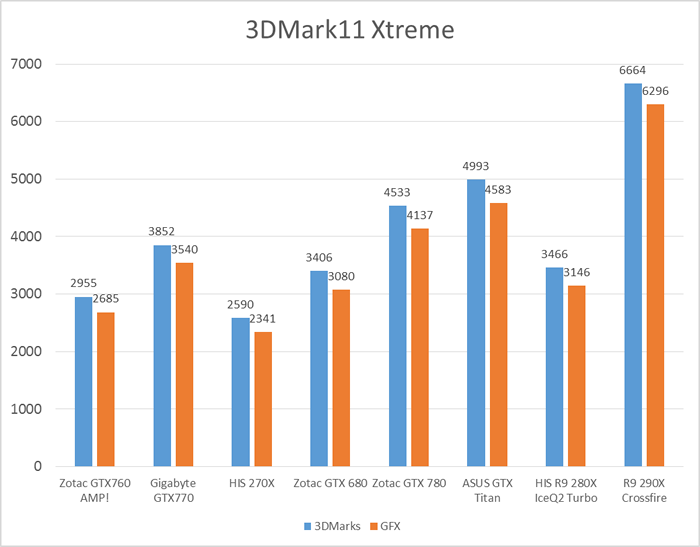
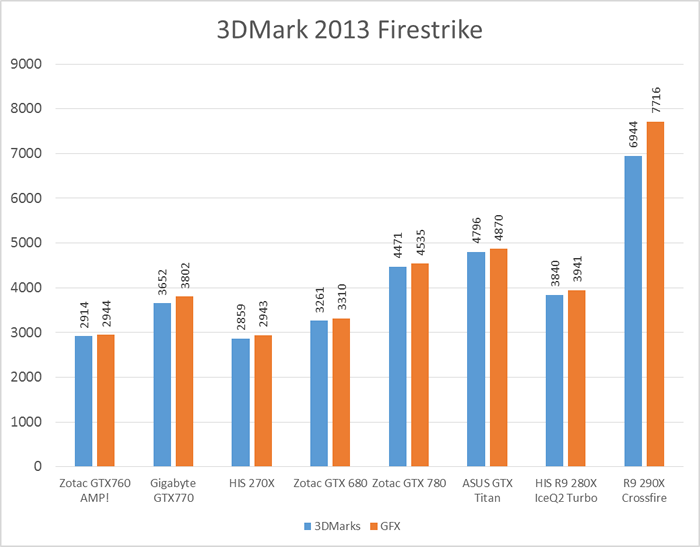
Setting: Extreme
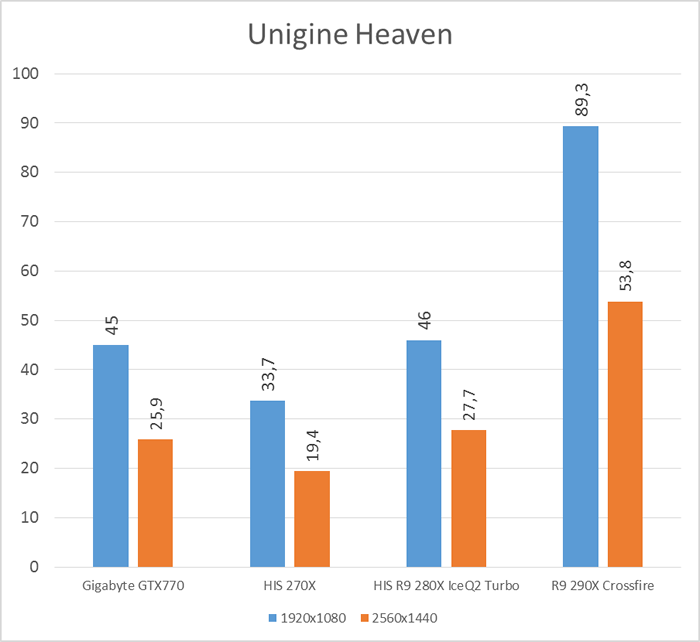
Settings: Ultra, Tesselation Normal, 8xAA
The syntetich benchmarks has the HIS R9 280X IceQ X2 Turbo tied with the Gigabyte GTX 770 which is not bad as the Gigabyte GTX 770 is a bit more expensive. In the syntethic benchmarks we see a nice scaling when using two 280X in CrossfireX.
Gaming Benchmarks
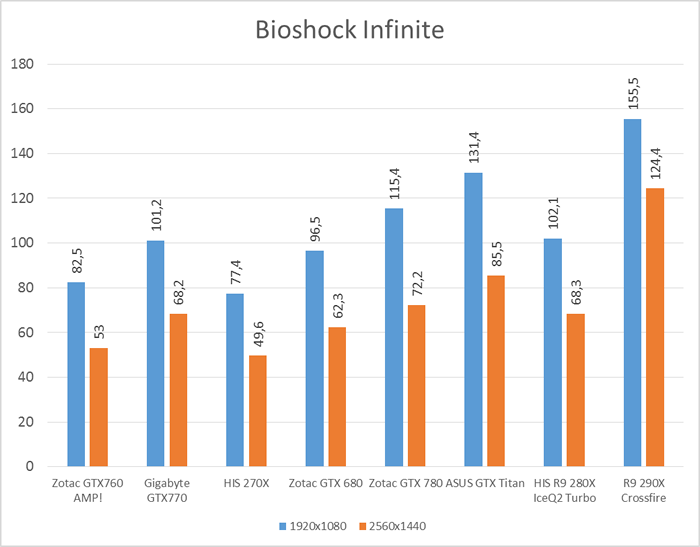
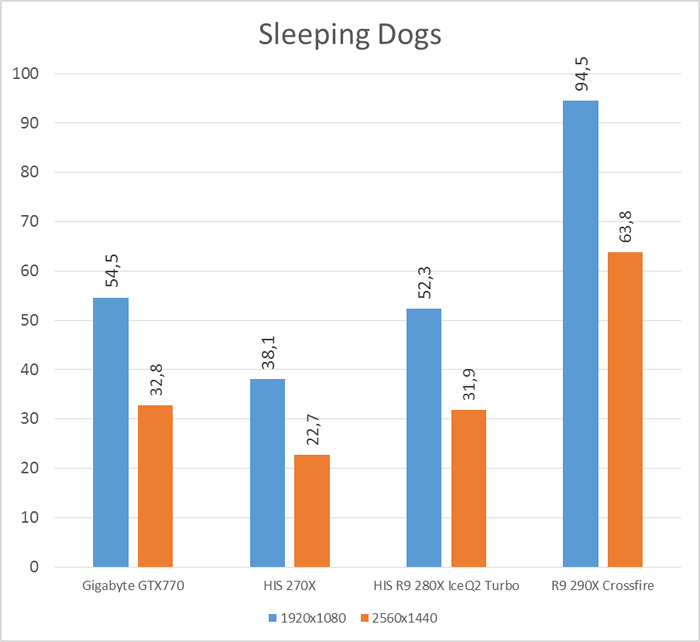
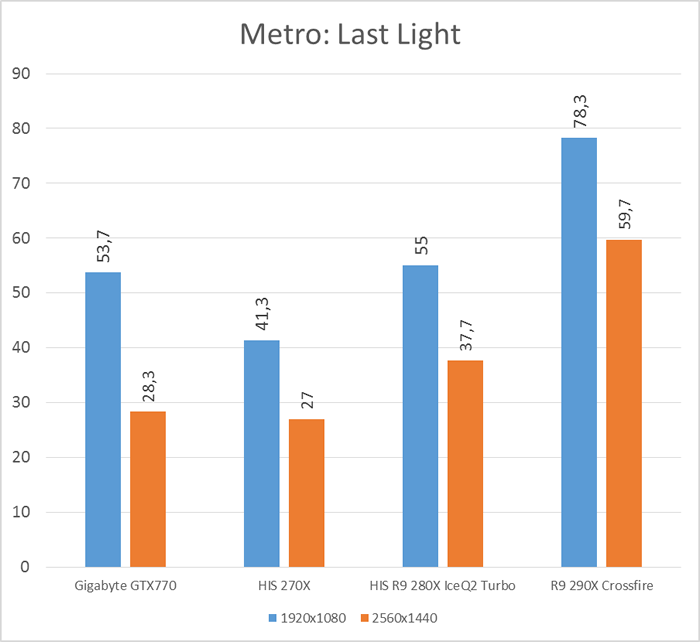
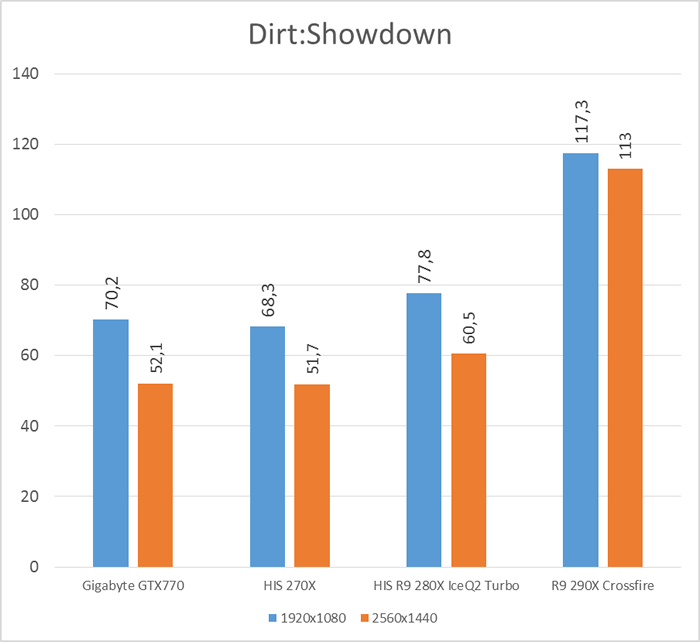
When we move to proper games the situation is pretty similar. The HIS R9 280X IceQ2 X2 Turbo manages to hold its own against the more expensive Gigabyte GTX770 and in fact beat it in several games when we move up to 2560×1440. What impresses us is the performance we get with a card that does not cost an arm and a leg. High end gaming has never been as affordable.
Review Overview
Performance - 8.8
Value - 9
Quality - 9
Features - 8.5
Innovation - 7.5
8.6
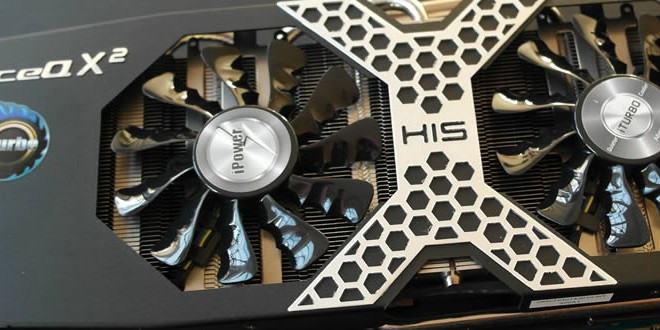
The HIS R9 280X IceQ X2 Turbo is a powerfull and affordable card with a great cooler. High-end gaming has never been as affordable.
 Bjorn3D.com Bjorn3d.com – Satisfying Your Daily Tech Cravings Since 1996
